

doi: 10.1038/nmeth.4183.
Epub 2017 Feb 20.
In vivo three-photon imaging of activity of GCaMP6-labeled neurons deep in intact mouse brain
Affiliations
- PMID: 28218900
- PMCID: PMC6441362
- DOI: 10.1038/nmeth.4183
Item in Clipboard
In vivo three-photon imaging of activity of GCaMP6-labeled neurons deep in intact mouse brain
Nat Methods.
2017 Apr.
Abstract
High-resolution optical imaging is critical to understanding brain function. We demonstrate that three-photon microscopy at 1,300-nm excitation enables functional imaging of GCaMP6s-labeled neurons beyond the depth limit of two-photon microscopy. We record spontaneous activity from up to 150 neurons in the hippocampal stratum pyramidale at ∼1-mm depth within an intact mouse brain. Our method creates opportunities for noninvasive recording of neuronal activity with high spatial and temporal resolution deep within scattering brain tissues.
Conflict of interest statement
COMPETING FINANCIAL INTERESTS
The authors declare no competing financial interests.
Figures
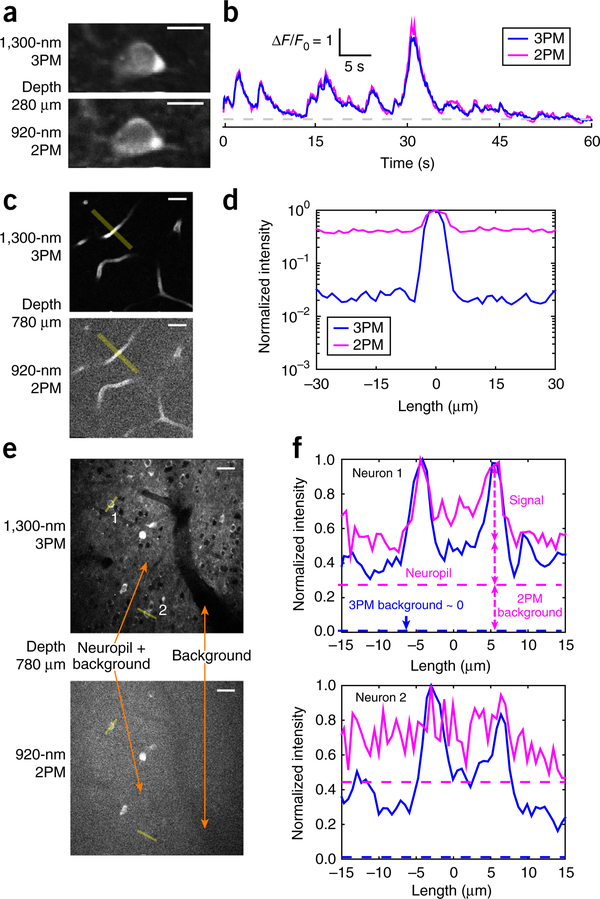
Comparison of 2PM at 920 nm and 3PM at 1,300 nm for in vivo mouse brain imaging. (a) Near-simultaneous 2P and 3P imaging of a GCaMP6s-labeled L2/3 neuron in transgenic mouse (CamKII-tTA/tetO-GCaMP6s) cortex located 280 μm below the dura. Scale bars, 10 μm. (b) Activity traces of the neuron in a. The traces are representative of 19 recordings. (c) Measurement of signal-to-background ratio (SBR) of 2PM and 3PM by imaging fluorescein-labeled blood vessel 780 μm deep in mouse cortex (wild type, C57BL/6J). The two images have comparable numbers of signal photons, and they were displayed with the same contrast setting (top 0.2% saturation). Scale bars, 30 μm. (d) Quantitative comparison of SBR of blood vessels in c. Intensity profiles are drawn along the light yellow lines in c, averaged over 7.2-μm line thickness. SBR of 2PM approaches 1 at 780 μm depth, and SBR of 3PM is one to two orders of magnitude higher. The line profile represents similar measurements done on eight blood vessel sections from 720 to 780 μm in depth. (e) Measurement of SBR of 2PM and 3PM by imaging GCaMP6s-labeled neurons 780 μm deep in transgenic mouse cortex (CamKII-tTA/tetO-GCaMP6s). The out-of-focus fluorescence is measured inside a blood vessel, which is indicated by the “Background” arrow. Neuropil and the out-of-focus background are indicated by the “Neuropil + Background” arrow. The two images have comparable number of signal photons, and were displayed with the same contrast settings (top 0.4% saturation). Scale bars, 30 μm. (f) Quantitative comparison of SBR and neuropil of two neurons in e. Intensity profiles are drawn along the light yellow lines in e, averaged over 3.5-μm line thickness. The line profiles represent similar measurement done on 20 neurons from 720 to 780 μm in depth.
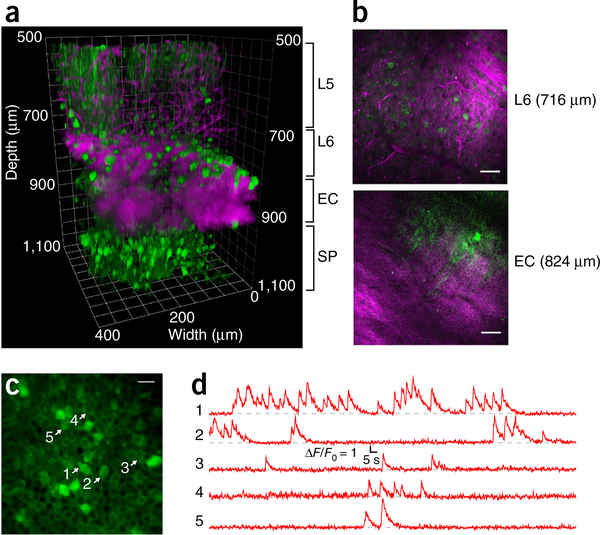
3PM of spontaneous activity in neuronal population labeled with GCaMP6s in the SP layer of the CA1 region of the mouse hippocampus. (a) 3D reconstruction of 3PM images of GCaMP6s-labeled neurons in the mouse cortex and the hippocampus (green, fluorescence; magenta, THG.). See Supplementary Video 1 for individual XY frames of the z-stack. (b) Selected XY frames at various depths in a. THG visualizes blood vessels and myelinated axons (green, fluorescence; magenta, THG). Scale bars, 50 μm. (c) Activity recording site in the SP layer of the hippocampus located at 984 μm beneath the dura with a field-of-view of 200 × 200 μm. Scale bar, 20 m. (d) Spontaneous activity recorded from the labeled neurons indicated in c. Additional traces from 30 active neurons are shown in Supplementary Figures 2–4 and Supplementary Video 2. The structural and functional imaging in this figure is representative of data from five animals.
Similar articles
-
Two-photon activation and excitation properties of PA-GFP in the 720-920-nm region.Biophys J. 2005 Aug;89(2):1346-52. doi: 10.1529/biophysj.104.054502. Epub 2005 May 20. Biophys J. 2005. PMID: 15908572 Free PMC article.
-
Quantitative analysis of 1300-nm three-photon calcium imaging in the mouse brain.Elife. 2020 Jan 30;9:e53205. doi: 10.7554/eLife.53205. Elife. 2020. PMID: 31999253 Free PMC article.
-
Three-photon imaging of synthetic dyes in deep layers of the neocortex.Sci Rep. 2020 Oct 1;10(1):16351. doi: 10.1038/s41598-020-73438-w. Sci Rep. 2020. PMID: 33004996 Free PMC article.
-
Advanced observation of brain and nerve cells using two-photon microscopy with novel techniques.Microscopy (Oxf). 2023 Apr 6;72(2):144-150. doi: 10.1093/jmicro/dfac047. Microscopy (Oxf). 2023. PMID: 36130254 Review.
-
Focusing new light on brain functions: multiphoton microscopy for deep and super-resolution imaging.Neurosci Res. 2022 Jun;179:24-30. doi: 10.1016/j.neures.2021.11.011. Epub 2021 Nov 30. Neurosci Res. 2022. PMID: 34861295 Review.
Cited by
-
Long-working-distance high-collection-efficiency three-photon microscopy for in vivo long-term imaging of zebrafish and organoids.iScience. 2024 Jul 19;27(8):110554. doi: 10.1016/j.isci.2024.110554. eCollection 2024 Aug 16. iScience. 2024. PMID: 39184441 Free PMC article.
-
Spatio-temporal parameters for optical probing of neuronal activity.Biophys Rev. 2021 Feb 23;13(1):13-33. doi: 10.1007/s12551-021-00780-2. eCollection 2021 Feb. Biophys Rev. 2021. PMID: 33747244 Free PMC article. Review.
-
Label-free highly multimodal nonlinear endoscope.Opt Express. 2022 Jul 4;30(14):25020-25033. doi: 10.1364/OE.462361. Opt Express. 2022. PMID: 36237042 Free PMC article.
-
A 250 μm × 57 μm Microscale Opto-electronically Transduced Electrodes (MOTEs) for Neural Recording.IEEE Trans Biomed Circuits Syst. 2018 Dec;12(6):1256-1266. doi: 10.1109/TBCAS.2018.2876069. Epub 2018 Oct 15. IEEE Trans Biomed Circuits Syst. 2018. PMID: 30334768 Free PMC article.
-
Three-photon imaging of mouse brain structure and function through the intact skull.Nat Methods. 2018 Oct;15(10):789-792. doi: 10.1038/s41592-018-0115-y. Epub 2018 Sep 10. Nat Methods. 2018. PMID: 30202059 Free PMC article.
References
MeSH terms
Substances
Grants and funding
LinkOut - more resources
Full Text Sources
Other Literature Sources
