. 2017 Mar;19(3):238-251.
doi: 10.1038/ncb3473. Epub 2017 Feb 20.

The LINK-A lncRNA interacts with PtdIns(3,4,5)P3 to hyperactivate AKT and confer resistance to AKT inhibitors

Affiliations

The LINK-A lncRNA interacts with PtdIns(3,4,5)P3 to hyperactivate AKT and confer resistance to AKT inhibitors

Aifu Lin et al. Nat Cell Biol. 2017 Mar.

Abstract

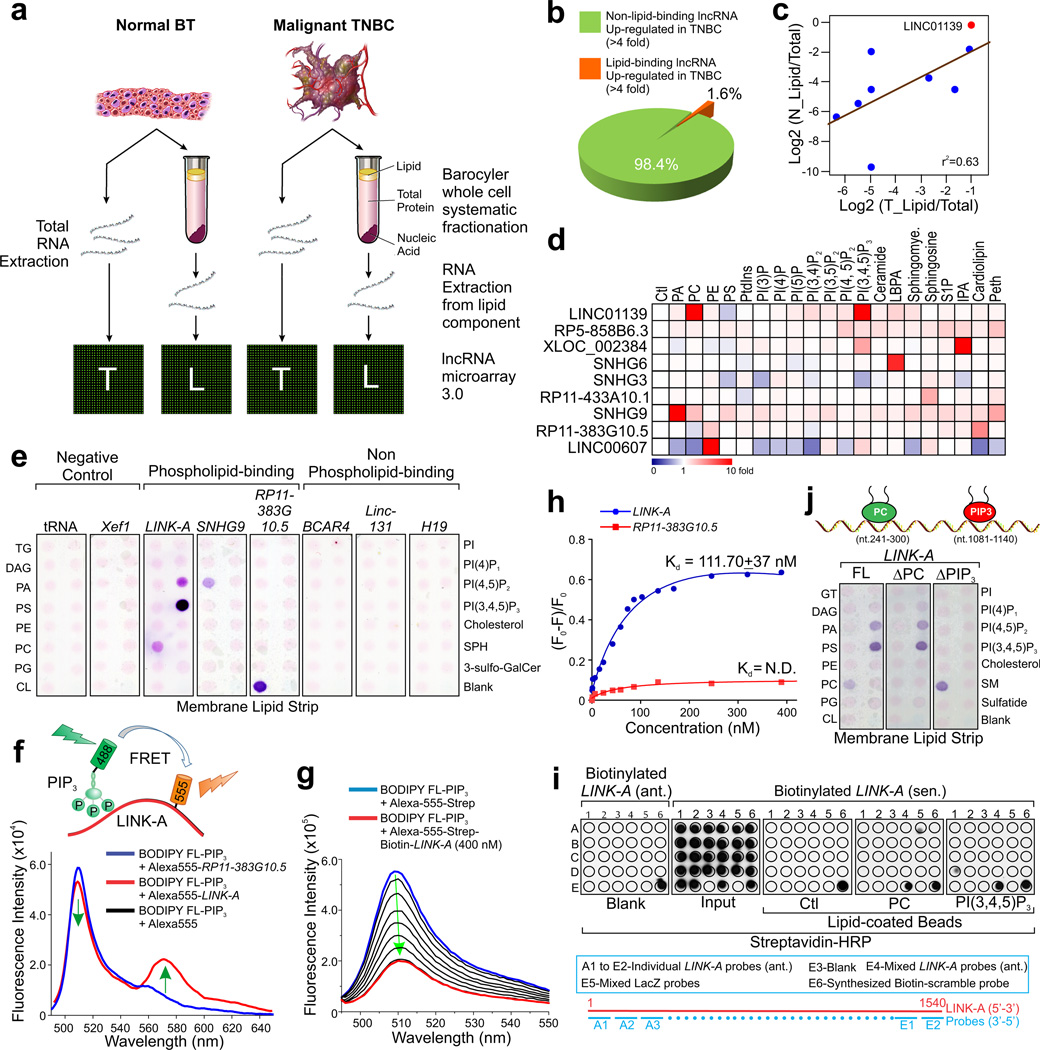
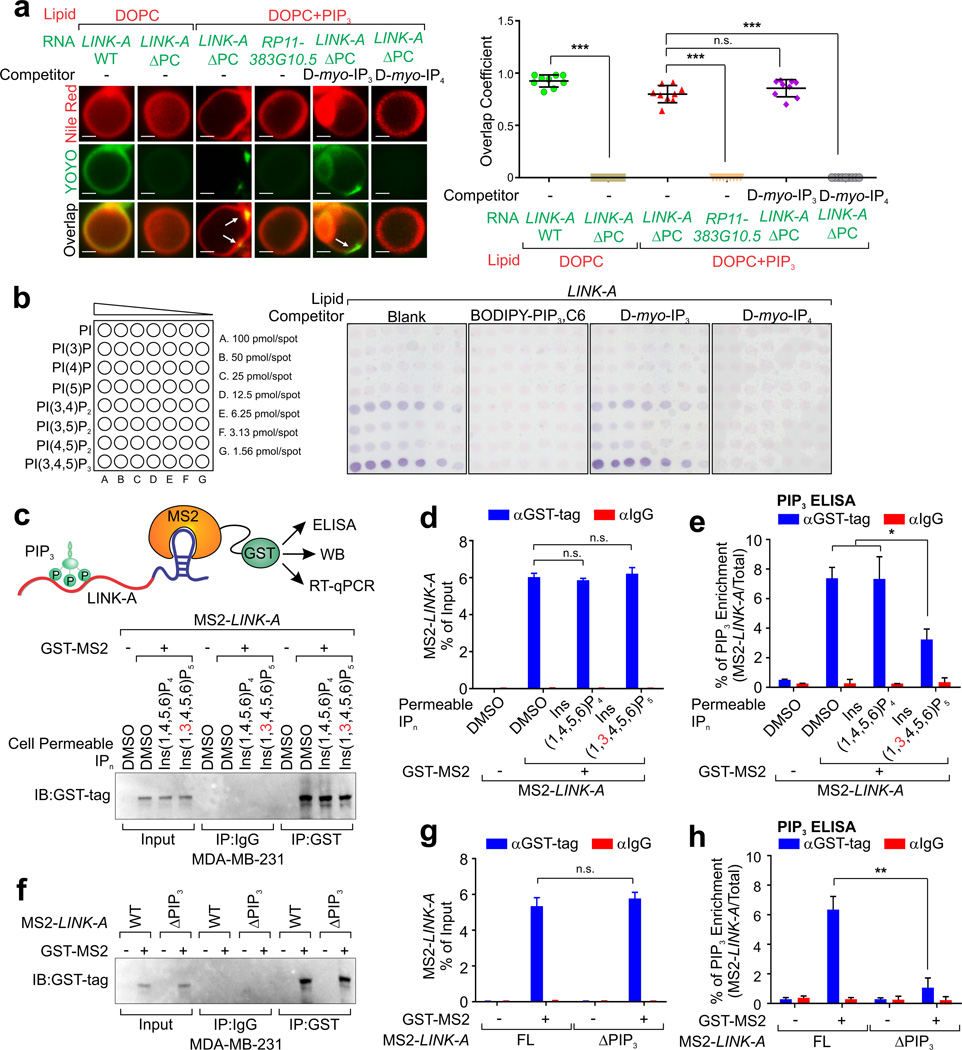
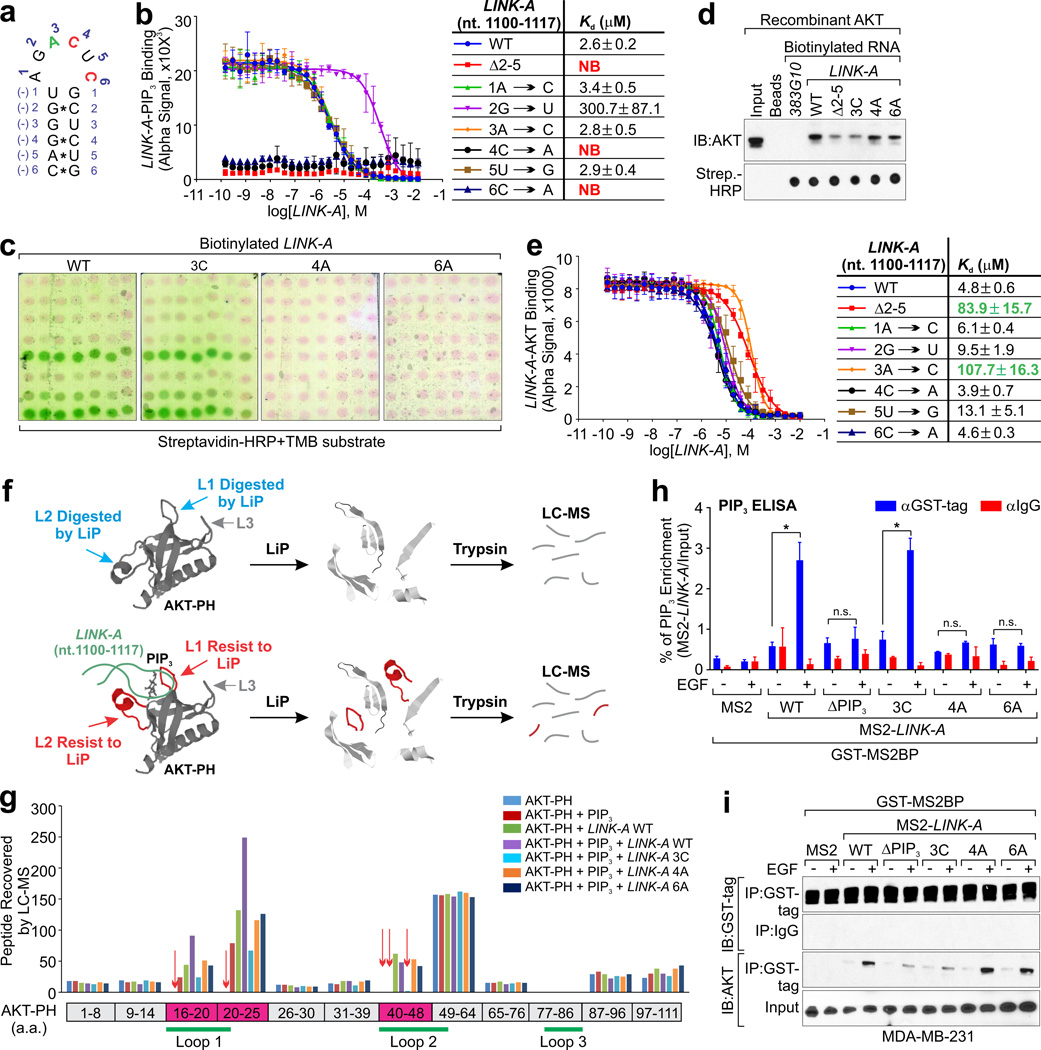
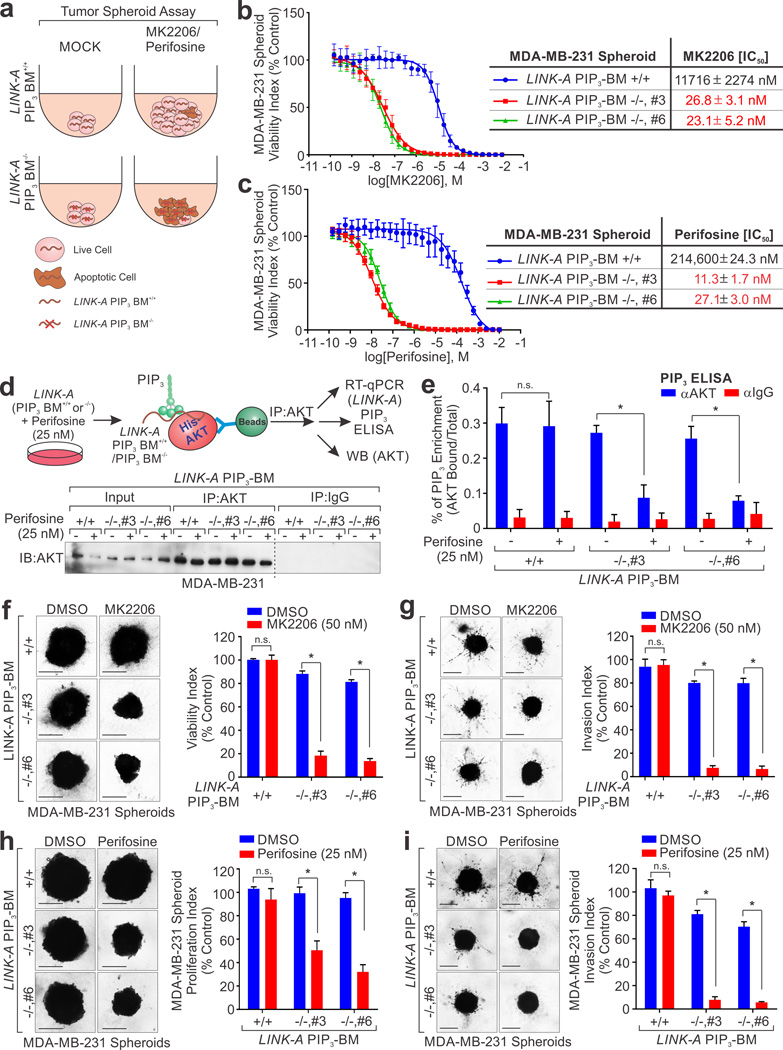
Phosphatidylinositol-3,4,5-trisphosphate (PtdIns(3,4,5)P3 or PIP3) mediates signalling pathways as a second messenger in response to extracellular signals. Although primordial functions of phospholipids and RNAs have been hypothesized in the 'RNA world', physiological RNA-phospholipid interactions and their involvement in essential cellular processes have remained a mystery. We explicate the contribution of lipid-binding long non-coding RNAs (lncRNAs) in cancer cells. Among them, long intergenic non-coding RNA for kinase activation (LINK-A) directly interacts with the AKT pleckstrin homology domain and PIP3 at the single-nucleotide level, facilitating AKT-PIP3 interaction and consequent enzymatic activation. LINK-A-dependent AKT hyperactivation leads to tumorigenesis and resistance to AKT inhibitors. Genomic deletions of the LINK-A PIP3-binding motif dramatically sensitized breast cancer cells to AKT inhibitors. Furthermore, meta-analysis showed the correlation between LINK-A expression and incidence of a single nucleotide polymorphism (rs12095274: A > G), AKT phosphorylation status, and poor outcomes for breast and lung cancer patients. PIP3-binding lncRNA modulates AKT activation with broad clinical implications.


Figures

Figure 1
Figure 1. Global identification of lipid-interacting lncRNAs and characterization of LINK-A-lipid interaction
(a) Experimental scheme for identification of lipid-bound lncRNAs in triple-negative breast cancer (TNBC). (b) Pie chart of percentage of TNBC-upregulated lncRNAs that associated with cellular lipids. (c) Scatter blot representing lipid enrichment of top 9 lncRNAs in normal breast tissue (N) or malignant breast cancer (T). X and Y axis represent log2 scale of normalized lncRNA density (Lipid/Total). (d) Heatmap of lipid enrichment of top 9 lncRNAs based on lipid-RNA pulldown followed by RT-qPCR. Red/blue indicates increased/decreased fold change in lipid enrichment over control beads. (e) RNA-lipid overlay assay showing binding of LINK-A to PC and PIP3. In vitro transcribed biotinylated RNA transcripts, as indicated, were applied to membrane lipid strips. (f) Upper panel: graphic illustration of the PIP3-LINK-A interaction detected by FRET assay. Lower panel: fluorescence spectra of BODIPY FL-PIP3 (donor) in the presence of Alexa-555-Strep (blue) or Alexa-555-Strep-biotin-LINK-A (red; λexc = 475 nm). (g) Representative fluorescence spectra of BODIPY FL-PIP3 upon titration of increasing concentrations of LINK-A (0 ~ 400 nM; λexc = 490 nm). (h) Fitting the fluorescence quenching of BODIPY FL-PIP3 induced by LINK-A with one site binding equation. Data fitting yielded a dissociation constant (Kd) of 112 ± 37 nM (mean ± s.e.m. were derived from n=3 independent experiments). (i) In vitro RNA-lipid binding using in vitro transcribed biotinylated LINK-A sense or antisense, and lipid-coated beads followed by dot-blot assays (upper panel). Bottom panel: graphic illustration of oligonucleotides base-pairing LINK-A sequence. (j) Upper panel: graphic illustration of LINK-A-PC/PIP3 binding. Lower panel: RNA-lipid overlay assay showing the binding of full-length LINK-A and PC- or PIP3-binding region deletion transcripts (ΔPC and ΔPIP3, respectively).
Figure 2
Figure 2. Characterization of LINK-A-PIP3 interaction
(a) Fluorescence microscopy analysis reveals the interaction between lipid vesicles (visualized by Nile Red) and indicated lncRNA (visualized by YOYO-1), in the absence or presence of the PIP competitor D-myo-Inositol 1,4,5-tetraphosphate (IP3) or D-myo-Inositol 1,3,4,5-tetraphosphate (IP4) at 100:1 molar ratio to PIP3 (IP3/IP4: PIP3). Left panel: representative images. Scale bars, 50 nm. Right panel: the quantification of lncRNA-lipid vesicle interactions is represented by calculations of overlap coefficients between lipid vesicles (channel 1, Nile Red) and lncRNA (channel 2, YOYO-1) (n=9 lipid vesicles; median, one-way ANOVA, n.s. p>0.05 and ***p<0.001). (b) RNA-lipid overlay assay showing the binding of LINK-A to PIPs in the absence or presence of soluble BODIPY®-FL PIP3, IP3, or IP4 at a molar ratio of 100:1 (lipid:RNA). (c–e) Determination of interaction between PIP3 and LINK-A by MS2-TRAP assay. Upper panel: schematic illustration of MS2-TRAP assay (c). MS2-tagged LINK-A and its associated protein/lipid complexes were pulled down by anti-GST antibodies from cells treated with DMSO, cell permeable PI(1,4,5,6)P4 or PI(1,3,4,5,6)P5 (100 µM, 2 hrs) followed by immunoblotting (c, lower panel), RT-qPCR (d), and PIP3 mass ELISA (e). (f–h) MS2-TRAP analysis of full-length LINK-A or ΔPIP3 deletion mutant associated protein/lipid complexes by immunoblotting (f), RT-qPCR (g), and PIP3 mass ELISA (h). For d, e, g and h, mean ± s.e.m. were derived from n=3 independent experiments (n.s. p>0.05, *p<0.05 and **p<0.01, two-tailed paired Student’s t-test). Statistics source data for a are in Supplementary Table 6.
Figure 3
Figure 3. LINK-A enhances AKT-PIP3 interaction and AKT kinase activation
(a) Lipid-RNA-protein overlay assay revealing AKT-PIP3 interaction in the absence or presence of FL LINK-A or ΔPIP3 deletion transcript. Cardiolipin-binding lncRNA RP11-383G10.5 serves as a negative control. (b) Schematic illustration of Alpha-based AKT-PIP3 binding assay. (c) Saturation curve used to determine Kd of the interactions between AKT and biotinylated-PIP3 (left panel), -PIP2 (middle panel), and -PI(4)P (right panel) in Alpha format (mean ± s.e.m. were derived from n=3 independent experiments). (d) Left panel: competition binding assay to determine Kd for a biotinylated PIP3 (0.4 µM)-His6-AKT (0.4 µM) interaction in the presence of indicated RNA transcripts. Unlabeled PIP3 was titrated from 33 µM to 0.25 nM. Right panel: summary of Kd values (mean ± s.e.m. were derived from n=3 independent experiments). (e) Association between LINK-A and AKT in vivo detected by RIP assay using AKT antibody in MDA-MB-231 cells treated with EGF. (f and g) Immunoblotting of AKT pathway components in MDA-MB-231 cells transfected with control or LINK-A siRNAs followed by EGF treatment (f), or transduced with control or LINK-A shRNA (g). (h) Immunoblotting of AKT retrieved by immunoprecipitates using indicated PIP-coated beads from MDA-MB-231 cell transfected with indicated siRNAs followed by EGF treatment. (i) Quantification of AKT kinase activity in cell lysates extracted from MDA-MB-231 cells transfected with LNA against LINK-A followed by overexpression of indicated rescue vectors and EGF treatment. For e and i, mean ± s.e.m. were derived from n=3 independent experiments (*p<0.05 and **p<0.01, two-tailed paired Student’s t-test). Unprocessed original scans of all blots with size marker are shown in Supplementary Fig. 9.
Figure 4
Figure 4. Molecular mechanisms of LINK-A-PIP3-AKT interaction
(a) Schematic illustration of the stem-loop structure of LINK-A nt. 1,100–1,117. (b) Competition Alpha binding assay to determine Kd for a biotinylated PIP3: DIG-LINK-A oligonucleotides interaction in the presence of full-length LINK-A. Unlabeled LINK-A was titrated from 10 mM to 0.1 nM (mean ± s.e.m. were derived from n=3 independent experiments). (c) RNA-lipid overlay assay showing the binding of wild-type LINK-A or mutants to PIP array using TMB substrates. (d) In vitro RNA pull-down using biotinylated RNAs as indicated and recombinant AKT. The immunoprecipitates were subjected to IB detection using anti-AKT antibody. The presence of RNA transcripts were detected by streptavidin-HRP using dot-blot assay. (e) Competition binding assay to determine Kd for a DIG-LINK-A: His-AKT interaction in the presence of FL LINK-A titrated from 10 mM to 0.1 nM (mean ± s.e.m. were derived from n=3 independent experiments). (f) Schematic illustration of LiP followed by LC-MS. (g) Recombinant AKT PH domain, and/or PIP3, wild-type LINK-A, 3C, 4A or 6A mutant were subjected to LiP followed by LC-MS. Recovered peptide number by LC-MS for each fragment of AKT PH domain were shown. (h and i) MS2-tagged LINK-A and its associated protein/lipid complexes were pulled down by anti-GST antibodies from cells transfected with indicated expression vectors followed by PIP3 mass ELISA (h) or IB detection using indicated antibodies (i). For h, mean ± s.e.m. was derived from n=3 independent experiments (n.s. p>0.05 and *p<0.05, two-tailed paired Student’s t-test). Unprocessed original scans of all blots with size marker are shown in Supplementary Fig. 9.
Figure 5
Figure 5. Functional involvement of LINK-A-PIP3 interaction in mediating AKT activation
(a and b) Detection of PIP3 (a) and phospho-AKT (b) level in DLD-1 PIK3CA+/+ or PIK3CA−/− cells with or without EGF stimulation. (c) Schematic illustration of intracellular delivery of PIP3 and/or LINK-A to DLD-1 cells. (d and e) RT-qPCR determination of LINK-A copy number (d) or IB detection of indicated proteins (e) in DLD-1 PIK3CA+/+ cells delivered with indicated RNA transcripts with or without EGF stimulation. (f–h) PIP3 mass ELISA (f), RT-qPCR determination of LINK-A copy number (g) or IB detection of indicated proteins (h) in DLD-1 PIK3CA+/− cells delivered with PIP3 and/or LINK-A transcripts with or without EGF stimulation. (i–k) PIP3 mass ELISA (i), RT-qPCR determination of LINK-A copy number (j) or IB detection of indicated proteins (k) in DLD-1 PIK3CA+/− cells delivered with PIP3 and indicated LINK-A deletion transcripts with or without EGF stimulation. (l) IB detection of indicated proteins in DLD-1 PIK3CA+/− cells delivered with PIP3 and indicated LINK-A single nucleotide mutated transcripts with or without EGF stimulation. (m and n) IB detection of immunoprecipitated AKT (m) and quantification of AKT-associated PIP3 (n) in DLD-1 PIK3CA+/+ cells delivered with indicated LINK-A single nucleotide mutated transcripts with or without EGF stimulation. For a, d, f, g, i, j and n, mean ± s.e.m. were derived from n=3 independent experiments (n.s. p>0.05, *p<0.05, and ***p<0.001, two-tailed paired Student’s t-test). Unprocessed original scans of all blots with size marker are shown in Supplementary Fig. 9.
Figure 6
Figure 6. LINK-A confers resistance to AKT inhibitors
(a) Competition binding assay to determine IC50 of indicated AKT inhibitors for inhibiting AKT-PIP3 binding (mean ± s.e.m. were derived from n=3 independent experiments). (b and c) Competition binding assays were used to determine IC50 of MK2206 (b) or perifosine (c) for inhibiting AKT-PIP3 binding in the presence of indicated RNA transcripts (mean ± s.e.m. were derived from n=3 independent experiments). (d) Schematic illustration of genetic depletion of LINK-A PIP3 binding sequence. (e) Upper panel: schematic illustration of detection of AKT-bound PIP3 in LINK-A genetic editing cells. Lower panel: IP and IB detection using anti-AKT antibody in LINK-A PIP3-BM+/+ and PIP3-BM−/− cells. (f and g) PIP3 mass ELISA detection of AKT-bound PIP3 (f) or IB detection of indicated proteins (g) in LINK-A PIP3-BM+/+ and PIP3-BM−/− cells with or without EGF stimulation. (h) Schematic illustration of quantitative measurement of AKT phosphorylation using Alpha assay. (i and j) Percentage of Alpha signal of p-AKT over total-AKT in LINK-A PIP3-BM+/+ and PIP3-BM−/− cells intracellularly delivered with indicated RNA transcript upon titration of EGF stimulation (i) or in the presence of EGF (200 nM) and titration of MK2206 (j). The EC50 of EGF (i, right panel) and IC50 of MK2206 (j, right panel) were shown (mean ± s.e.m. were derived from n=3 independent experiments). For f, mean ± s.e.m. were derived from n=3 independent experiments (n.s. p>0.05 and *p<0.05, two-tailed paired Student’s t-test). Unprocessed original scans of all blots with size marker are shown in Supplementary Fig. 9.
Figure 7
Figure 7. Depletion of LINK-A sensitize cancer cells to treatment of AKT inhibitors
(a) Schematic illustration of tumor spheroid assay using LINK-A PIP3-BM+/+ and PIP3-BM−/− cells. (b and c) 3-D spheroid fluorometric proliferation/viability assay conducted using LINK-A PIP3-BM+/+ or LINK-A PIP3-BM−/− spheroids to determine IC50 of MK2206 (b) or perifosine (c) (mean ± s.e.m. were derived from n=3 independent experiments). (d) Upper panel: schematic illustration of detection of AKT-bound PIP3 in LINK-A genetic editing cells treated with perifosine. Lower panel: IB detection using anti-AKT antibody in LINK-A PIP3-BM+/+ or LINK-A PIP3-BM−/− cells treated with 25 nM perifosine for 1 hour. The dotted line indicates the boundary of two separate blots whose uncropped images are shown in Supplementary Fig. 9. (e) PIP3 mass ELISA determination of AKT-associated PIP3 in LINK-A PIP3-BM+/+ or LINK-A PIP3-BM−/− cells treated with 25 nM perifosine for 1 hour. (f and g) Growth (f) and invasion (g) of LINK-A PIP3-BM+/+ or LINK-A PIP3-BM−/− spheroids after 4 days treatment with 50 nM MK2206. Left panels: phase contrast images of spheroids. Scale bars, 300 µm; Right panels: quantitative analysis of surface area for spheroids growth and invasion treated with DMSO or MK2206 (n=3 independent experiments based on 4 spheroids per group), presented as proliferation and invasion index respectively. (h and i) Growth (h) and invasion (i) of LINK-A PIP3-BM+/+ or LINK-A PIP3-BM−/− spheroids after 4 days treatment with 25 nM perifosine. Left panels: phase contrast images of spheroids. Scale bars, 300 µm; Right panels: quantitative analysis of surface area for spheroids growth and invasion treated with DMSO or perifosine (n=3 independent experiments based on 4 spheroids per group), presented as proliferation and invasion index respectively. For e–i, mean ± s.e.m. were derived from n=3 independent experiments (n.s. p>0.05 and *p<0.05, two-tailed paired Student’s t-test). Statistics source data for f, g, h and i are in Supplementary Table 6. Unprocessed original scans of all blots with size marker are shown in Supplementary Fig. 9.
Figure 8
Figure 8. Genetic variation of LINK-A correlates with breast cancer risk
(a) Somatic copy number variants (CNV) of LINK-A gene locus in multiple cancer types (n=376, 1,096, 36, 57, 573, 518, 470, 302, 504, 134, 185, 87, 179, 547, 593, 185, 412, 626, 1,090, 514, 80, 521, 443, 498, 532, 124, 166, 505, 616, 458, 883, 261, 48, 290, 92 and 66 tumor samples respectively). The boxes show the median and the interquartile range. The boxes show the median±1 quartile, with whiskers extending to the most extreme data point within 1.5 interquartile ranges from the box boundaries The red dot lines showing threshold of 0.2 in segment mean values was considered an amplification while −0.2 was considered a deletion. (b) SNP rs12095274 is significantly associated with survival of breast cancer in TCGA samples (n=765, 137, and 16 patients, log rank test). (c) SNP rs12095274 correlates with LINK-A expression in TCGA samples (n=765, 137, and 16 patients; ***p<0.001two-tailed Wilcoxon test). The boxes show the median±2 quartile, with whiskers extending to the most extreme data point within 2 interquartile ranges from the box boundaries. (d) Population distribution of SNP rs12095274. (e and f) Pearson’s correlation analysis comparing staining density between LINK-A and phospho-AKT (Thr308) (e) or phospho-AKT (Ser473) (f) status (n=40 breast tumors; ***p<0.001, Fisher’s exact test). (g) SNP rs12095274 correlates with phospho-AKT staining density in breast cancer tissues (n=79, 16 and 2 breast tumors; *p<0.05, median±1 quartile, one-way ANOVA). (h) SNP rs12095274 correlates with LINK-A expression detected by RT-qPCR in breast cancer tissues (n=102, 17 and 4 breast tumors; *p<0.05, median±1 quartile, one-way ANOVA). (i) Schematic illustration of LNA injection and PET scan. (j) Left panel: Representative PET/CT images of nude mice bearing breast tumors injected with scrambled or LINK-A LNA. White dotted lines indicate area of the breast tumors and black dotted lines indicate area of muscle tissues that were analyzed for in vivo glucose uptake. Right panel: Statistical analysis of in vivo glucose uptake on day 3 and day 6 (n=3 independent experiments based on 3 mice per group). (k) Effects of LINK-A LNA on growth of MDA-MB-231 xenografts in nude mice (n=3 mice per group). The arrow indicates the tumor burden. For j and k, mean ± s.e.m. were derived from n=3 independent experiments (*p<0.05 and **p<0.01, two-tailed paired Student’s t-test). Statistics source data for j and k are in Supplementary Table 6.

Comment in

References

    1. Wymann MP, Schneiter R. Lipid signalling in disease. Nat Rev Mol Cell Biol. 2008;9:162–176. - PubMed
    1. Mayer IA, Arteaga CL. The PI3K/AKT Pathway as a Target for Cancer Treatment. Annual review of medicine. 2016;67:11–28. - PubMed
    1. Ono Y, et al. Phorbol ester binding to protein kinase C requires a cysteine-rich zinc-finger-like sequence. Proc Natl Acad Sci U S A. 1989;86:4868–4871. - PMC - PubMed
    1. Park WS, et al. Comprehensive identification of PIP3-regulated PH domains from C. elegans to H. sapiens by model prediction and live imaging. Mol Cell. 2008;30:381–392. - PMC - PubMed
    1. Gaullier JM, et al. FYVE fingers bind PtdIns(3)P. Nature. 1998;394:432–433. - PubMed

Publication types

MeSH terms

Substances