. 2017 Mar;19(3):189-201.
doi: 10.1038/ncb3476. Epub 2017 Feb 20.

Cell-matrix signals specify bone endothelial cells during developmental osteogenesis

Affiliations

Cell-matrix signals specify bone endothelial cells during developmental osteogenesis

Urs H Langen et al. Nat Cell Biol. 2017 Mar.

Abstract

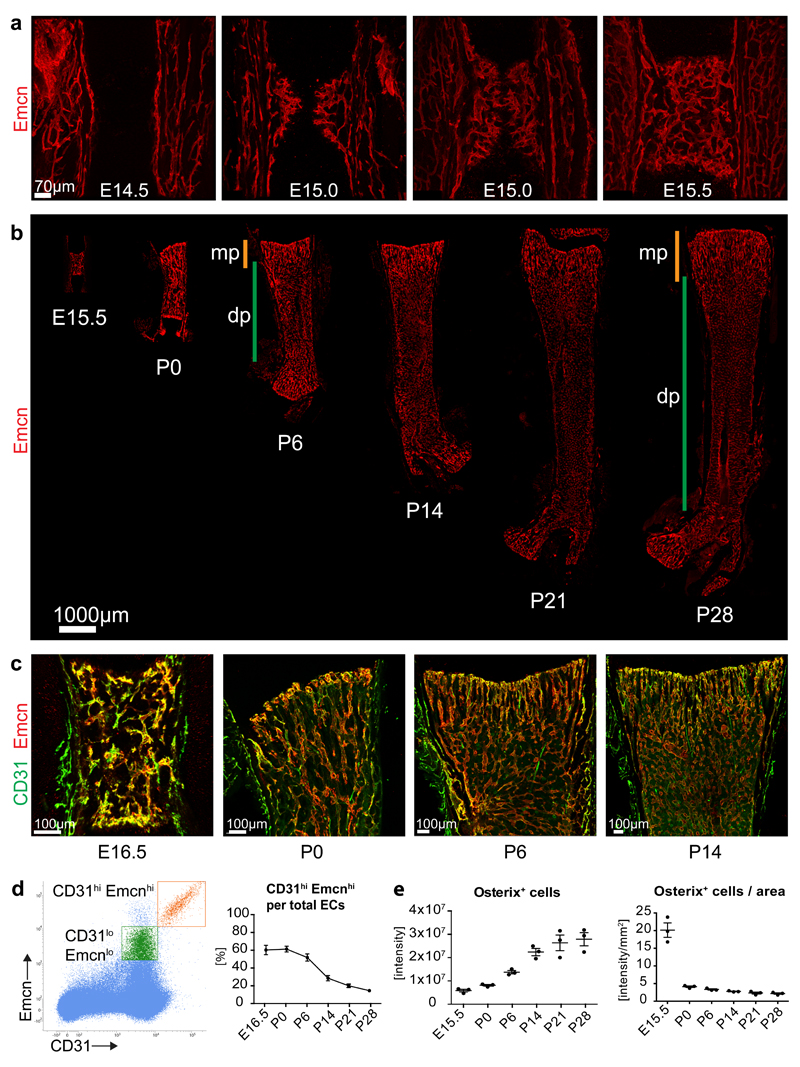
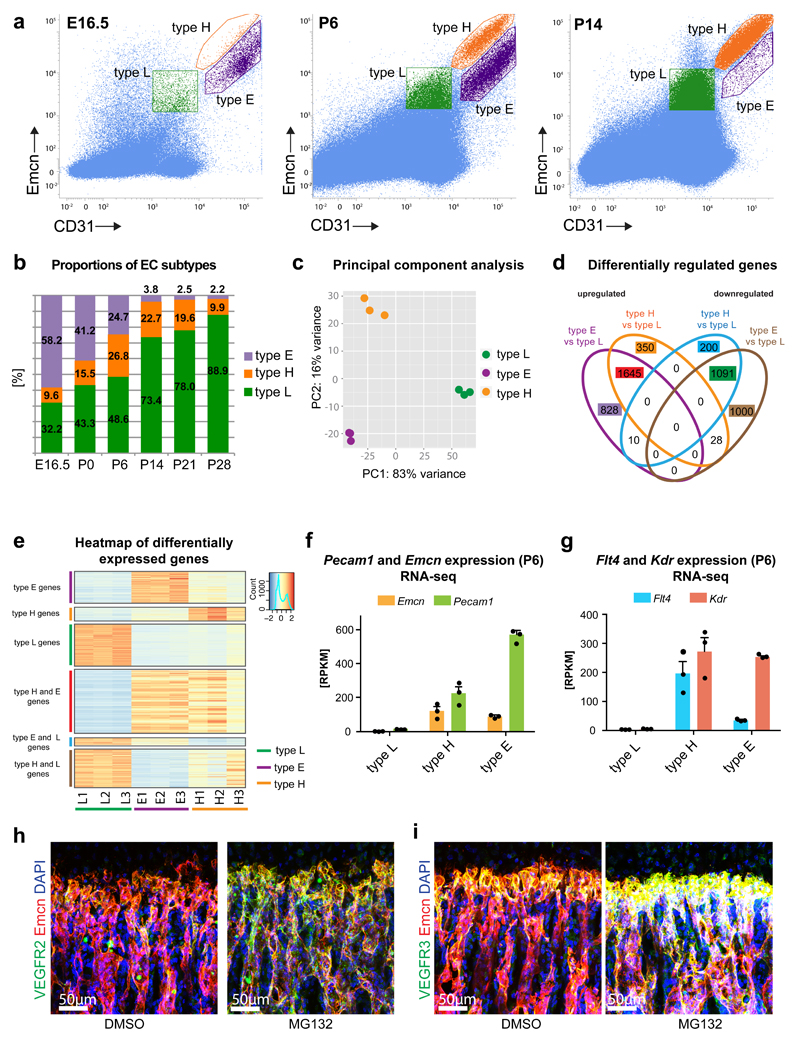
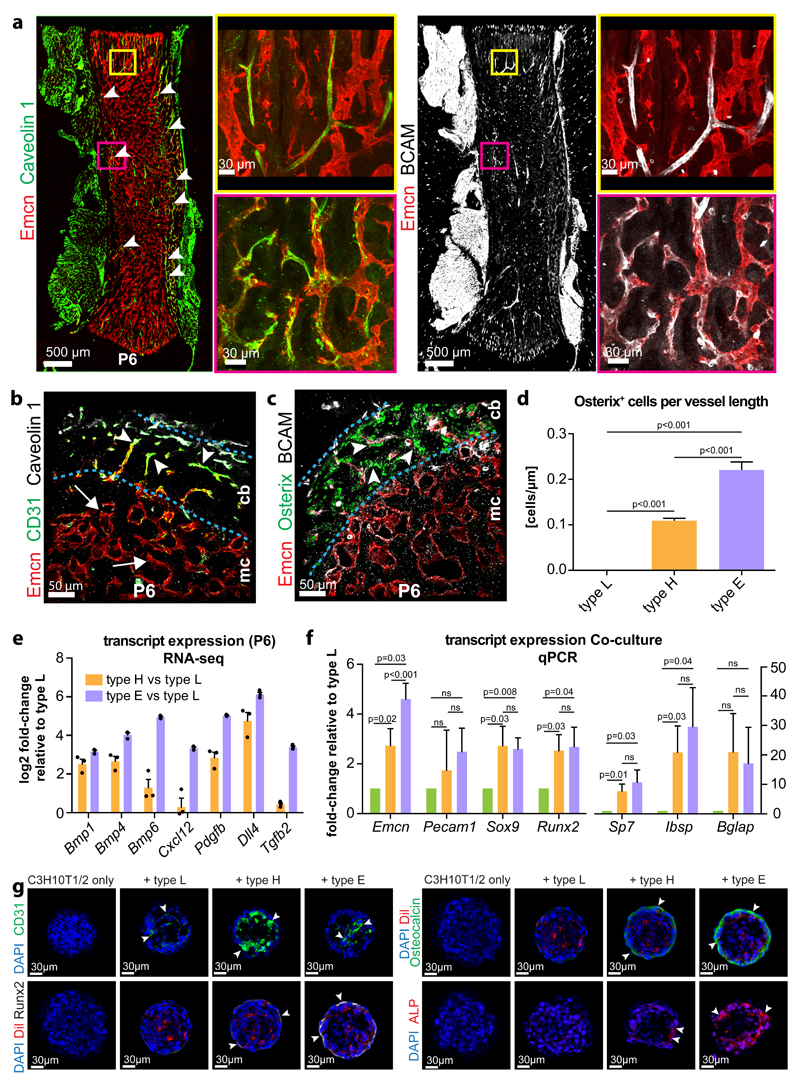
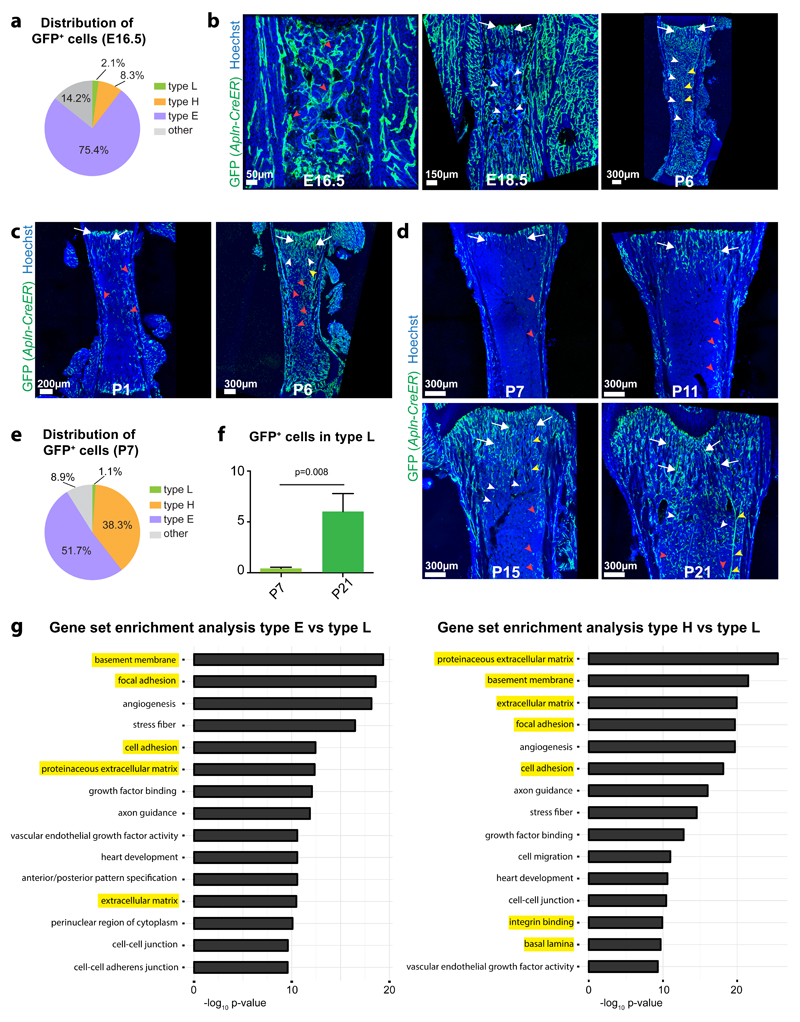
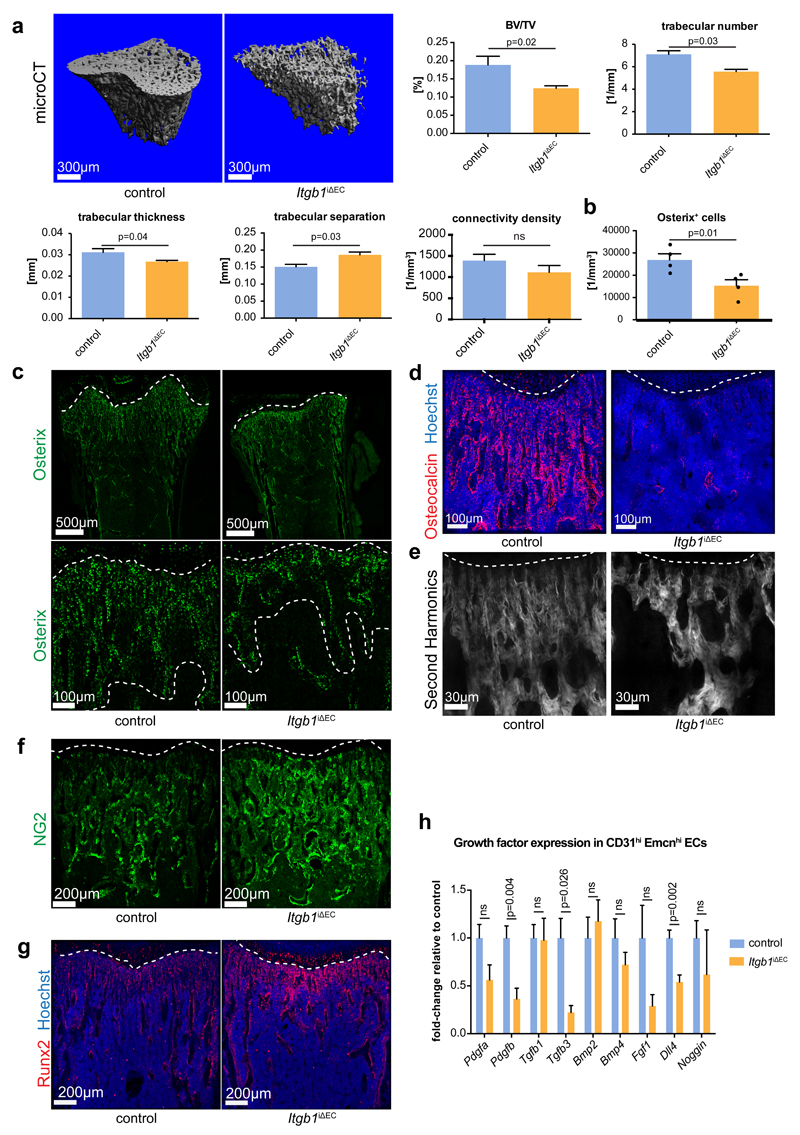
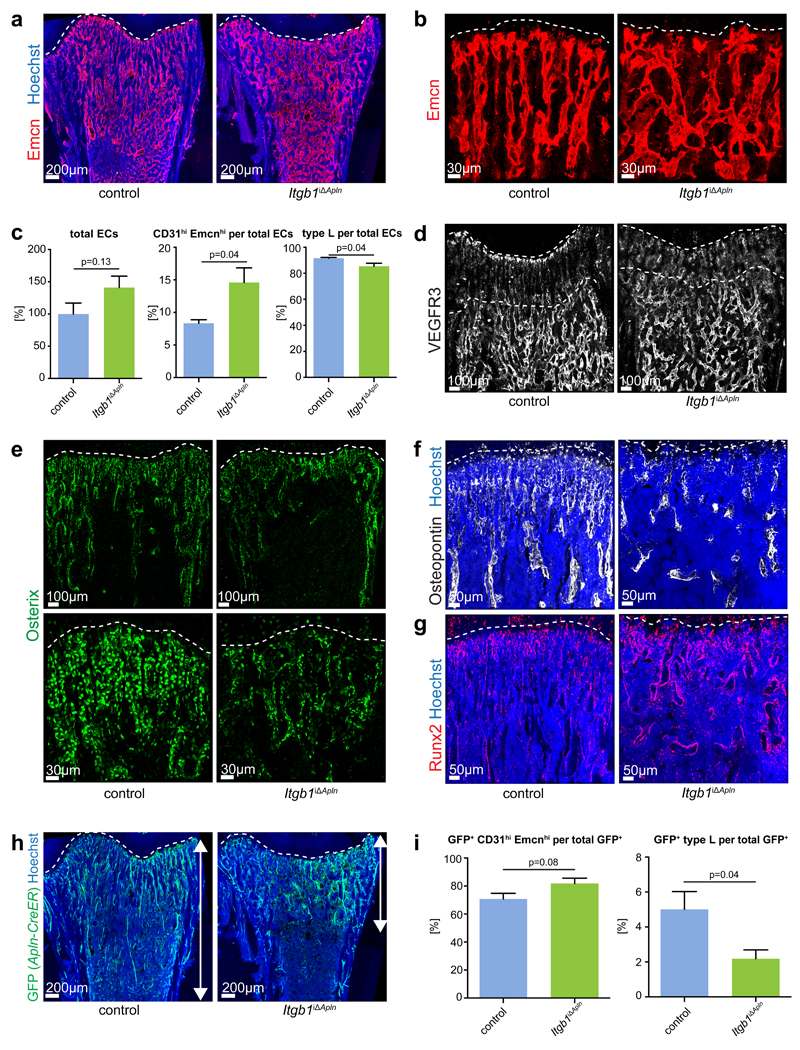
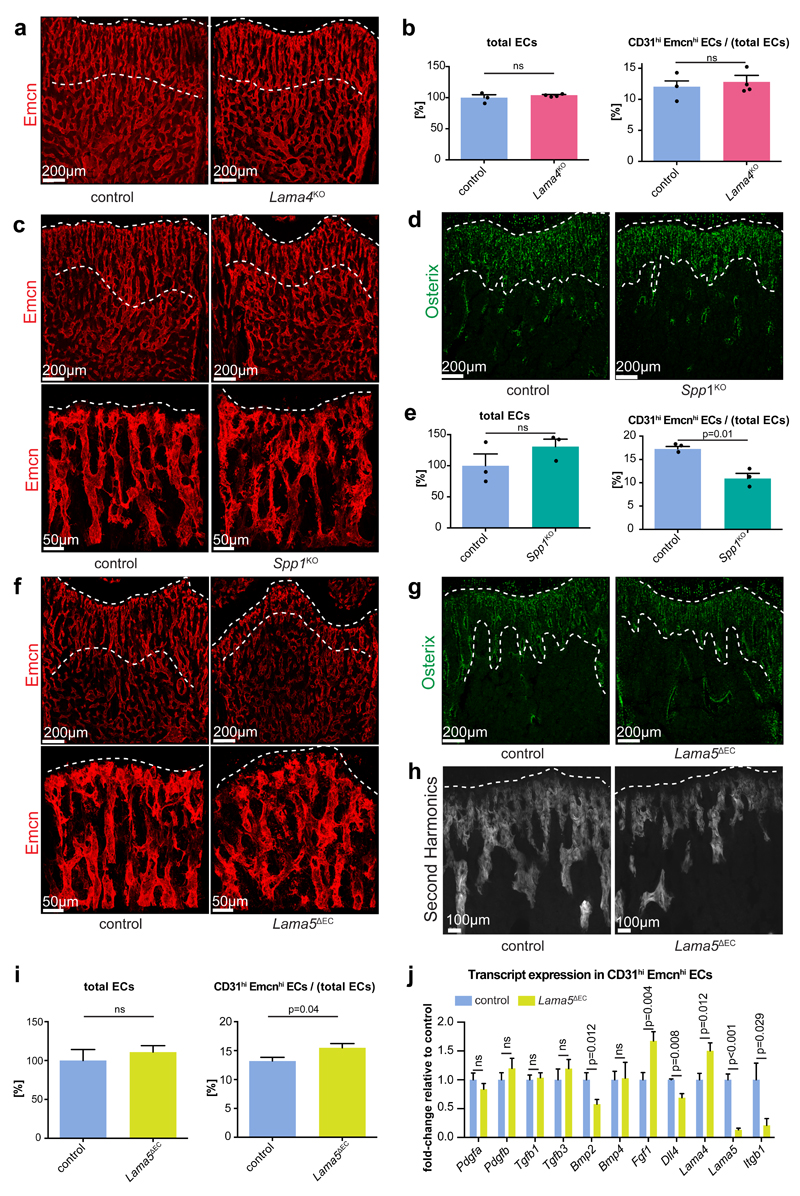
Blood vessels in the mammalian skeletal system control bone formation and support haematopoiesis by generating local niche environments. While a specialized capillary subtype, termed type H, has been recently shown to couple angiogenesis and osteogenesis in adolescent, adult and ageing mice, little is known about the formation of specific endothelial cell populations during early developmental endochondral bone formation. Here, we report that embryonic and early postnatal long bone contains a specialized endothelial cell subtype, termed type E, which strongly supports osteoblast lineage cells and later gives rise to other endothelial cell subpopulations. The differentiation and functional properties of bone endothelial cells require cell-matrix signalling interactions. Loss of endothelial integrin β1 leads to endothelial cell differentiation defects and impaired postnatal bone growth, which is, in part, phenocopied by endothelial cell-specific laminin α5 mutants. Our work outlines fundamental principles of vessel formation and endothelial cell differentiation in the developing skeletal system.


Conflict of interest statement

Author Information

The authors declare that they have no competing financial interests.

Figures

Figure 1
Figure 1. Developmental angiogenesis and EC subtypes in long bone.
a, Maximum intensity projections of confocal images showing Emcn-stained (red) ECs in E14.5, E15.0 and E15.5 femur. Note invading EC sprouts at E15.0 and establishment of a plexus at E15.5. b, Confocal tile scans of Emcn-immunostained (red) E15.5, P0, P6, P14, P21 and P28 femur. Orange bars mark metaphysis (mp), green bars indicate diaphysis (dp). c, Confocal images of CD31 (green) and Emcn (red) immunostained wild-type femur at the indicated stages. Note strong CD31 signal in ECs near postnatal growth plate and throughout the E16.5 vessel plexus. d, Representative flow cytometry dot plot showing CD31hi Emcnhi (orange) and CD31lo Emcnlo ECs (green) in total bone marrow cells at P21. Gate settings exclude cells with very low Emcn expression (namely CD31+ hematopoietic cells and arterial ECs) from the analysis. Panel on the right shows the ratio of CD31hi Emcnhi among total (sum of CD31hi Emcnhi and CD31lo Emcnlo) ECs at the indicated developmental stages. Data represents mean± s.e.m. (n=3 individual experiments). e, Quantitation of Osterix immunostaining signal intensity (artificial units) within the primary ossification centre, as measured in confocal tile scan images at given developmental stages (left). Graph on the right shows Osterix signal normalised to area of the primary ossification centre. Data represents mean± s.e.m. (n=3 individual mice per stage). Statistics source data are shown in Supplementary Table 6.
Figure 2
Figure 2. Identification of a distinct EC subpopulation in early bone development.
a, Representative flow cytometry dot plots showing EC subsets with distinct expression of CD31 and Emcn in E16.5, P6 and P14 bone marrow. Gates indicating type L (green), type H (orange) and type E (purple) ECs are marked. b, Bar chart showing proportions of EC subpopulations at different developmental stages. c, Principal component analysis of RNA-sequencing data using the top 500 most variable genes across the samples. The first principal component (PC1) explained 83% of all variance; the second principal component (PC2) showed 16% of the variance between samples. d, Venn diagram displaying the overlap of the significantly upregulated and downregulated genes between different EC populations in wild-type long bone at P6 identified by RNA-seq. FDR-adjusted p-value < 0.01 and absolute log2 fold change > 1. e, Heat map illustration of gene expression values for differentially expressed genes in bone-derived type E, type H and type L ECs at P6. Each heat map displays data for the different sets of upregulated (red) and downregulated genes (blue) in Fig 2d. The data represented correspond to the normalized read counts scaled by row. Columns display data for each of the three replicates per cell subtype. f, Expression of endothelial markers Pecam1 and Emcn in RNA sequencing samples. RPKM, reads per kilobase per million mapped reads. Data represents mean± s.e.m. (n=3 independent experiments). g, RNA-seq-based relative expression levels of Kdr/Vegfr2 and Flt4/Vegfr3 transcripts in endothelial subpopulations at P6. Data represents mean± s.e.m. (n=3 independent experiments). Statistics source data are shown in Supplementary Table 6. h, i, Immunostaining for VEGFR2 or VEGFR3 (green) and Emcn (red) in sections of P21 wild-type femur after treatment with vehicle control (DMSO) or proteasome inhibitor (MG132) for 3 hours. MG132 strongly increased VEGF receptor levels in type H vessel columns. Nuclei, DAPI (blue).
Figure 3
Figure 3. Characterization of EC subpopulations in developing long bone.
a, Immunostaining for Emcn (red) and the type E markers Caveolin 1 (green) and BCAM (white) in P6 femur. Panels on the right show higher magnification of corresponding insets. b, c, Transverse sections through P6 femur showing CD31 (green) and Caveolin 1-positive (white) vessels in compact bone (cb) (arrowheads) (b). By contrast, the bone marrow cavity (mc) contains Emcn-positive vessels with low CD31 signal (arrow). BCAM-positive vessels (white) in compact bone were associated with Osterix-expressing osteoprogenitors (green) (c). d, Quantitation of Osterix positive cells in proximity to type L vessels in the marrow cavity, metaphyseal type H vessels and to type E vessels in compact bone normalized to vessel length. Data represents mean± s.e.m. (n=6 mice), (p<0.001 between all compared groups, two-tailed unpaired t-test). e, RNA-seq-based expression levels of the indicated transcripts relative to expression in type L in freshly isolated P6 EC subpopulations. Data based on RPKM values obtained from RNA-seq. Data represents mean± s.e.m. (n=3 independent experiments). Statistics source data are shown in Supplementary Table 6. f, Transcript expression in EC-C3H10T1/2 spheroid co-cultures (at day 7). Transcripts encoding Sox9, Runx2, Osteopontin (Sp7), integrin binding sialoprotein (Ibsp), and Osteocalcin (Bglap) were upregulated in cultures containing primary type H or type E ECs. Data represents mean± s.e.m. (n=7 independent experiments), two-tailed unpaired t-test. g, Immunostaining of EC-C3H10T1/2 spheroids after 7 days in culture. Signals for Runx2 (white), Osteocalcin (green) and Alkaline phosphatase (red) were upregulated by CD31hi (green) type H and type E ECs (arrowheads) but not in the presence of type L ECs. Nuclei, DAPI (blue). ECs were pre-labeled by DiI (red) at the onset of the experiments.
Figure 4
Figure 4. Hierarchy und molecular properties of bone capillary ECs.
a, e, Pie charts of the flow cytometry analysis of GFP+ cells in E16.5 (a) or P7 (e) long bone of Apln-CreER R26-mT/mG mice at 24 hours after 4-OHT administration. Note that the majority of labelled cells are type E ECs and only few GFP+ cells are type L ECs (n=5 mice for E16.5 and n=7 mice for P7). b, c, d, Maximum intensity projections of tile scan confocal images showing GFP signal (green) in Apln-CreER R26-mT/mG femur at the indicated developmental stages after 4-OHT administration at E15.5 (b), P0 (c) or P6 (d). Nuclei, Hoechst (blue). GFP signal marks type E (red arrowheads) and a subset of type H ECs (arrows) one day after CreERT2 activation, whereas GFP+ ECs were seen in all capillary subpopulations (including type L, white arrowheads) and arteries (yellow arrowheads) at the respective later stages. f, Flow cytometry analysis of GFP+ type L ECs in Apln-CreER R26-mT/mG mice at P7 and P21 after 4-OHT induction at P6. Note significant increase of labelled type L ECs. Data represents mean± s.e.m. (n=7 mice for P7 and n=8 mice for P21), (p=0.008, two-tailed unpaired t-test). g, Gene set enrichment analysis for significantly differentially regulated genes in type E or type H ECs relative to type L ECs.
Figure 5
Figure 5. Altered bone vasculature in EC-specific Itgb1 mutant mice.
a, Confocal images of 3 week-old Itgb1iΔEC and littermate control femurs stained for Emcn (red). Nuclei, Hoechst (blue). b, High magnification images showing Emcn-immunostained vessel columns (marked by dashed lines) in the Itgb1iΔEC and control femoral metaphysis. c, Number of branch points in Emcn-stained metaphyseal vessels. Data was normalized relative to 100% in control littermates and represents mean± s.e.m. (n=5 individual femurs per group), (p=0.02, two-tailed unpaired t-test). d, Quantitation length of vessel area with low VEGFR3 immunostaining relative to total vessel area in Itgb1iΔEC and control femoral metapyhsis. Data represents mean± s.e.m. (n=3 individual femurs per group), (p=0.04, two-tailed unpaired t-test). Statistics source data are shown in Supplementary Table 6. e, Confocal images of VEGFR3 (white) immunostaining in Itgb1iΔEC and control femoral sections. Dashed lines indicate upper and lower border of metaphysis. f, g, Charts showing the flow cytometry analysis of total ECs (f) and proliferating (EdU+) cells per total ECs (g) number in P21 Itgb1iΔEC and Cre- littermate controls. Data in (f) was normalized relative to 100% in control littermates and represents mean± s.e.m. (n=16 mice), (p=0.03, two-tailed unpaired t-test). Data in (g) represents mean± s.e.m. (n=7 independent samples), (p=0.01, two-tailed unpaired t-test). h, Flow cytometry analysis of CD31hi Emcnhi cells expressed as percent of total bone ECs. Data represents mean± s.e.m. (n=16 mice per group), (p=0.0004, two-tailed unpaired t-test). i, Tile scan confocal overview pictures (top row) and magnified details of CD31-immunostained metaphyseal and diaphyseal vessels in 3 week-old Itgb1iΔEC and Cre-control femur. Note strong CD31 staining of Itgb1iΔEC diaphyseal vessels relative to control (arrowheads). j, Flow cytometry analysis for EdU+ cells among total CD31hi Emcnhi ECs. Data represents mean± s.e.m. (n=7 mice per group), (p=0.003, two-tailed unpaired t-test). k, Representative flow cytometry analyses of Itgb1iΔEC mice and littermate control bone marrow cells stained for Endomucin and CD31. Gates indicating type L (green), type H (orange) and type E (purple) ECs. Charts show quantification of type E ECs per total ECs in P21 Itgb1iΔEC relative to control bone. Data represents mean± s.e.m. (n=11 mice per group), (two-tailed unpaired t-test).
Figure 6
Figure 6. Bone defects in EC-specific Itgb1 mutant mice.
a, Representative 3D reconstruction from µCT measurements of tibial metaphysis of 3 week-old Itgb1iΔEC and littermate control mice. Diagrams represent bone parameters measured in µCT analyses: bone volume/total volume (BV/TV) in percentage, trabeculae number in 1 per millimeter, trabecular thickness in millimeters, trabecular separation in millimeters, and connectivity density in 1 per cubic millimeter. Data represent mean± s.e.m. (n=6 mice), (p-values determined by two-tailed unpaired t-test). b, Quantitation of metaphyseal Osx+ cells in Itgb1iΔEC mutant and Cre-negative littermate bone sections. Data represents mean± s.e.m. (n=4 individual femurs), (p=0.01, two-tailed unpaired t-test). Statistics source data are shown in Supplementary Table 6. c, Tile scan and high magnification confocal images of Itgb1iΔEC and littermate control femurs stained for Osterix (green). Dashed lines indicate borders of metaphysis to growth plate and marrow cavity, respectively. d, Itgb1iΔEC and littermate control femurs stained for Osteocalcin (red) and counterstained with Hoechst (blue). e, High magnification of 2-photon second harmonic generation signals (white) of sections of P21 Itgb1iΔEC and control femurs. Dashed line indicates adjacent growth plate (top). f, g, Maximum intensity projection of femoral sections from Itgb1iΔEC mutants and littermate controls stained for NG2 (f, green) or Runx2 (g, red). Nuclei in (g), Hoechst (blue). h, RT-qPCR analysis of growth factor transcripts in freshly sorted Itgb1iΔEC CD31hi Emcnhi (orange) and control ECs (blue). Data represents mean± s.e.m. (n=9 mice per group), (p-values, two-tailed unpaired t-test). ns, not significant.
Figure 7
Figure 7. Defects in Apln-CreER-generated Itgb1 mutants.
a, Confocal images of 3 week-old Itgb1iΔApln and littermate control femurs stained for Emcn (red). Nuclei, Hoechst (blue). Dashed line marks growth plate. b, High magnification images showing Emcn-immunostained Itgb1iΔApln and control femoral metaphyseal vessels. Dashed line marks growth plate. c, Charts of flow cytometry analysis of total ECs relative to 100% in control littermates, CD31hi Emcnhi cells per total ECs and type L cells per total ECs in P21 Itgb1iΔApln and Cre- littermate controls. Data represent mean± s.e.m. (n=6 mice per group), (p=0.13 for total ECs, p=0.04 for CD31hi Emcnhi cells and p=0.04 for type L ECs, two-tailed unpaired t-test). d, Confocal images of VEGFR3 (white) immunostaining in Itgb1iΔApln and control femoral sections. Dashed lines indicate upper and lower border of metaphysis. e, Overview and high magnification confocal images of Itgb1iΔApln and littermate control femurs stained for Osterix (green). Dashed lines indicate growth plate. f, g, Confocal images of P21 Itgb1iΔApln and control femoral sections stained for Osteopontin (f, white) and Runx2 (g, red). Nuclei, Hoechst (blue). Dashed line marks growth plate. h, Maximum intensity projections of tile scan confocal images showing Apln-CreER R26-mT/mG-generated GFP signal (green) in Itgb1iΔApln and littermate control femurs. i, Bar charts showing ratio of CD31hi Emcnhi ECs and type L ECs in total GFP+ (Apln-CreER R26-mT/mG) cells in Itgb1Apln+ littermate control bone (n=6 mice per group), (p=0.08 for CD31hi Emcnhi ECs and p=0.04 for type L ECs, two-tailed unpaired t-test).
Figure 8
Figure 8. Phenotypes of extracellular matrix mutants.
a, c, f, Overview and high magnification confocal images of Emcn-immunostained (red) femoral sections of 3 week-old Lama4KO (a), Spp1KO (c) and Lama5ΔEC (f) mice and respective controls, as indicated. Dashed lines indicate upper/lower border of column-like vessels in proximity of the growth plate (top). b, e, i, Flow cytometry quantitation of total and fraction of CD31hi Emcnhi ECs in 3 week-old mutant and control bone. Data for total ECs was normalized to 100% (control) and represents mean± s.e.m. (b, n=4, p=0.49 for Lama4KO; e, n=3, p=0.25 for Spp1KO; i, n=7, p=0.72 for Lama5ΔEC mice). CD31hi Emcnhi data represent mean± s.e.m. (n=4, p=0.60 for Lama4KO; n=3, p=0.01 for Spp1KO; n=7, p=0.04 for Lama5ΔEC mice; two-tailed unpaired t-test; n represents number of mice per group). Statistics source data are shown in Supplementary Table 6. d, g, Osterix (green) stained sections of Spp1KO (d) or Lama5ΔEC (g) femur and littermate controls. Dashed lines indicate upper and lower borders of trabecular region. h, High magnification of 2-photon second harmonic generation signals (white) of thick sections (100µm) of P21 Lama5ΔEC and control femurs. Dashed line indicates adjacent growth plate. j, RT-qPCR analysis of growth factor transcripts in freshly sorted Lama5ΔEC CD31hi Emcnhi (green) and control ECs (blue). Data represents mean± s.e.m. (n=10 mice per group), (p-values, two-tailed unpaired t-test). ns, not significant.

Similar articles

Cited by

References

    1. Kronenberg HM. Developmental regulation of the growth plate. Nature. 2003;423:332–336. - PubMed
    1. Long F, Ornitz DM. Development of the endochondral skeleton. Cold Spring Harb Perspect Biol. 2013;5:a008334. - PMC - PubMed
    1. Eshkar-Oren I, et al. The forming limb skeleton serves as a signaling center for limb vasculature patterning via regulation of Vegf. Development. 2009;136:1263–1272. - PubMed
    1. Conen KL, Nishimori S, Provot S, Kronenberg HM. The transcriptional cofactor Lbh regulates angiogenesis and endochondral bone formation during fetal bone development. Dev Biol. 2009;333:348–358. - PMC - PubMed
    1. Maes C, et al. Impaired angiogenesis and endochondral bone formation in mice lacking the vascular endothelial growth factor isoforms VEGF164 and VEGF188. Mech Dev. 2002;111:61–73. - PubMed

Publication types

MeSH terms