. 2017 Apr;23(4):429-438.
doi: 10.1038/nm.4287. Epub 2017 Feb 20.

Transgenic expression of human APOL1 risk variants in podocytes induces kidney disease in mice

Affiliations

Transgenic expression of human APOL1 risk variants in podocytes induces kidney disease in mice

Pazit Beckerman et al. Nat Med. 2017 Apr.

Abstract

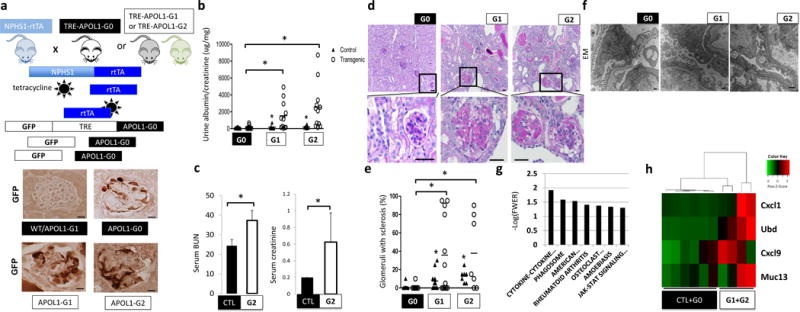
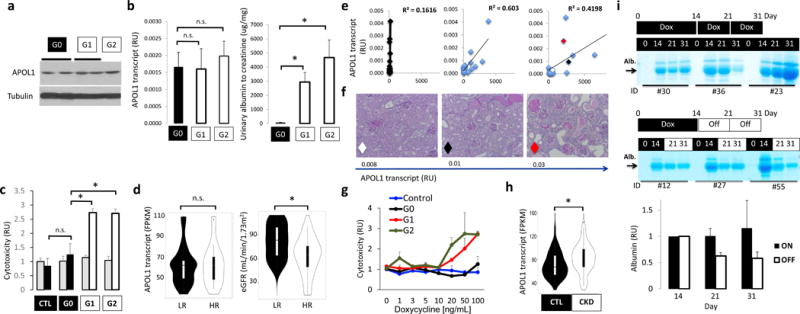
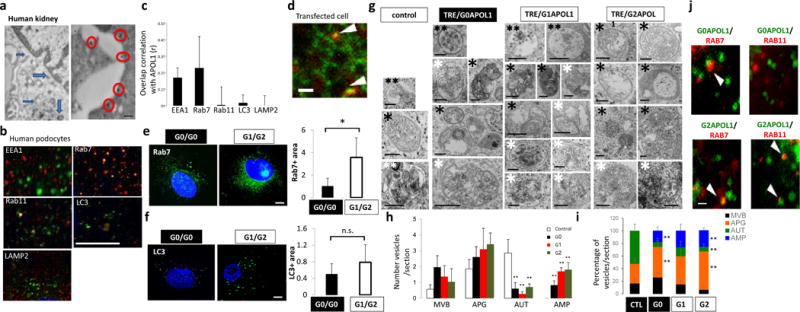
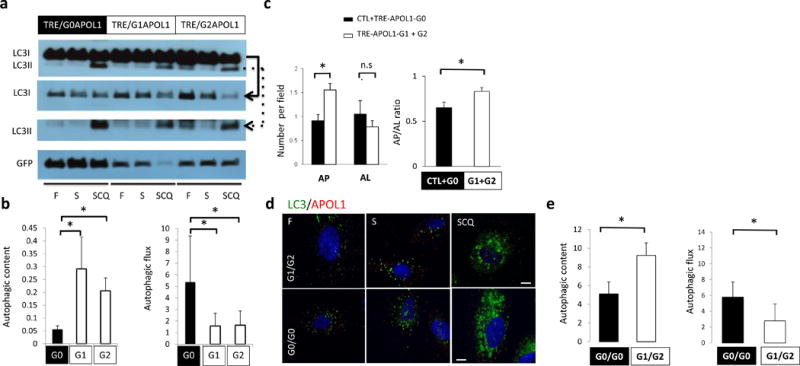
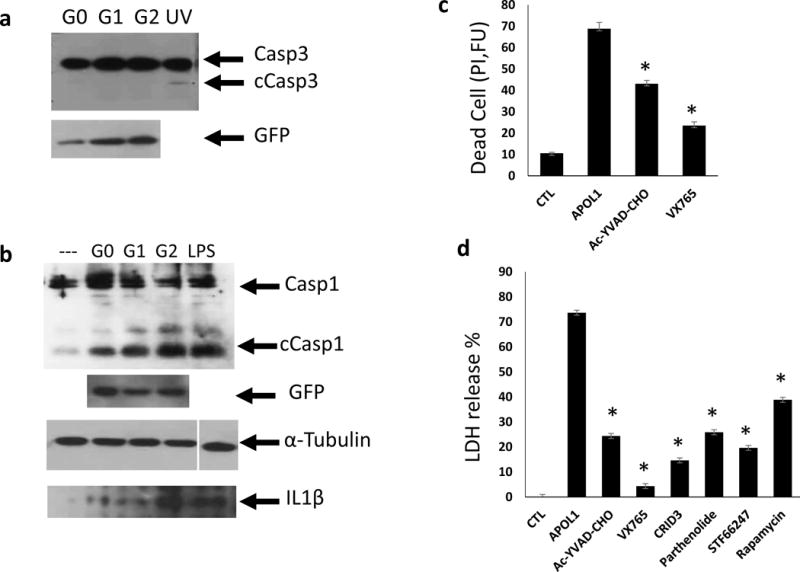
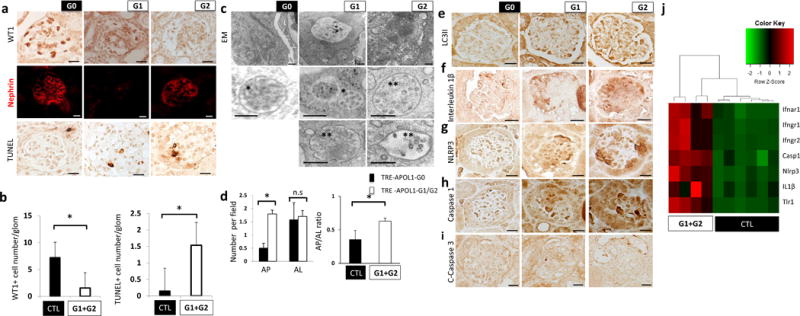
African Americans have a heightened risk of developing chronic and end-stage kidney disease, an association that is largely attributed to two common genetic variants, termed G1 and G2, in the APOL1 gene. Direct evidence demonstrating that these APOL1 risk alleles are pathogenic is still lacking because the APOL1 gene is present in only some primates and humans; thus it has been challenging to demonstrate experimental proof of causality of these risk alleles for renal disease. Here we generated mice with podocyte-specific inducible expression of the APOL1 reference allele (termed G0) or each of the risk-conferring alleles (G1 or G2). We show that mice with podocyte-specific expression of either APOL1 risk allele, but not of the G0 allele, develop functional (albuminuria and azotemia), structural (foot-process effacement and glomerulosclerosis) and molecular (gene-expression) changes that closely resemble human kidney disease. Disease development was cell-type specific and likely reversible, and the severity correlated with the level of expression of the risk allele. We further found that expression of the risk-variant APOL1 alleles interferes with endosomal trafficking and blocks autophagic flux, which ultimately leads to inflammatory-mediated podocyte death and glomerular scarring. In summary, this is the first demonstration that the expression of APOL1 risk alleles is causal for altered podocyte function and glomerular disease in vivo.


Conflict of interest statement

Competing Financial Interests

No competing financial interest

Figures

Figure 1
Figure 1. Generation of a mouse model with cell-type-specific inducible expression of APOL1 variants
(a) Upper: schematic representation of mouse model generation. Lower: representative images of GFP immunostaining. (n = 15 per line) Scale bars, 10μm. (b) Urine albumin/creatinine ratio (ACR) of NPHS1-rtTA/TRE-APOL1-G0 (n = 11), NPHS1-rtTA/TRE-APOL1-G1 (n = 11), NPHS1-rtTA/TRE-APOL1-G2 (n = 12) mice. Single transgenic littermates served as controls (ctl) (n = 8, 6, 6 for G0, G1 and G2, respectively). Statistics was calculated by Student’s t-test, P = 0.0154 (G0 vs. G1), P=0.0077 (G0 vs. G2). (c) Serum blood urea nitrogen (BUN) and creatinine levels of control (CTL) (n = 6) and NPHS1-rtTA/TRE-APOL1-G2 (n = 4) mice on doxycycline diet for 12–19 days. Student’s t-test, P = 0.0042 (BUN), P = 0.0279 (creatinine). The data are presented as means ± s.d. (d) Representative PAS-stained kidney images of NPHS1-rtTA/TRE-APOL1-G0, NPHS1-rtTA/TRE-APOL1-G1 and NPHS1-rtTA/TRE-APOL1-G2 mice. The bottom images are higher magnifications of the boxed regions in the top images. (n > 5 per line) Scale bars: upper panels: 20μm; lower panels: 10μm. (e) Quantification of the histological findings of NPHS1-rtTA/TRE-APOL1-G0 (n = 12), NPHS1-rtTA/TRE-APOL1-G1 (n = 12), NPHS1-rtTA/TRE-APOL1-G2 (n = 7) mice. Student’s t-test, P = 0.0087 (G0 vs. G1), P = 0.0048 (G0 vs. G2). (f) Representative transmission electron micrographs (TEM) of NPHS1-rtTA/TRE-APOL1-G0/G1/G2 mice. (n = 26, 74, 54 for G0, G1, G2 mice, respectively) Scale bar: 500nm. (g) Differentially expressed pathways by RNAsequencing identified using gene set enrichment analysis. Y-axis log (p) of the false discovery rate (FWER: family-wise error rate). (h) Heatmap analysis of mouse orthologs of Ubd, Cxcl9, Cxcl1 and Muc13, previously reported to be differentially expressed in APOL1 high vs. low risk allele nephrotic syndrome subjects. Higher transcript levels are shown in red, while lower in green.
Figure 2
Figure 2. APOL1 risk variant-induced phenotype is cell type- and dose-dependent and likely reversible
(a) Western blot showing APOL1 and tubulin levels in kidneys of NPHS1-rtTA/TRE-APOL1 transgenic mice on doxycycline for 3 (G1 and G2) to 17 (G0) weeks. (b) Left panel: Mice were matched for APOL1 transcript levels in NPHS1-rtTA/TRE-APOL1-G0/G1/G2 transgenic mice Right panel: urine albumin/creatinine ratio (ACR) of NPHS1-rtTA/TRE-APOL1-G0/G1/G2 transgenic mice after doxycycline diet for 3–6 weeks. (n = 5 per group). Data are presented as means ± s.e.m. and Student’s t-test, P = 0.0029 (G0 vs. G1), P = 0.00612 (G0 vs. G2). (c) Cell toxicity (measured by the ratio of dead to viable cells) assay in TRE-GFP/APOL1-G0, G1 or G2 transiently transfected HEK293 cells and normalized to GFP (APOL1) levels. Grey bars represent no doxycycline treated and black (in CTL or G0) or white bars (in G1 or G2) represent doxycycline treated cells. Student’s t-test, P = 0.0031 (G0 vs. G1), P = 0.016 (G0 vs. G2). (d) Violin plots of eGFR (right graph) in a group of low risk (LR) and high-risk (HR) APOL1 genotype patients matched by APOL1 expression level (left graph) (FPKM: fragments per kilobase million) and age, gender and other sequencing parameters (1:3=HR (n = 11): LR (n = 33)). Significance was calculated by conditional logistic regression P = 0.032 (right graph). (e) Correlation between APOL1 transcript levels (by qRT-PCR) and albumin/creatinine ratio for NPHS1-rtTA/TRE-APOL1-G0, G1 or G2 mice. n = 15 per group. The red, white and black diamonds in the graph for the G2 allele represent 3 mice of varying expression of this risk allele and used for analysis in f. (f) Representative PAS-stained kidney images of NPHS1-rtTA/TRE-APOL1-G2 with increasing levels of APOL1 transcript. The diamonds represent the same 3 mice shown in e for the G2 group. (n > 5 per line) (g) APOL1 cell toxicity in TRE-GFP/APOL1-G0, G1 or G2 transiently transfected HEK293 cells treated with different concentrations of doxycycline (increasing APOL1 expression), cell toxicity was normalized to GFP (APOL1) expression. (h) Violin plots of glomerular APOL1 transcript level measured by RNA sequencing on microdissected glomeruli from 286 human kidney samples in control (GFR> 60mL/min/1.73m2) and CKD (GFR<60ml/min/1.73m2) patients. Student’s t-test, P = 0.000283. (i) Coomassie gels of urine samples from mice that were placed on doxycycline food for 14 days and then either kept on doxycycline food (on group) or taken doxycycline diet off (off group). Urine samples were taken from day 0, 14, 21 and 31 following initiation of doxycycline food. Quantifications of albumin gel images are shown at the bottom. Intensity of the albumin of Day 21 and 31 were both normalized to that of day 14 (the time of splitting up the groups). All data are presented as means ± s.d. (unless otherwise indicated).
Figure 3
Figure 3. APOL1 risk allele cells show increased accumulation of intracellular vesicles, mainly late endosomes/autophagosomes
(a) Immunogold electron microscopy (EM) of APOL1 in human kidney podocytes. APOL1 localizes to plasma membrane (red circles) and intracellular vesicles (blue arrows). Scale bar, 200nm. (b) Double immunofluorescence micrographs of cultured human podocytes with APOL1 (red) and intracellular organelle markers (green) (EEA1-early endosome, Rab7-late endosome, Rab11-recycle endosome, LC3-autophagic vacuoles, LAMP2-lysosomes). Scar bar, 11μm. (c) Quantification of colocalization correlation using Pearson r correlation through ImageJ coloc2 function. n = 5 separate experiments, 3–10 cells for each genotype were analyzed. Data are presented as means ± s.e.m. (d) Representative frame from the supplementary video 1 of spinning disk confocal microscopy analysis of GFP-APOL1 (green) and RFP-Rab7 (late endosome) (red) in transfected HEK293 cells. Arrowheads, overlapping puncta of GFP-APOL1 and RFP-Rab7. Scale bar, 5μm. (ef) Representative fluorescence images of confocal microscopy analysis of endogenous. (e) Rab7 and (f) LC3 immunofluorescence stain in cultured low risk genotype (G0/G0) and high risk genotype (G1/G2) human podocytes and quantification showing increased stain in G1/G2 cells. n = 5 separate experiments, 3–10 cells for each genotype were analyzed. Scale bars, 11μm. (g) Representative transmission electron micrographs from control, TRE-APOL1-G0, TRE-APOL1-G1 and TRE-APOL1-G2 transfected HEK293 cells. Examples of autophagy-related compartments include: **(two black asterisks): Late endosomes/MVB (MVB), *(one black asterisk): autophagosomes (APG), ** (two white asterisks): autolysosomes (AUT), * (one white asterisk): amphisomes (AMP). Scale bars, 0.5μm. (h) Quantification showing the number of each type of vesicle per section. n = 7 analyzed sections. Data are presented as means ± s.e.m. and Student’s t-test, P = 0.032, 0.0057, 0.011 for G0, G1, G2 comparing to control (AUT); while P = 0.024,0.00027, 0.00903 for G0, G1, G2 comparing control (AMP). (i) Quantification showing the relative percentage of each compartment. n = 7 analyzed sections. Data are presented as means ± s.e.m. and Student’s t-test, P = 0.0064 (G2 vs. CTL, APG), 0.0068 and 0.0.01005 (G0 and G2, respectively, vs. CTL, AUT), 0.034 and 0.00044 (G0 and G2, respectively, vs. CTL, AMP). (j) Representative frames from the supplementary videos 1 and 2 of spinning disk confocal microscopy analysis of GFP-APOL1-G0 or GFP-APOL1-G2 (green) and RFP-Rab7 or RFP-Rab11 (red) in transfected HEK293 cells. Scale bar, 5 μm. All data are presented as means ± s.d. (unless otherwise indicated).
Figure 4
Figure 4. Risk variants of APOL1 obstruct autophagy flux
(a) Representative Western blot analysis and (b) quantification of LC3 and GFP in TRE-APOL1 transfected HEK293 cells under fed (F), starved (S) and starved+chloroquine treatment (SCQ) conditions. Top panel shows LC3I and LC3II bands on the same gel. Due to high LC3I content in the cells, different exposure times of the individual rows of LCI and LCII (see solid and dashed arrowed lines, respectively, pointing to the lower panels) were utilized for clear and quantifiable visibility of the bands. Data are presented as means ± s.e.m. and Student’s t-test compared to TRE-APOL1-G0 transfected cells. (c) Quantification of autophagosomes (AP) and autophagolysosomes (AL) by transmission EM and their ratio in transfected HEK293 cells. n = 35, 32, 54 and 42 cells for control, G0, G1 and G2 transfected cells were analyzed, respectively. All data are presented as means ± s.e.m. and Student’s t-test, P = 0.0013 (left panel), 0.025 (right panel) compare to non-transfected (CTL) + TRE-APOL1-G0 transfected cells. (d,e) LC3 staining of low risk (G0/G0) and high-risk (compound heterozygous G1/G2) genotype human podocytes under fed (F), starved (S) and starved plus chloroquine (SCQ) conditions (d) and quantification of this data (e). Scale bars, 11μm. n = 3, 9–20 cells were analyzed per condition. Data are presented as means ± s.e.m. and Student’s t-test, P = 0.0462 (left panel), 0.0104 (right panel) compared to low risk genotype (G0/G0) podocytes.
Figure 5
Figure 5. APOL1 risk variants induce inflammatory cell death (pyroptosis) in cells
(a) Representative Western blot analysis of caspase3 (Casp3) and cleaved caspase3 (cCasp3) following transient transfection with TRE-APOL1-G0/G1/G2. UV exposure served as apoptosis positive control. n = 5. (b) Representative Western blot analysis of caspase1 (Casp1) and cleaved caspase1 (cCasp1) following transient transfection of TRE-APOL1-G0/G1/G2. GFP served as an APOL1 expression reference, α-tubulin as loading control and LPS as pyroptosis positive control. Western blot analysis of mature IL1β in medium from the same transfected HeLa cells. (c) Cell toxicity (measured by propidium iodide staining) in stably transfected TRE-GFP/APOL1-G1 HEK293 cells, with (APOL1) or without (CTL) doxycycline and in the presence of the indicated caspase1 inhibitors (concentration see Methods). Experiments were done in triplicates. Data are presented as means ± s.e.m, and Student’s t-test, P = 0.0015 (Ac-YVAD-CHO), 0.00018 (VX765) compared to APOL1. (d) Cell toxicity (measured by LDH release to the medium) in stably transfected TRE-GFP/APOL1-G1 HEK293 cells with (APOL1) or without (CTL) doxycycline and with indicated inhibitors (concentration see Methods). A representative experiment out of three is presented; each experiment was done in triplicates. All data are presented as means ± s.e.m, and Student’s t-test, P < 0.05.
Figure 6
Figure 6. Mice with podocyte specific APOL1 risk allele expression show increased podocyte loss, autophagy block and increased inflammatory cell death
(a) Representative immunohistochemistry images of WT1 (upper), nephrin (middle) and TUNEL staining (lower) in NPHS1-rtTA/TRE-APOL1-G0/G1/G2 mouse kidney sections. (n > 5 per line) Scale bars, 10μm. (b) Left panel: Quantification of stained cells per glomerulus of WT1 (a podocyte marker), in transgenic mice. n = 11 analyzed images per condition. Student’s t-test, P =0.0036 compared to NPHS1-rtTA/TRE-APOL1-G0 mice and single transgenic control mice. Right panel: Quantification of stained cells per glomerulus of TUNEL stain from transgenic mice. n = 12 analyzed images per condition. Student’s t-test, P = 0.0011 compared to NPHS1-rtTA/TRE-APOL1-G0 mice and single transgenic control. (c) Representative transmission EM images of podocytes from transgenic mice showing increased numbers of MVB and autophagosomes. Inserts show multivesicular bodies (*) and amphisome-like structures (**). Scale bars, 500nm. (d) Quantification of autophagosomes (AP) and autolysosomes (AL) in transgenic mice. Note increased ratio of AP to AL in G1 and G2 mice compared to G0 mice. n > 50 analyzed organelles per each condition. Data are presented as means ± s.e.m. and Student’s t-test, P = 8.1816e-07 (left panel), 0.037 (right panel) compared to NPHS1-rtTA/TRE-APOL1-G0 mice. (e) Representative immunohistochemistry images of LC3II from transgenic mice. Note the increased podocyte stain in G1 and G2 mice compared to G0 mice, suggesting increase in autophagic vacuole content. (n > 5 per line) Scale bars, 10μm. (f–h) Representative immunohistochemistry images of IL1β, NLRP3 and caspase1, showing increased stain of pyroptosis proteins in podocytes of G1 and G2 mice, compared to G0 mice. (n > 5 per line) Scale bars, 10 μm. (j) Representative immunohistochemistry images of cleaved caspase3 from transgenic mice. Note lack of detectable stain, indicating apoptosis is not significantly induced in transgenic mice. (n > 5 per line) Scale bars, 10 μm. (i) Differential expression of a set of genes by RNA-seq analysis in kidneys of NPHS1-rtTA/TRE-APOL1-G0/G1/G2 mice. Single transgenic littermates and NPHS1-rtTA/TRE-APOL1-G0 are controls.

Comment in

References

    1. USRDS. US Renal Data System. 2015
    1. Lipworth L, et al. Incidence and predictors of end stage renal disease among low456 income blacks and whites. PloS one. 2012;7:e48407. - PMC - PubMed
    1. Tzur S, et al. Missense mutations in the APOL1 gene are highly associated with end stage kidney disease risk previously attributed to the MYH9 gene. Human genetics. 2010;128:345–350. - PMC - PubMed
    1. Genovese G, et al. Association of trypanolytic ApoL1 variants with kidney disease in African Americans. Science. 2010;329:841–845. - PMC - PubMed
    1. Freedman BI, et al. Differential Effects of MYH9 and APOL1 Risk Variants on FRMD3 Association with Diabetic ESRD in African Americans. PLoS Genet. 2011;7:e1002150. - PMC - PubMed

MeSH terms