. 2017 May:505:23-32.
doi: 10.1016/j.virol.2017.02.008. Epub 2017 Feb 17.

Selective incorporation of vRNP into influenza A virions determined by its specific interaction with M1 protein

Affiliations

Selective incorporation of vRNP into influenza A virions determined by its specific interaction with M1 protein

Chutikarn Chaimayo et al. Virology. 2017 May.

Abstract

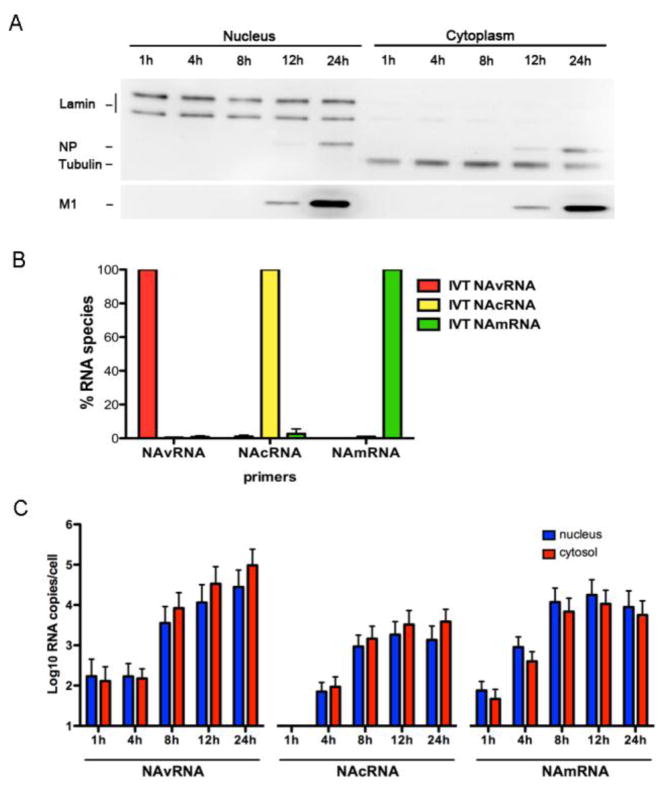
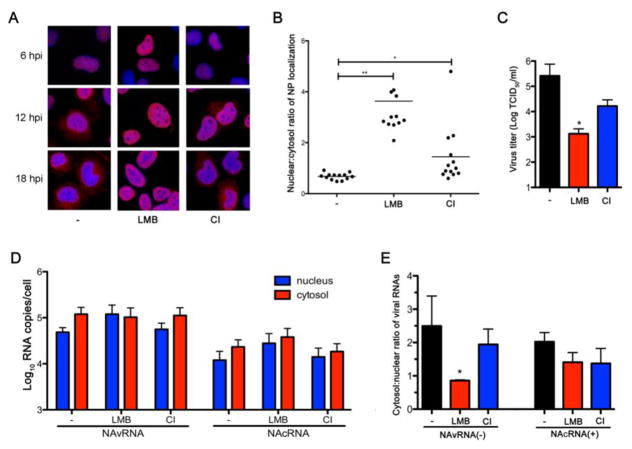
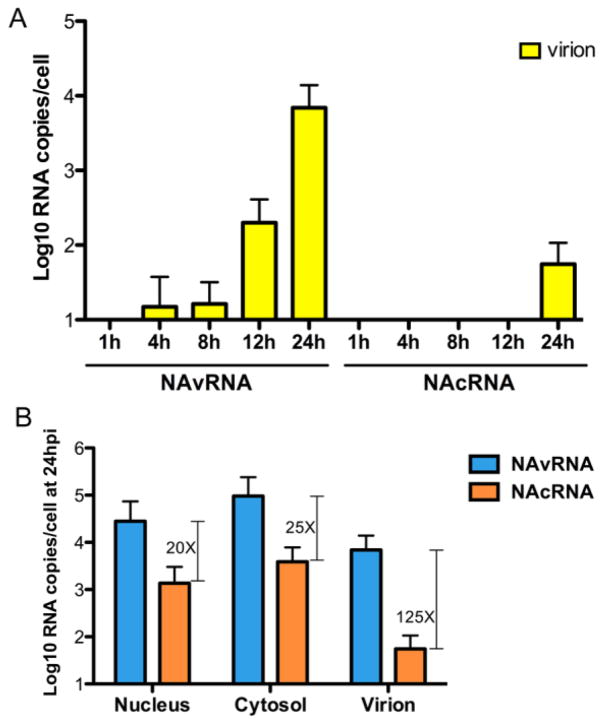
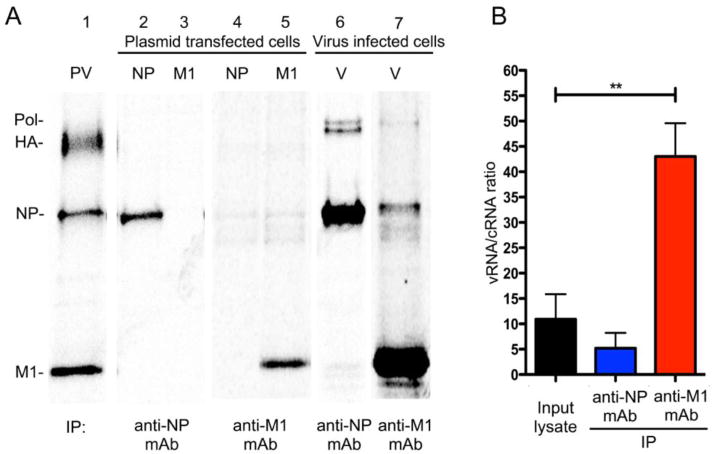
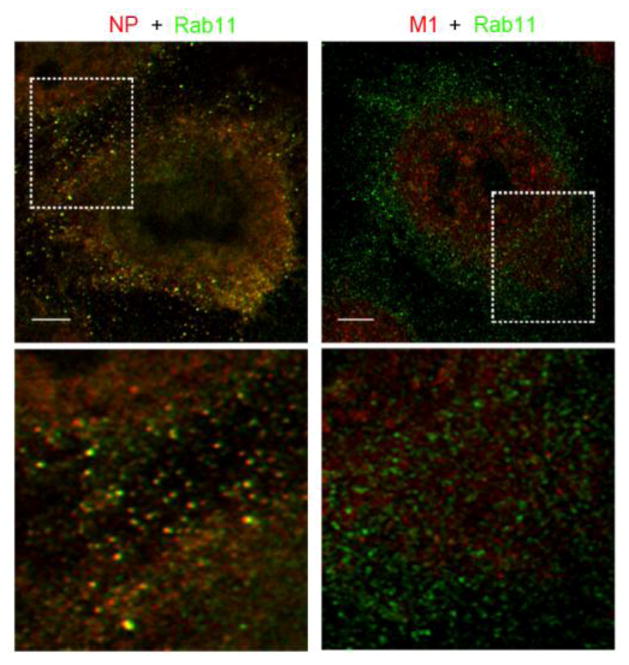
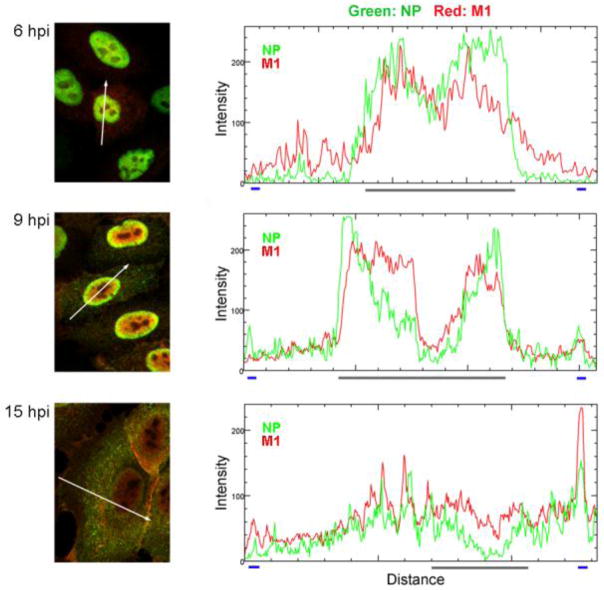
Influenza A viruses contain eight single-stranded, negative-sense RNA segments as viral genomes in the form of viral ribonucleoproteins (vRNPs). During genome replication in the nucleus, positive-sense complementary RNPs (cRNPs) are produced as replicative intermediates, which are not incorporated into progeny virions. To analyze the mechanism of selective vRNP incorporation into progeny virions, we quantified vRNPs and cRNPs in the nuclear and cytosolic fractions of infected cells, using a strand-specific qRT-PCR. Unexpectedly, we found that cRNPs were also exported to the cytoplasm. This export was chromosome region maintenance 1 (CRM1)-independent unlike that of vRNPs. Although both vRNPs and cRNPs were present in the cytosol, viral matrix (M1) protein, a key regulator for viral assembly, preferentially bound vRNPs over cRNPs. These results indicate that influenza A viruses selectively uptake cytosolic vRNPs through a specific interaction with M1 during viral assembly.

Keywords: Assembly; CRM1; CRNP; Influenza; M1; Nuclear export; Trafficking; VRNP.


Figures

Figure 1
Figure 1. Influenza cRNPs are exported from the nucleus
(A) MDCK cells infected with WSN at a MOI of 2 were fractionated at indicated time points after infection. Markers for nucleus (lamin A/C) and cytosol (tubulin), together with viral NP and M1 proteins were detected by Western blotting using specific antibodies. (B) The specificity of qRT-PCR primer sets was determined using WSN NA vRNA (red), cRNA (yellow), and mRNA (green) templates prepared in vitro. The specificity of primers for WSN NAvRNA, NAcRNA, and NAmRNA is presented in respect to the percentage of its corresponding RNA template. (C) MDCK cells infected with WSN were fractionated, and total RNAs were extracted and applied for strand-specific real-time qRT-PCR. Quantities of vRNA, cRNA and mRNA of the NA segment of WSN influenza A virus in the nuclear (blue) and cytosolic (red) fractions are shown as averages with standard deviations from six independent experiments.
Figure 2
Figure 2. Influenza cRNPs are exported from the nucleus via a CRM-1 independent pathway
(A) MDCK cells were infected with WSN at a MOI of 2 for 1 h and cultured in the presence or absence of either 20 nM LMB or 40 μM CI. Cells were fixed and permeabilized at 6, 12, and 18 hpi and processed for IFA using mouse anti-NP mAb and Alexa Flour 594 anti-mouse antibody, and counterstained with DAPI. (B) Intracellular NP signal was quantified from fluorescence intensity at the Alexa Flour 594 channel within the nucleus and the cytoplasm using ImageJ software. Data from cells processed at 18 hpi are represented as the nuclear/cytosol ratio of NP localization (n = 13, mean ± s.d. * P < 0.05, ** P < 0.001). (C) Infected MDCK cells were treated with inhibitors as described in A. Culture supernatant was collected at 18 hpi to perform TCID50 assay for virus titer calculation (n = 3 independent experiments, mean ± s.d. * P <0.05). (D) Infected MDCK cells were treated with inhibitors as described in A. At 18 hpi, cells were fractionated and total RNA from each fraction was extracted and used for the strand-specific real-time qRT-PCR. Quantities of vRNA and cRNA of the NA segment in the nuclear (blue) and cytosolic (red) fractions are shown as averages with standard deviations from three independent experiments. (E) Results obtained from D are represented as the nuclear/cytosol ratio of viral RNAs (n = 3 independent experiments, mean ± s.d. * P < 0.05).
Figure 3
Figure 3. Selective incorporation of vRNPs into the virion
(A) MDCK cells were infected as described in Fig. 1C. Virions in the culture supernatant were purified by ultracentrifugation through a 20% sucrose cushion. Extracted viral RNAs were used for strand-specific real-time qRT-PCR. Data are shown as averages with standard deviations from six independent experiments. (B) Quantities of vRNA (light blue) and cRNA (orange) in each fraction of the cells and in released virions at 24 hpi are shown as averages with standard deviations from six independent experiments. Capped lines represent the fold difference of vRNA over cRNA.
Figure 4
Figure 4. Influenza M1 protein preferentially interacts with vRNPs over cRNPs
(A) 293T cells transfected with NP or M1 expressing plasmids or infected with WSN (V) at a MOI of 3 were radiolabeled for 16 h and used for immunoprecipitation with either anti-NP or anti-M1 mAb. Purified virion (PV) was used as a size marker for viral proteins. (B) Cells infected with WSN at a MOI of 3 were cultured for 14 h at 37°C, and cell lysates were used for immunoprecipitation with anti-NP mAb or anti-M1 mAb. Total RNAs in immunoprecipitated materials and the input lysate were isolated and used for qRT-PCR reaction using the NA gene strand-specific primers to quantify vRNAs and cRNAs. Results are shown as averages with standard deviations of vRNA/cRNA ratios (n = 4 independent experiments, mean ± s.d. ** P < 0.001).
Figure 5
Figure 5. Co-localization of Rab11 with cytoplasmic NP and M1
Cells infected with WSN for 15 h were processed for IFA with dual staining of NP or M1 (red) with Rab11 (green). Images were obtained using super resolution microscopy with a 100x oil immersion objective. Areas within the white boxes are magnified and shown in the lower panels. Scale bars are 4 μm.
Figure 6
Figure 6. Co-localization of NP and M1 at various times after infection
Infected cells were fixed and permeabilized at indicated times after infection and processed for IFA with anti-NP (green channel) and anti-M1 (red channel) mAbs. Images were obtained using an Olympus FV1000 confocal microscope with a 60× oil immersion objective. Histograms indicate the fluorescence intensities of NP and M1 in the area represented by the white arrow in the image. The X-axis demonstrates the arbitrary unit of distance of the marked white arrow. The blue lines indicate the plasma membrane margin, and the grey line indicates the nuclear margin.

References

    1. Akarsu H, Burmeister WP, Petosa C, Petit I, Müller CW, Ruigrok RWH, Baudin F. Crystal structure of the M1 protein-binding domain of the influenza A virus nuclear export protein (NEP/NS2).\ EMBO J. 2003;22:4646–4655. - PMC - PubMed
    1. Ali A, Avalos RT, Ponimaskin E, Nayak DP. Influenza virus assembly: effect of influenza virus glycoproteins on the membrane association of M1 protein.\ J Virol. 2000;74:8709–8719. - PMC - PubMed
    1. Amorim MJ, Bruce EA, Read EKC, Foeglein A, Mahen R, Stuart AD, Digard P. A Rab11- and microtubule-dependent mechanism for cytoplasmic transport of influenza A virus viral RNA.\ J Virol. 2011;85:4143–4156. - PMC - PubMed
    1. Arranz R, Coloma R, Chichón FJ, Conesa JJ, Carrascosa JL, Valpuesta JM, Ortín J, Martín-Benito J. The structure of native influenza virion ribonucleoproteins. Science. 2012;338:1634–1637. - PubMed
    1. Baudin F, Petit I, Weissenhorn W, Ruigrok RW. In vitro dissection of the membrane and RNP binding activities of influenza virus M1 protein. Virology. 2001;281:102–108. - PubMed

Publication types

MeSH terms

LinkOut - more resources