. 2017 Feb 20;18(1):34.
doi: 10.1186/s13059-017-1153-y.

The genome landscape of indigenous African cattle

Affiliations

The genome landscape of indigenous African cattle

Jaemin Kim et al. Genome Biol. .

Abstract

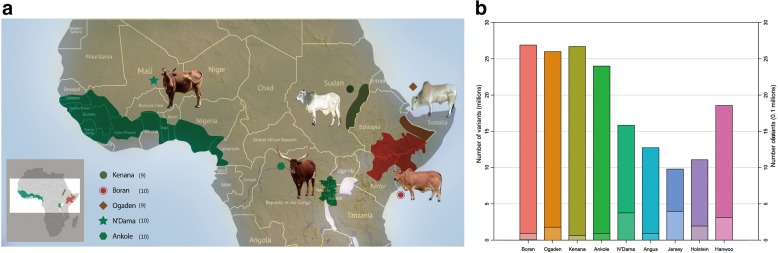
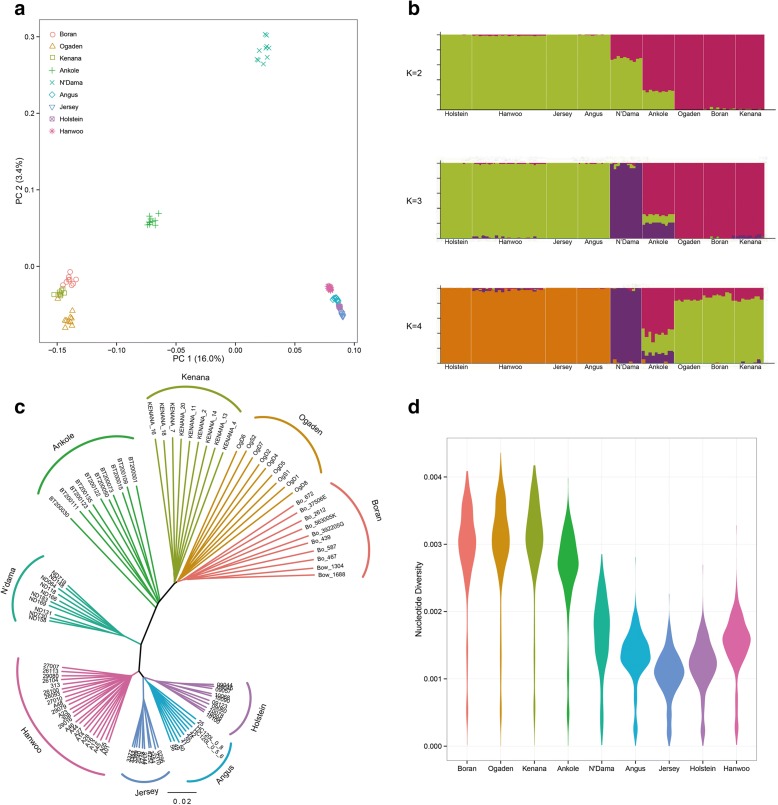
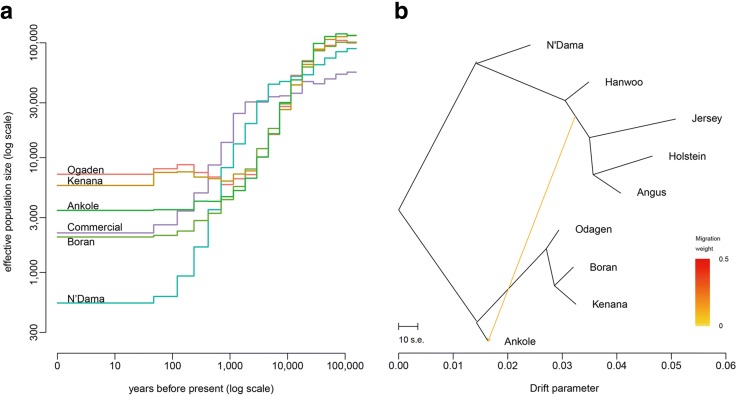
Background: The history of African indigenous cattle and their adaptation to environmental and human selection pressure is at the root of their remarkable diversity. Characterization of this diversity is an essential step towards understanding the genomic basis of productivity and adaptation to survival under African farming systems.

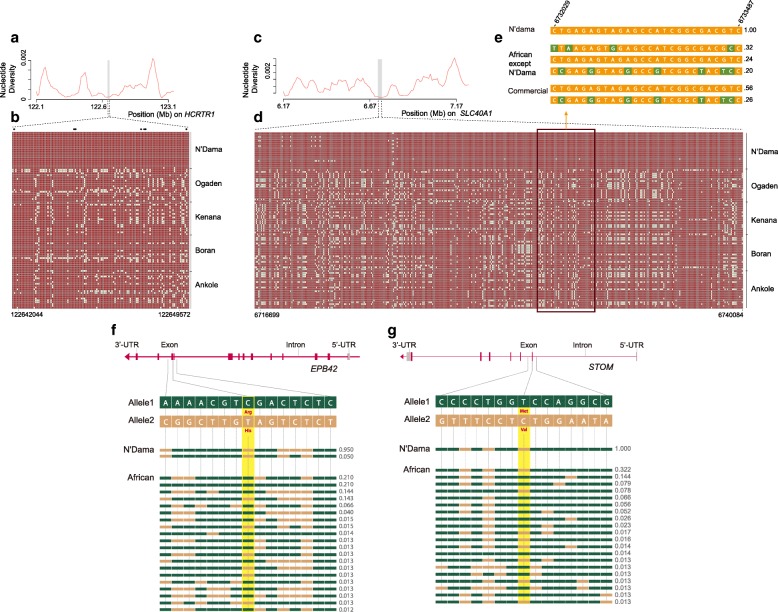
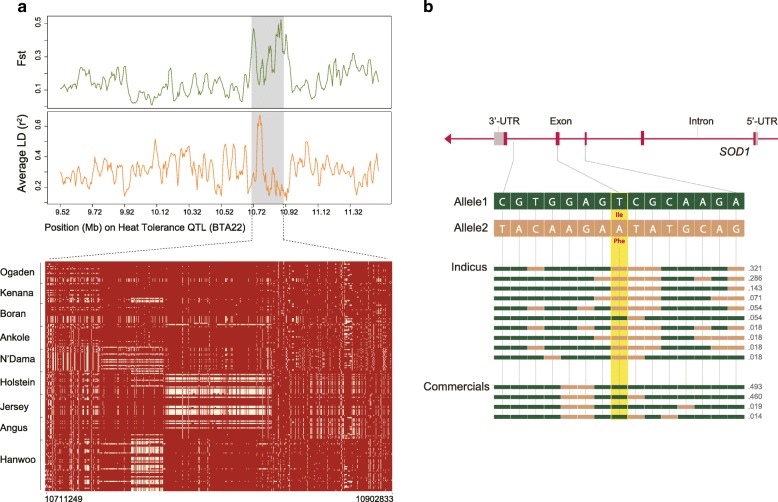
Results: We analyze patterns of African cattle genetic variation by sequencing 48 genomes from five indigenous populations and comparing them to the genomes of 53 commercial taurine breeds. We find the highest genetic diversity among African zebu and sanga cattle. Our search for genomic regions under selection reveals signatures of selection for environmental adaptive traits. In particular, we identify signatures of selection including genes and/or pathways controlling anemia and feeding behavior in the trypanotolerant N'Dama, coat color and horn development in Ankole, and heat tolerance and tick resistance across African cattle especially in zebu breeds.

Conclusions: Our findings unravel at the genome-wide level, the unique adaptive diversity of African cattle while emphasizing the opportunities for sustainable improvement of livestock productivity on the continent.

Keywords: Adaptation; African cattle; Diversity; Genome.


Figures

Fig. 1
Fig. 1
a Geographic locations of African cattle populations. b Nucleotide genome diversity. Number of single nucleotide polymorphisms (SNPs) identified in each breed (left y-axis) with respect to the reference genome (UMD 3.1). Lower bars represent the number of breed-specific SNPs (right y-axis)
Fig. 2
Fig. 2
Population structure and relationships of African in comparison to commercial cattle. a Principal component (PC) analysis, PC 1 against PC 2. b Proportion of ancestry for each individual assuming different number of ancestral population (K = 2, 3, and 4). Colors in each vertical line represent the likelihood proportion of an animal genome assigned to a source population. c Neighbor-joining tree of the relationships between the nine cattle breeds (101 animals). The scale bar represents the identity-by-state (IBS) score between pairs of animals. d Genome-wide distribution of nucleotide diversity in 50-kb non-overlapping window
Fig. 3
Fig. 3
African cattle effective population size and history. a Estimated effective population size of each African cattle breed and the combined commercial (Hanwoo + Jersey + Holstein + Angus). b Pattern of population splits and mixture between the nine cattle breeds. The drift parameter is proportional to Ne generations, where Ne is the effective population size. Scale bar shows ten times the average standard error of the estimated entries in the sample covariance matrix. The migration edge from the European taurine lineage into the Ankole is colored according to the percent ancestry received from the donor population
Fig. 4
Fig. 4
Signatures of selective sweep at the N’Dama HCRTR1, SLC40A1, EPB42, and STOM gene regions. Nucleotide diversity plots of the HCRTR1 (a) and SLC40A1 (c) genomic regions. Haplotype diversity at the HCRTR1 (b) and SLC40A1 (d) gene regions (gray area). The major allele at each SNP position in N’Dama is colored in red, the minor one in white. The star (*) denotes non-synonymous N’Dama SNP identified at the HCRTR1 gene region. e Frequency of N’Dama fixed haplotype (SLC40A1 region) in others breeds with comparison with major observed haplotype(s) (frequency > 0.15 shown). Nucleotide with green background represents distinct polymorphism compared to the major SNP allele present in N’Dama. f, g Structure of the EPB42 and STOM gene with exons indicated by vertical bars. Non-synonymous SNPs represent p.Arg503His and p.Met48Val and are highlighted in yellow. Different color represents different alleles, and frequency of each haplotype is indicated on the right side of the figure
Fig. 5
Fig. 5
A selective sweep associated with heat tolerance in African cattle. a Fixation index (Fst) and linkage disequilibrium values for Bos indicus samples in 20-kb sliding windows with 5-kb steps (top) and the degree of haplotype sharing around heat tolerance QTL (10.71–10.90 Mb region on chromosome 22). Fst is calculated between B. indicus and commercial samples. The major allele in each B. taurus and B. indicus populations is indicated in red. b Structure of the SOD1 gene with exons indicated by vertical bars. A non-synonymous SNP represents p.Ile95Phe and is highlighted in yellow. Haplotype frequencies are indicated by numbers next to each haplotype. In each haplotype, green and beige bars represent alleles 1 and 2, respectively

References

    1. Schneider HK. The subsistence role of cattle among the Pakot and in East Africa. Am Anthropol. 1957;59:278–300. doi: 10.1525/aa.1957.59.2.02a00080. - DOI
    1. di Lernia S, Tafuri MA, Gallinaro M, Alhaique F, Balasse M, Cavorsi L, et al. Inside the “African cattle complex”: Animal burials in the Holocene central Sahara. PLoS One. 2013;8:e56879. doi: 10.1371/journal.pone.0056879. - DOI - PMC - PubMed
    1. Herskovits MJ. The cattle complex in East Africa*. Am Anthropol. 1926;28:230–72. doi: 10.1525/aa.1926.28.1.02a00050. - DOI
    1. Bradley D, MacHugh D, Loftus R, Sow R, Hoste C, Cunningham E. Zebu‐taurine variation in Y chromosomal DNA: a sensitive assay for genetic introgression in West African trypanotolerant cattle populations. Anim Genet. 1994;25:7–12. doi: 10.1111/j.1365-2052.1994.tb00440.x. - DOI - PubMed
    1. Freeman A, Meghen C, Machugh D, Loftus R, Achukwi M, Bado A, et al. Admixture and diversity in West African cattle populations. Mol Ecol. 2004;13:3477–87. doi: 10.1111/j.1365-294X.2004.02311.x. - DOI - PubMed

Publication types