. 2017 Feb 20;18(1):37.
doi: 10.1186/s13059-017-1162-x.

RNAs competing for microRNAs mutually influence their fluctuations in a highly non-linear microRNA-dependent manner in single cells

Affiliations

RNAs competing for microRNAs mutually influence their fluctuations in a highly non-linear microRNA-dependent manner in single cells

Carla Bosia et al. Genome Biol. .

Abstract

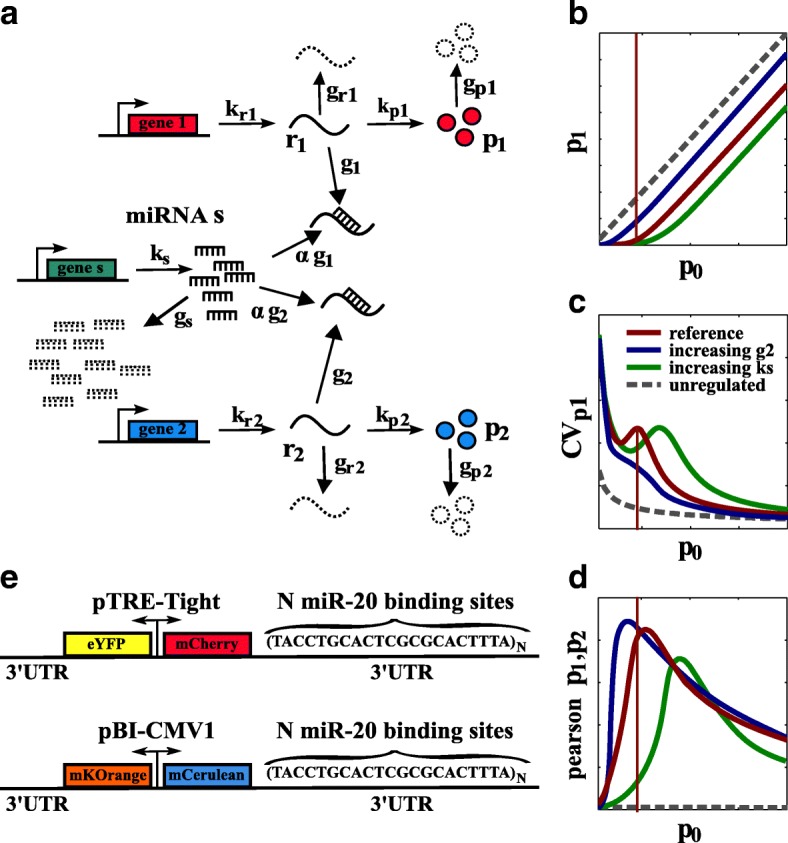
Background: Distinct RNA species may compete for binding to microRNAs (miRNAs). This competition creates an indirect interaction between miRNA targets, which behave as miRNA sponges and eventually influence each other's expression levels. Theoretical predictions suggest that not only the mean expression levels of targets but also the fluctuations around the means are coupled through miRNAs. This may result in striking effects on a broad range of cellular processes, such as cell differentiation and proliferation. Although several studies have reported the functional relevance of this mechanism of interaction, detailed experiments are lacking that study this phenomenon in controlled conditions by mimicking a physiological range.

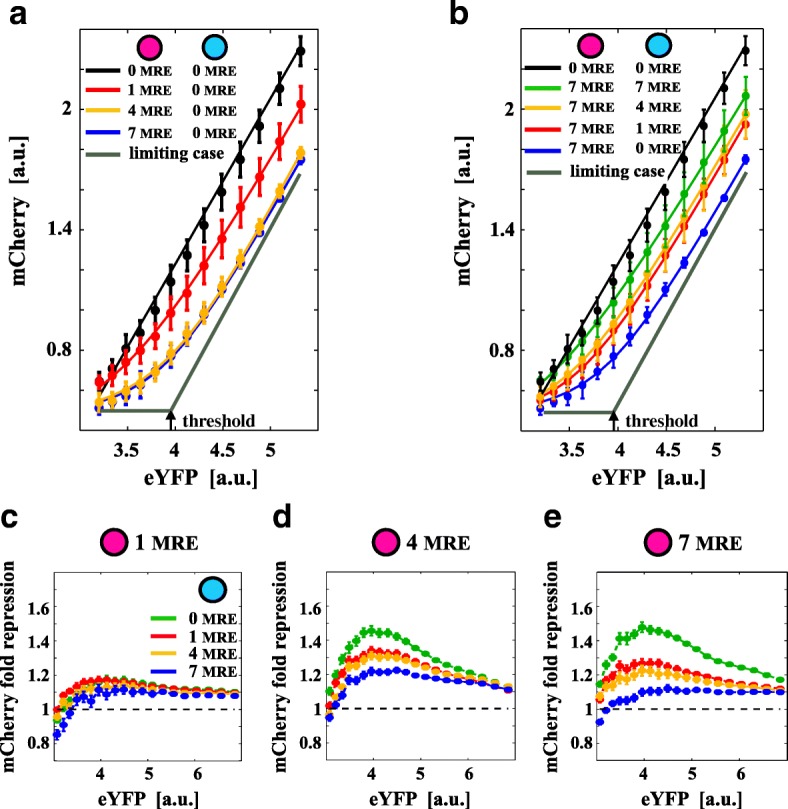
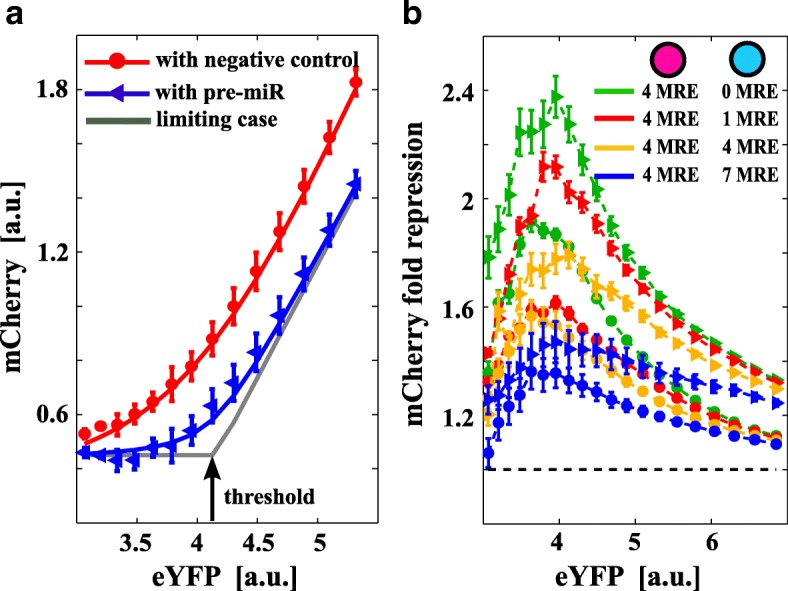
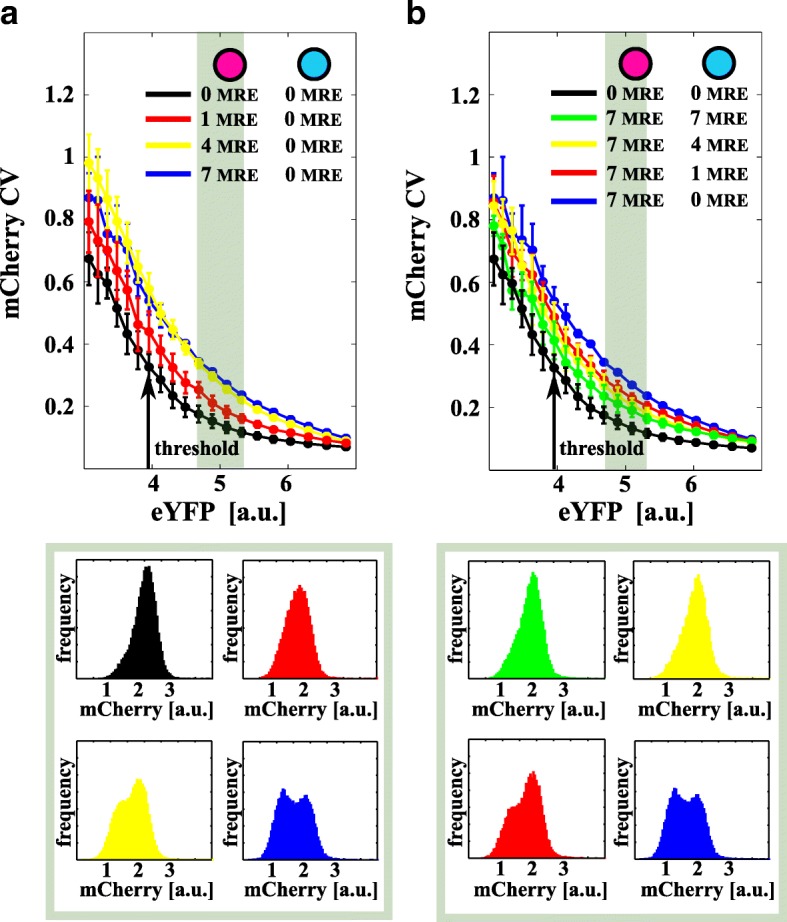
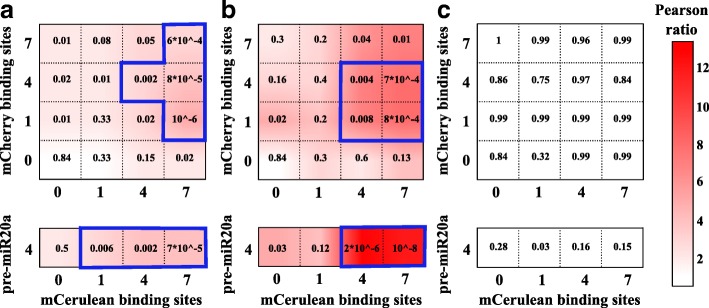
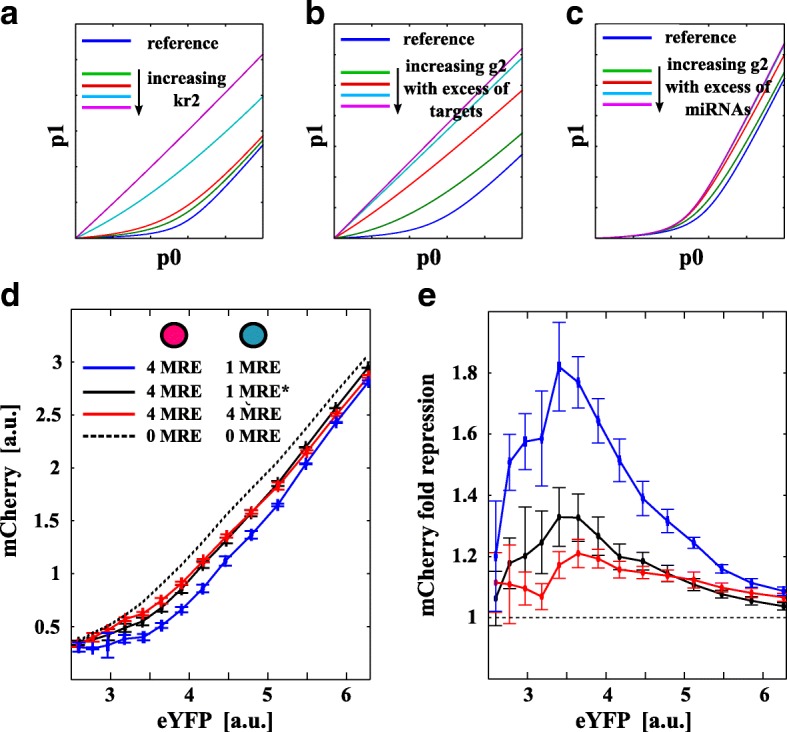
Results: We used an experimental design based on two bidirectional plasmids and flow cytometry measurements of cotransfected mammalian cells. We validated a stochastic gene interaction model that describes how mRNAs can influence each other's fluctuations in a miRNA-dependent manner in single cells. We show that miRNA-target correlations eventually lead to either bimodal cell population distributions with high and low target expression states, or correlated fluctuations across targets when the pool of unbound targets and miRNAs are in near-equimolar concentration. We found that there is an optimal range of conditions for the onset of cross-regulation, which is compatible with 10-1000 copies of targets per cell.

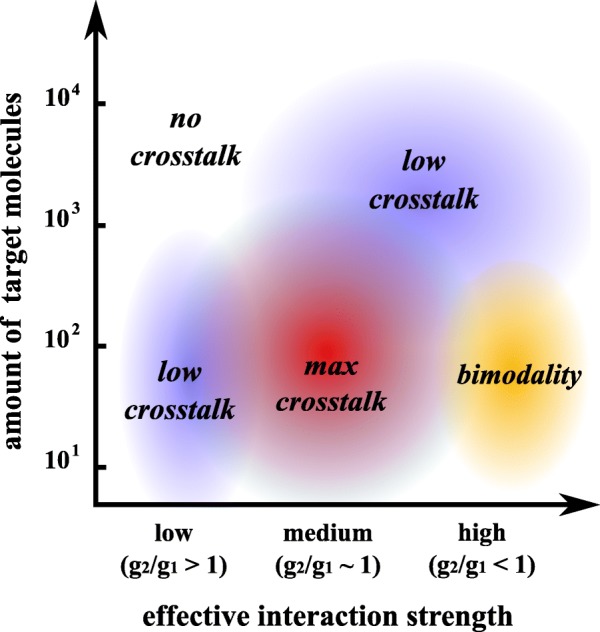
Conclusions: Our results are summarized in a phase diagram for miRNA-mediated cross-regulation that links experimentally measured quantities and effective model parameters. This phase diagram can be applied to in vivo studies of RNAs that are in competition for miRNA binding.

Keywords: Bimodality; MicroRNA target synchronization; Post-transcriptional cross-regulation; Single cell; Stochastic modelling.


Figures

Fig. 1
Fig. 1
Model and predictions. a Sketch of the minimal model of miRNA–target interactions. One miRNA s and two targets r 1 and r 2 are independently transcribed with rates k s, kr1, and kr2, respectively. Each transcript can then degrade with rate g s, gr1, or gr2, respectively. Each miRNA s can interact with targets r 1 or r 2 with effective binding rates g 1 or g 2. α measures the probability of miRNA recycling. If not bound to a miRNA, targets r 1 and r 2 can be translated into proteins p 1 and p 2, respectively, which could then degrade with rates gp1 and gp2. bd Predictions from the stochastic model of interactions sketched in (a) as a function of p 0 (which is the constitutive value of p 1 when g 1 tends to 0) in terms of b the mean amount of p 1 free molecules, c the p 1 coefficient of variation CVp1, and d the Pearson correlation coefficient between p 1 and p 2. In (bd), the red curve is the reference curve for a given set of parameters while the red line identifies the threshold. Blue and green curves show how the red curve would move when increasing the interaction strength with the second target g 2 or the pool of miRNA via the miRNA transcription rate k s, respectively. e Schematic representation of the two bidirectional plasmids coding for the four fluorophores. miRNA microRNA, UTR untranslated region
Fig. 2
Fig. 2
Titration-induced threshold determines the optimal crosstalk. a, b mCherry mean fluorescence (a proxy for p 1 in the model, Fig. 1 b) is plotted against eYFP (a proxy for the constitutive expression p 0 in the model). Error bars are evaluated on the biological replicates. Continuous lines are model fits. The gray curves in (a) and (b) are the model prediction with the parameters fitted from the data and miRNA/target effective interaction strength g 1. The black arrow points to the model-predicted threshold. A threshold (or non-linear behavior) emerges when increasing mCherry MRE (a) while it disappears when increasing mCerulean MRE (b). The onset of the threshold is very close to the origin of the plot, indicating a relatively small amount of free miRNA. The intensity of crosstalk (measured in terms of fold-repression F with respect to the unregulated fluorophores) depends on the particular combination of MRE on both exogenous targets (ce). F is the ratio between the value of mCherry in the absence of miR-20a MREs and its value in the presence of MREs for each eYFP bin and for each N on mCerulean. Purple and cyan circles in legends represent the plasmids coding for the mCherry and mCerulean fluorophores. a.u. arbitrary units, eYFP enhanced yellow fluorescent protein, MRE miRNA regulatory element
Fig. 3
Fig. 3
miRNA increase shifts the maximal crosstalk region. a mCherry mean fluorescence (a proxy for p 1 in the model, Fig. 1 b) is plotted against eYFP (a proxy for the constitutive expression p 0 in the model). Blue triangles and red circles are data from cotransfection with pre-miR20a and negative controls, respectively. Error bars are evaluated on the biological replicates. The gray curve is the model prediction with the parameters fitted from the data and miRNA/target effective interaction strength g 1. The black arrow points to the model-predicted threshold. According to the model, increasing the pool of available miRNAs (transfecting pre-miRNAs) shifts the threshold to higher constitutive expression values. b Different combinations of miR-20a MREs lead to different levels of fold-repression and crosstalk. Triangles and circles in the plot are data from transfections with pre-miR20a and negative controls, respectively. Purple and cyan circles in legends represent the plasmids coding for mCherry and mCerulean fluorophores, respectively. a.u. arbitrary units, eYFP enhanced yellow fluorescent protein, MRE miRNA regulatory element
Fig. 4
Fig. 4
Retroactivity increases cell-to-cell variability. a, b mCherry total noise, quantified by its coefficient of variation (CV, a proxy for CVp1 in Fig. 1 c), is plotted against eYFP (a proxy for the constitutive expression p 0 in the model). The black arrow identifies the model-predicted threshold shown in Fig. 2. Error bars are evaluated on the biological replicates. CV globally increases on increasing the number of mCherry MREs (a) while it decreases on increasing the number of mCerulean MREs (b). The competition between these two strengths results in lowering the noise even if the expected repression from the rough number of mCherry MREs is high. Histograms in the lower panels show mCherry data distributions for the shaded regions in (a) and (b). A strong miRNA target repression strength increases cell-to-cell variability with the eventual appearance of different phenotypes (bimodal distributions). Purple and cyan circles in legends represent the plasmids coding for mCherry and mCerulean fluorophores, respectively. a.u. arbitrary units, CV coefficient of variation, eYFP enhanced yellow fluorescent protein, MRE miRNA regulatory element
Fig. 5
Fig. 5
Fold Pearson and p values. The Pearson ratio is measured for three different values of eYFP basal expression: below threshold (a), around threshold (b), and above threshold (c). p values are reported for each combination of miRNA MREs on the two plasmids. The regions inside the blue perimeters are statistically significant with p<0.01. As predicted by the model, the correlation is maximal around the threshold and could be even 12-fold higher than in the unregulated case. Blue-delimited areas are regions whose Pearson ratio (i.e., the ratio of the Pearson coefficients between mCherry and mCerulean possessing different MREs for the same measure in the absence of MREs) is statistically relevant with respect to the corresponding unregulated case. eYFP enhanced yellow fluorescent protein, miRNA microRNA, MRE miRNA regulatory element
Fig. 6
Fig. 6
Interplay between transcriptional activity and miRNA–target interaction strength. The figure shows model predictions and experimental results obtained when investigating the effect on one target (say p 1) of the interplay between the second target (say r 2 and, thus, p 2) and the miRNA. The interplay between r 2 and miRNA is tuned both via the transcription rate kr2 of r 2 and via the interaction strength g 2 between r 2 and the miRNA. p 1 is plotted against p 0 on a increasing the transcription rate kr2 of r 2, b increasing the interaction strength g 2 between miRNA and r 2 when kr2>ks (excess of targets), and c increasing the interaction strength g 2 between miRNA and r 2 when kr2<ks (excess of miRNA). The model prediction for cases depicted in (a) and (b) are qualitatively very similar. d mCherry mean fluorescence (a proxy for p 1 in the model) is plotted against eYFP (a proxy for the constitutive expression p 0 in the model). The dashed black line corresponds to the unregulated case while the blue data points correspond to the reference case with four MREs on mCherry and one MRE on mCerulean. Either increasing the copy number of mCerulean (a proxy for kr2 in the model), black data points, or the number of MREs on its sequence (a proxy for g 2 in the model), red data points, has the effect of decreasing the amount of miRNA available to target mCherry (which globally increases). e Fold-repression with respect to the unregulated case plotted against eYFP. Error bars are evaluated on the biological replicates. a.u. arbitrary units, eYFP enhanced yellow fluorescent protein, miRNA microRNA, MRE miRNA regulatory element
Fig. 7
Fig. 7
Phase diagram for mCherry (the target product p 1). The figure shows how the crosstalk between targets and bimodality on mCherry behave on varying the effective miRNA interaction strength and the mean numbers of target mRNA molecules. The effective miRNA interaction strength on target r 1 (and, thus, p 1) is measured theoretically through the ratio g 2/g 1 and experimentally with different combinations of miRNA binding sites on both synthetic constructs

References

    1. Flynt AS, Lai EC. Biological principles of microRNA-mediated regulation: shared themes amid diversity. Nat Rev Genet. 2008;9(11):831–42. doi: 10.1038/nrg2455. - DOI - PMC - PubMed
    1. Bartel DP. MicroRNAs: genomics, biogenesis, mechanism, and function. Cell. 2004;116(2):281–97. doi: 10.1016/S0092-8674(04)00045-5. - DOI - PubMed
    1. Bushati N, Cohen SM. MicroRNA functions. Annu Rev Cell Dev Biol. 2007;23:175–205. doi: 10.1146/annurev.cellbio.23.090506.123406. - DOI - PubMed
    1. Alvarez-Garcia I, Miska EA. MicroRNA functions in animal development and human disease. Development. 2005;132(21):4653–62. doi: 10.1242/dev.02073. - DOI - PubMed
    1. Esquela-Kerscher A, Slack FJ. Oncomirs – microRNAs with a role in cancer. Nat Rev Cancer. 2006;6(4):259–69. doi: 10.1038/nrc1840. - DOI - PubMed

Publication types