. 2017 Feb 20;9(1):18.
doi: 10.1186/s13073-017-0404-6.

A functional SNP associated with atopic dermatitis controls cell type-specific methylation of the VSTM1 gene locus

Affiliations

A functional SNP associated with atopic dermatitis controls cell type-specific methylation of the VSTM1 gene locus

Dilip Kumar et al. Genome Med. .

Abstract

Background: Expression quantitative trait loci (eQTL) databases represent a valuable resource to link disease-associated SNPs to specific candidate genes whose gene expression is significantly modulated by the SNP under investigation. We previously identified signal inhibitory receptor on leukocytes-1 (SIRL-1) as a powerful regulator of human innate immune cell function. While it is constitutively high expressed on neutrophils, on monocytes the SIRL-1 surface expression varies strongly between individuals. The underlying mechanism of regulation, its genetic control as well as potential clinical implications had not been explored yet.

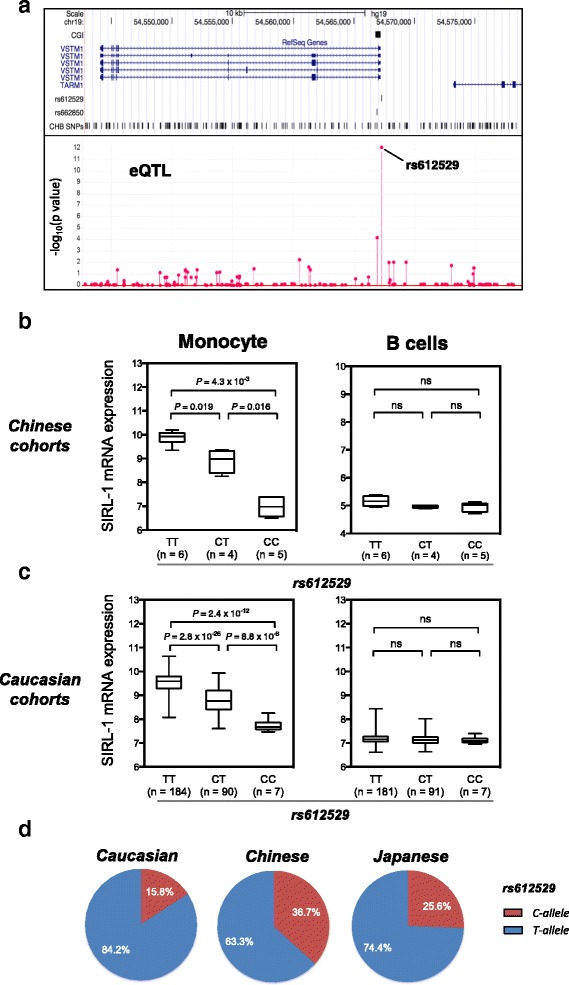
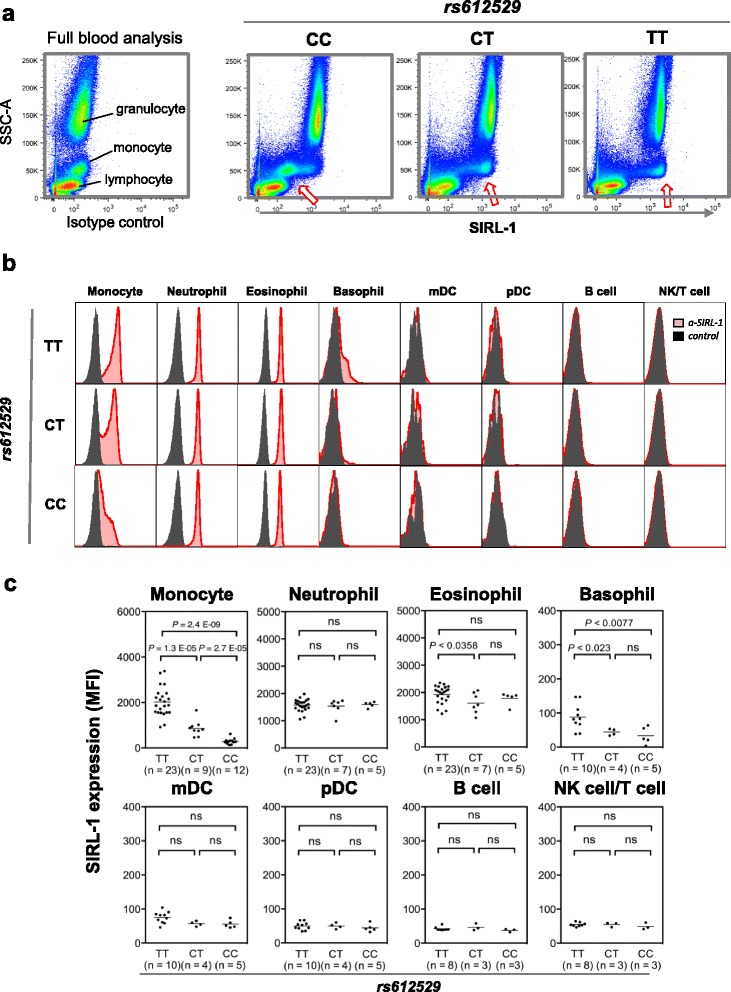
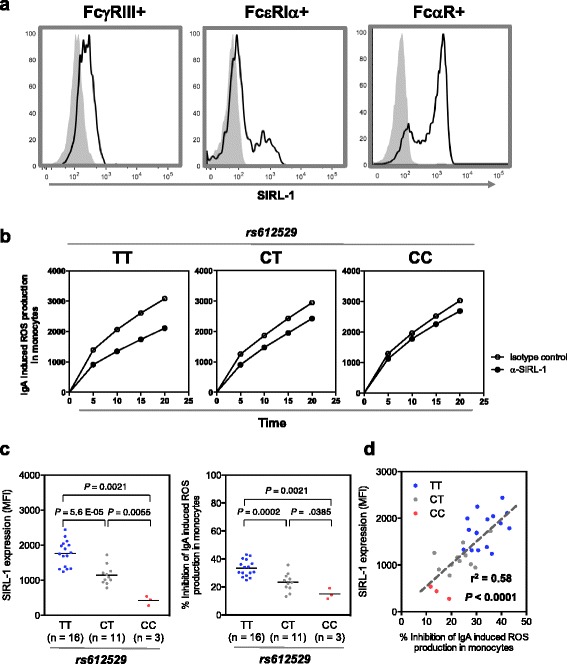
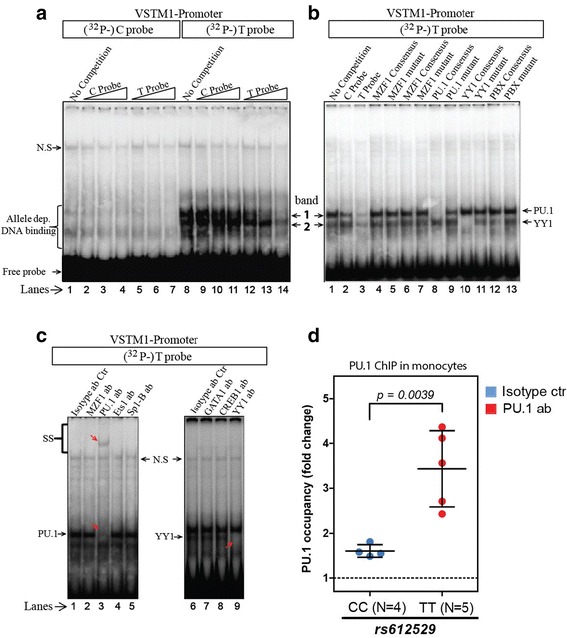
Methods: Whole blood eQTL data of a Chinese cohort was used to identify SNPs regulating the expression of VSTM1, the gene encoding SIRL-1. The genotype effect was validated by flow cytometry (cell surface expression), correlated with electrophoretic mobility shift assay (EMSA), chromatin immunoprecipitation (ChIP) and bisulfite sequencing (C-methylation) and its functional impact studied the inhibition of reactive oxygen species (ROS).

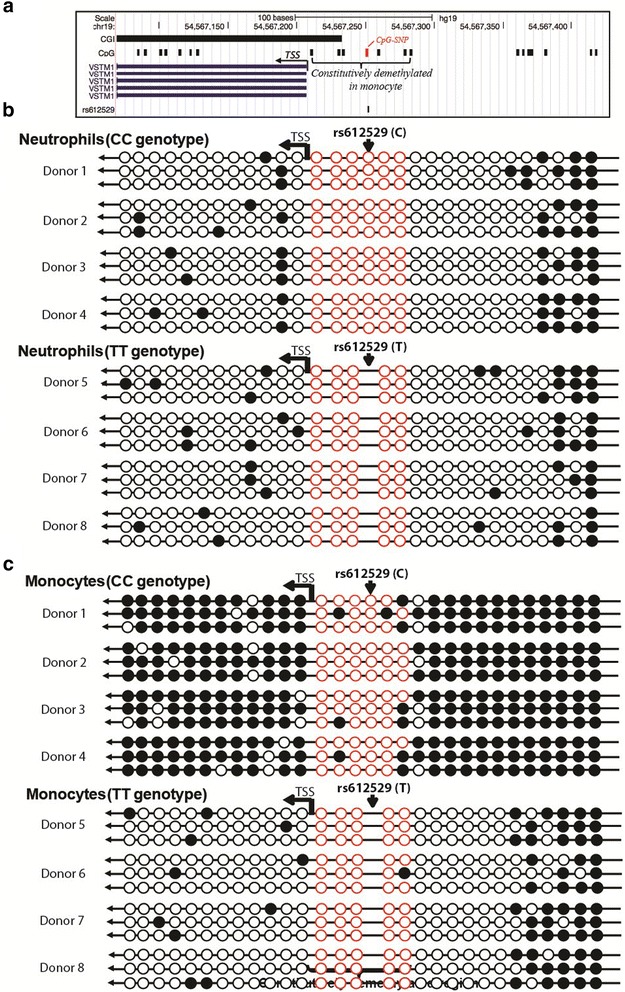
Results: We found a significant association of a single CpG-SNP, rs612529T/C, located in the promoter of VSTM1. Through flow cytometry analysis we confirmed that primarily in the monocytes the protein level of SIRL-1 is strongly associated with genotype of this SNP. In monocytes, the T allele of this SNP facilitates binding of the transcription factors YY1 and PU.1, of which the latter has been recently shown to act as docking site for modifiers of DNA methylation. In line with this notion rs612529T associates with a complete demethylation of the VSTM1 promoter correlating with the allele-specific upregulation of SIRL-1 expression. In monocytes, this upregulation strongly impacts the IgA-induced production of ROS by these cells. Through targeted association analysis we found a significant Meta P value of 1.14 × 10⁻⁶ for rs612529 for association to atopic dermatitis (AD).

Conclusion: Low expression of SIRL-1 on monocytes is associated with an increased risk for the manifestation of an inflammatory skin disease. It thus underlines the role of both the cell subset and this inhibitory immune receptor in maintaining immune homeostasis in the skin. Notably, the genetic regulation is achieved by a single CpG-SNP, which controls the overall methylation state of the promoter gene segment.

Keywords: Atopic dermatitis; Expression quantitative trait loci (eQTL); Monocytes; Neutrophils; Reactive oxygen species (ROS); Signal inhibitory receptor on leukocytes-1 (SIRL-1); VSTM1.


Figures

Fig. 1
Fig. 1
rs612529 is an eQTL affecting SIRL-1 expression. a Manhattan plot of whole blood eQTLs located in the SIRL-1-encoding VSTM1 gene region. The upper panel depicts the position of VSTM1 transcripts in relation to a CGI and the SNPs rs612529 and rs662850. The lower panel shows the eQTL-association determined from whole blood samples of 202 Chinese individuals. The P value (expressed as –log10) is displayed on the y-axis, the x-axis shows the location of the SNPs (rs612529 is indicated). b, c Genotype effect of rs612529 on the SIRL-1 mRNA expression monocytes and B cells. The data were generated from cohort samples of 15 Chinese [18] and 281 Caucasian individuals [19]. The number of individuals per genotype is indicated on the x-axis; the y-axis represents the SIRL-1 mRNA expression levels depicted as log2 value. d Allele frequencies of rs612529 in three major ethnical groups. The pie charts display the frequencies of the C allele (red) and the T allele (blue) for Caucasian, Han Chinese, and Japanese based on HapMap
Fig. 2
Fig. 2
Cell-type–specific effect of rs612529 on SIRL-1 surface expression. a Flow cytometry analysis of whole blood samples. Whole blood samples were stained with a SIRL-1 specific antibody (right panel) and an isotype-matched control antibody (left panel). The staining is shown vs. the side scatter (SSC-A), which allows a simple discrimination of granulocytes, monocytes, and lymphocytes. The plots are representative examples of individuals with the rs612529 genotype TT, TC, and CC. Arrows indicate the gradual increase in SIRL-1 staining on monocytes. b Genotype-dependent SIRL-1 expression on various cell types. SIRL-1 staining (red) in reference to the isotype control (black) is shown for each of the three rs612529-genotypes for myeloid cells (monocyte, neutrophil, eosinophil, basophil, mDC, and pDC) and two lymphocyte subsets (B cell, NK cell/T cell). Data were generated by flow cytometry from whole blood samples after gating on the respective cell subset (gating strategy is displayed in Additional file 4). c Cohort-wide distribution of the SIRL-1 expression. The dot plots summarize the SIRL-1 FACS data for a cohort of 44 genotype-matched individuals
Fig. 3
Fig. 3
Allele-specific inhibition of IgA-induced ROS production by SIRL-1. a Comparison of the SIRL-1 expression on monocytes expressing FcγRIII-, FcεRIa- or FcαR-receptors. Flow cytometry analysis of the SIRL-1 surface expression is shown for monocytes gated on the expressing of the Fc-receptors FcγRIII, FcεRI or FcαR (gating strategy is shown in Additional file 5). The SIRL-1 specific staining (black lines) is shown in reference to the isotype control (gray). b Allele-dependent inhibition of ROS production. FcαR-mediated ROS production is shown for primary monocytes induced by plate-bound IgA in the presence of agonistic anti-SIRL-1 antibodies (filled circle) or isotype-matched control antibody (open circle). Representative examples are shown for each of the three rs612529-genotypes. ROS production was measured by ELISA at λExEm = 545/590 nm using H2O2 sensitive Amplex Red; the units represent background corrected relative fluorescence unit (RFU). c ROS inhibition obtained for a cohort of 30 genotyped donors. The plots display the SIRL-1 surface expression (left panel) and the percent inhibition of the IgA-induced ROS production (right panel) in reference to the respective rs612529 genotype. d The correlation of SIRL-1 expression with the inhibition of IgA-induced ROS production. The correlation shown is 30 individuals. Dashed line represents the linear regression. rs612529 genotype is indicated by the color code (TT: blue, CT: gray; CC: red)
Fig. 4
Fig. 4
rs612529 C/T controls the binding of PU.1/YY1 to the VSTM-1 promoter. a Allele-specific binding to rs612529. EMSA experiments with nuclear extracts from monocytes were carried out with radiolabeled probes representing the C allele (“C probe;” lanes 1–7) or the T allele of rs612529 (“T probe;” lanes 8–14). In a “cold” competition, the binding to the radiolabeled probes was competed with unlabeled C probes (lanes 2–4 and 9–11) or T probes (lanes 5–7 and 12–14). Bands 1 and 2 are two bands formed by allele-specific binding; “N.S.” indicates a non-specific band. b Competition with consensus binding motifs of predicted candidate factors. Binding to the T probe was competed with unlabeled probes representing consensus binding motifs for MZF-1, PU.1 and YY1 (PBX was used as control). Binding of each factor was competed with the optimal consensus sequence as well as a mutated variant to which the binding was abolished (sequences are listed in Additional file 7). c Super-shift assays. Super-shift assays were carried out with the T probe and antibodies against MZF-1 (lane 2), PU.1 (lane 3), Ets1 (lane 4), Sp1-B (lane 5), GATA1 (lane 7) CREB1 (lane 8), and YY1 (lane 9) or isotype-matched control antibodies (lanes 1 and 6). Super-shifted bands and bands lost by the antibody treatment are indicated by red arrows. d PU.1-ChIP assay. A ChIP assay with nuclear samples from monocytes of four CC and five TT donors (rs612529) was carried out with PU.1-specific antibodies (red dots) or isotype-matched control antibodies (blue dots). PU.1 occupancy, depicted as fold change compared to the isotype, was determined by quantitative PCR amplification of the respective region in the VSTM-1 promoter (Additional file 3)
Fig. 5
Fig. 5
Allele and cell type-dependent methylation of the VSTM1 gene promoter. a Schematic overview of the analyzed 693 bp region of the VSTM1 gene locus (–1 to –388 upstream and +1 to +305 downstream to TSS). The location of a predicted CGI is indicated together with the position of individual CpG pairs (solid black lines); the CpG-SNP formed by rs612526 is indicated by a red box. The location of the first exon in the transcript variants of VSTM1 (covered in the C-methylation assay) is represented by solid blue vertical lines (the sequence of the 693 bp region is shown in Additional file 3). b Allele-independent C-methylation in neutrophils. The methylation of CpG pairs in the 693 bp region was analyzed by bisulfite sequencing. The methylation state of each CpG element is represented by circles (full circle: methylated, empty circle: demethylated); the location of the TSS as well as of rs612529 is indicated. The methylation state in the cells is shown as a set of three independently sequenced clones each obtained from four different donors of the rs612529 CC genotype (donors 1–4) and the TT genotype (donors 5–8). Red circles indicate CpG pairs of the constitutively demethylated core region. c Allele-dependent methylation in monocytes. The CpG-methylation state is shown for monocytes, which were isolated from the same donors described above for the neutrophils

References

    1. Visscher PM, Brown MA, McCarthy MI, Yang J. Five years of GWAS discovery. Am J Hum Genet. 2012;90:7–24. doi: 10.1016/j.ajhg.2011.11.029. - DOI - PMC - PubMed
    1. Manolio TA. Genomewide association studies and assessment of the risk of disease. N Engl J Med. 2010;363:166–76. doi: 10.1056/NEJMra0905980. - DOI - PubMed
    1. Chan SL, Jin S, Loh M, Brunham LR. Progress in understanding the genomic basis for adverse drug reactions: a comprehensive review and focus on the role of ethnicity. Pharmacogenomics. 2015;16:1161–78. doi: 10.2217/PGS.15.54. - DOI - PubMed
    1. Welter D, MacArthur J, Morales J, Burdett T, Hall P, Junkins H, et al. The NHGRI GWAS Catalog, a curated resource of SNP-trait associations. Nucleic Acids Res. 2014;42:D1001–6. doi: 10.1093/nar/gkt1229. - DOI - PMC - PubMed
    1. Lappalainen T. Functional genomics bridges the gap between quantitative genetics and molecular biology. Genome Res. 2015;25:1427–31. doi: 10.1101/gr.190983.115. - DOI - PMC - PubMed

Substances