. 2017 Feb 21:6:e18422.
doi: 10.7554/eLife.18422.

Perceptual decisions are biased by the cost to act

Affiliations

Perceptual decisions are biased by the cost to act

Nobuhiro Hagura et al. Elife. .

Erratum in

Abstract

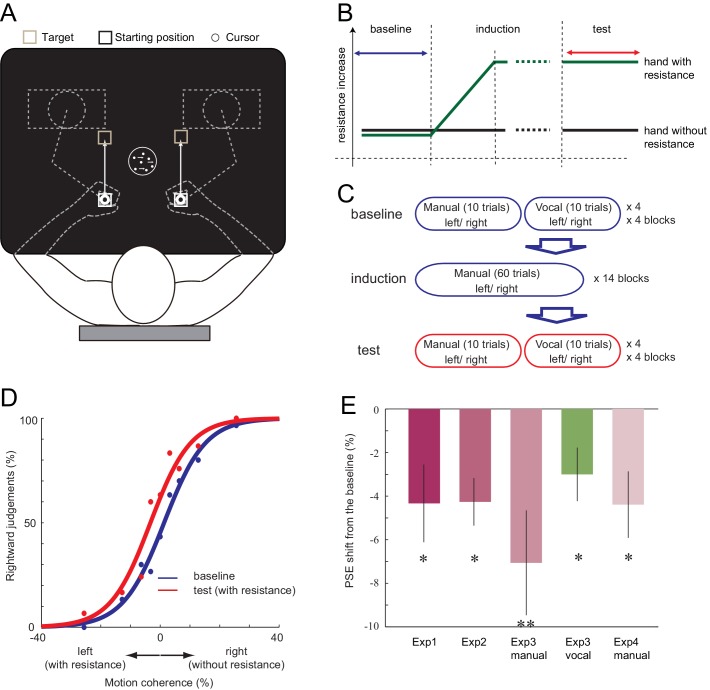
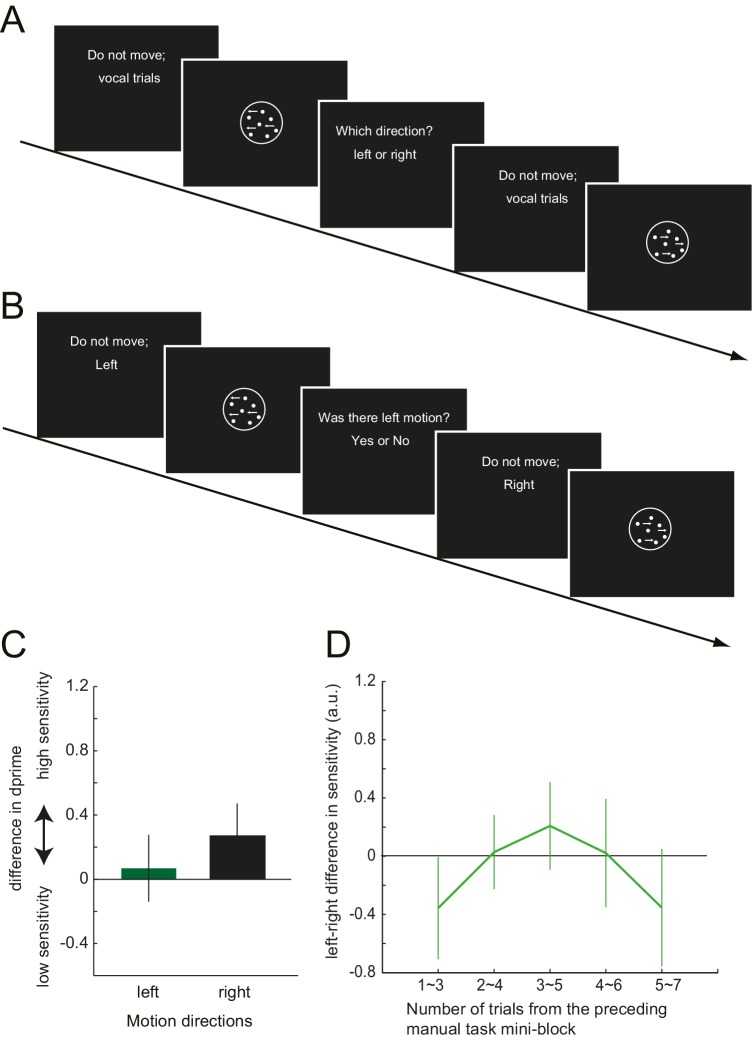
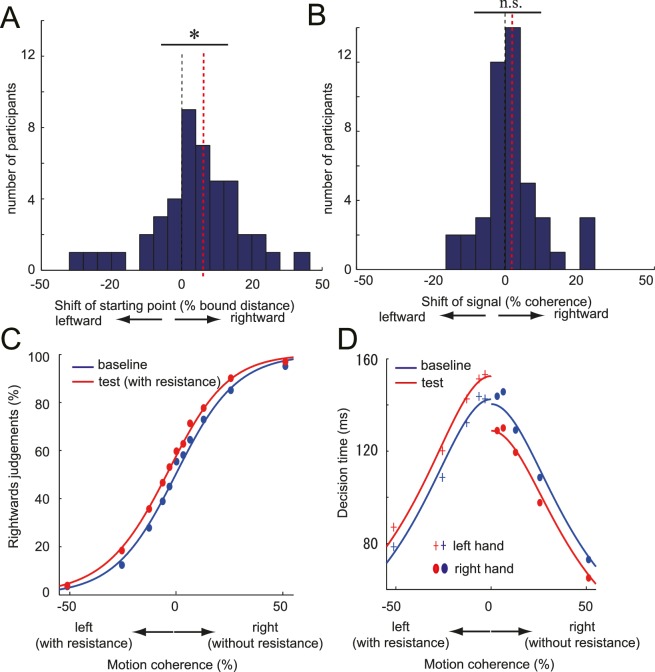
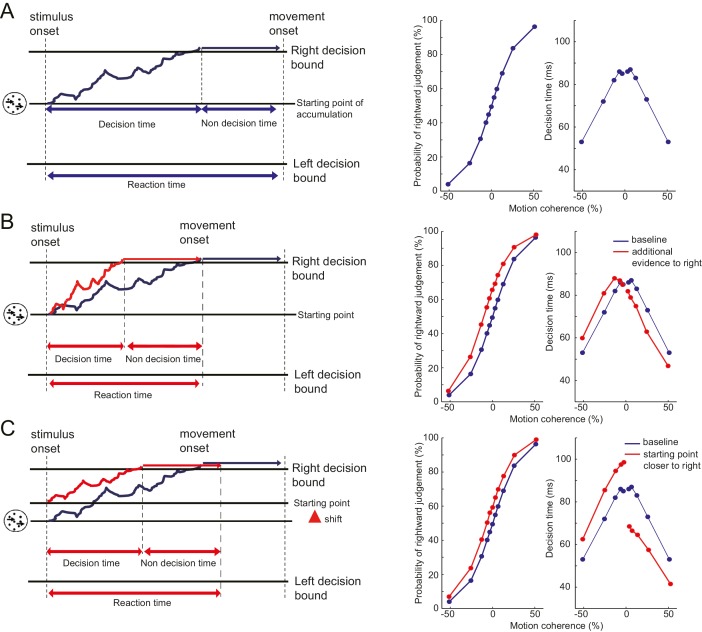
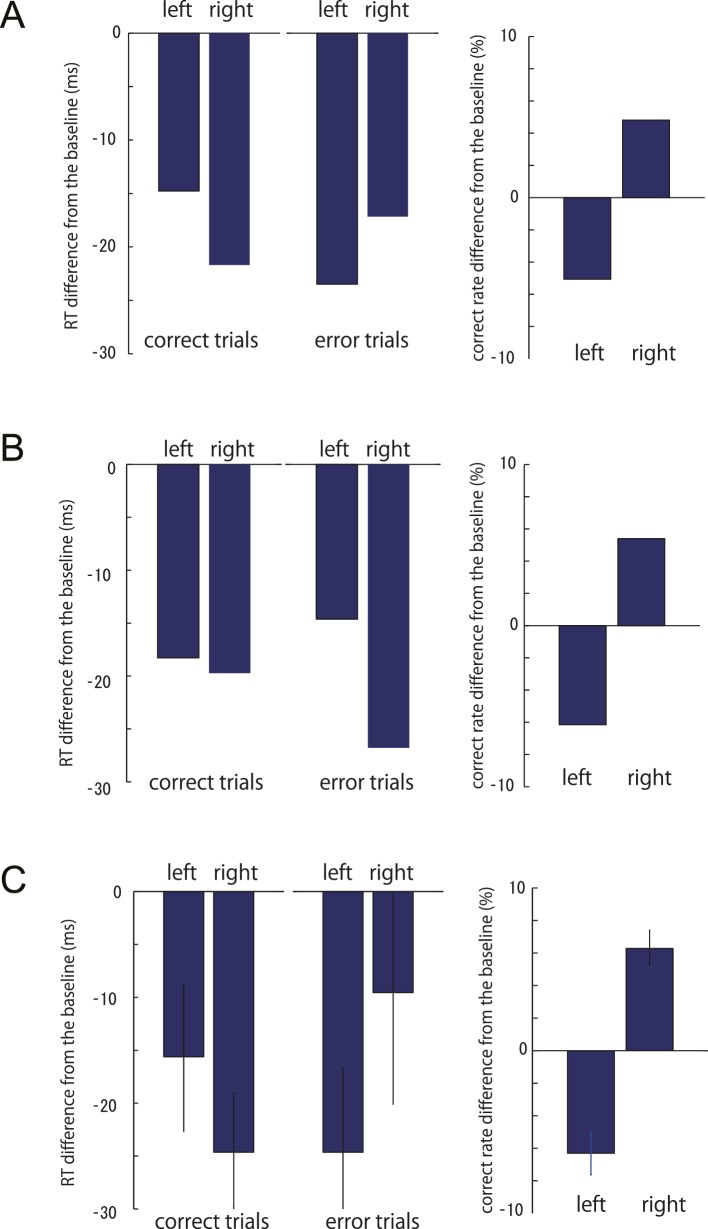
Perceptual decisions are classically thought to depend mainly on the stimulus characteristics, probability and associated reward. However, in many cases, the motor response is considered to be a neutral output channel that only reflects the upstream decision. Contrary to this view, we show that perceptual decisions can be recursively influenced by the physical resistance applied to the response. When participants reported the direction of the visual motion by left or right manual reaching movement with different resistances, their reports were biased towards the direction associated with less effortful option. Repeated exposure to such resistance on hand during perceptual judgements also biased subsequent judgements using voice, indicating that effector-dependent motor costs not only biases the report at the stage of motor response, but also changed how the sensory inputs are transformed into decisions. This demonstrates that the cost to act can influence our decisions beyond the context of the specific action.

Keywords: action; decision making; diffusion model; effort; human; neuroscience; perception.


Conflict of interest statement

The authors declare that no competing interests exist.

Figures

Figure 1.
Figure 1.. Setup of the experiment and the shift of PSE induced by the motor cost.
(A) Participants made 15 cm reaching movement to the target with their hand (left or right), in response to the perceived direction (left or right) of the random-dot motion. (B) In all the experiments, the baseline phase and the test phase was interleaved by the induction phase, in which the resistance for one of the manipulandum movement gradually increased. (C) In Experiment 3, the baseline and the test phase included both manual and vocal motion discrimination, each being serially presented within a 10 trial block. (D) Fitted psychometric function to the probability of a response towards the right in the baseline (blue) and the test (red) phase of a representative participant (Experiment 1). Negative motion coherence value indicates the leftward motion (with manual resistance), and positive towards the right (without manual resistance). (E) Shift of PSE from the baseline in Experiments 1, 2, 3 and 4. Negative value indicates the PSE shift towards the motion direction with resistance (i.e. decreased judgements towards the motion direction having resistance in their manual response). Error bars indicate standard error of mean across participants. Data for Figure 1E is available as Figure 1—source data 1. *p<0.05, **p<0.01. DOI: http://dx.doi.org/10.7554/eLife.18422.003
Figure 1—figure supplement 1.
Figure 1—figure supplement 1.. Example of the peak resistive force increase profile in the study.
The presented data is force data from Experiment 1, averaged across trials and participants in each session. Here, each session contains 66 trials (33 trials for each left and right) of reaching movements. Since the resistive force is provided in a velocity-dependent manner, the variance is reflecting the variability of the movement velocity across participants. DOI: http://dx.doi.org/10.7554/eLife.18422.005
Figure 2.
Figure 2.. Schematic diagram illustrating the process of perceptual decision making, and the possible influence of the motor cost on the decision process.
Perceptual decision making consists of three different processing stages. First, the features of the sensory input are extracted and encoded as in the sensory representation. Second, the perceptual (categorical) decision is made based on this sensory representation (decision layer). Finally, the decision is transferred to the response effector. The motor cost asymmetry during the manual response can affect the perceptual decision making process in several different ways. (A) The motor cost for the manual response may only bias the decision layer that involves this response, but leave the decision layer for different response effectors unaffected. If this is the case, the bias observed during the manual response should not generalise to the verbal response. (B) The motor cost may bias the decision layer in general or (C) the sensory representation directly. In either of the latter two cases, the effect of motor cost should be also observable during the response using the different effector. DOI: http://dx.doi.org/10.7554/eLife.18422.006
Figure 3.
Figure 3.. Trial structure of Experiment 4 and the effect of preceding motor cost experience on participants' motion judgements.
(A) In Experiment 4, participants made vocal judgements to a yes-no motion detection task, and manual judgement to a left-right discrimination task. (B): Shift of the criterion of motion detection from the baseline during the vocal judgement task in Experiment 4 (d' data is presented in the Figure 3—Figure Supplement 1C). Negative value indicates the shift towards more conservative criterion for the motion detection. (C) PSE shift from the baseline condition in Experiment 3, plotted against the number of trials from the preceding manual judgements. Negative value indicates the shift of PSE towards the motion direction with resistance (i.e. decreased judgements towards the motion direction having resistance in their manual response). (D) Vocal motion detection criterion differences between the leftward (with manual response resistance) and rightward (without resistance) motion (Experiment 4). The difference is plotted against the number of trials from the preceding manual judgements. Negative value indicates a more conservative criterion for leftward than for rightward motion. Error bars indicate standard error of mean across participants. Data for Figure 3B–D is available as Figure 3—source data 1. *p<0.05. DOI: http://dx.doi.org/10.7554/eLife.18422.007
Figure 3—figure supplement 1.
Figure 3—figure supplement 1.. Task instruction of Experiment 3 and 4, and the d' data of Experiment 4.
(A,B) The task instruction of the vocal task in Experiment 3 (A) and 4 (B), where the participants were asked to vocally discriminate the motion direction (Experiment 3), or asked to vocally detect the motion for the instructed direction (Experiment 4). (C) Shift of the d-prime (sensitivity) of motion detection from the baseline during the vocal judgement task (Experiment 4). (D) Difference in d’ for leftward and rightward motion direction in the vocal judgement of Experiment 4, plotted against the number of trials from the preceding manual judgements. Positive value indicates the higher sensitivity for the rightward motion and the negative for the higher sensitivity to the leftward motion. Error bars indicate standard error of mean across participants. DOI: http://dx.doi.org/10.7554/eLife.18422.009
Figure 4.
Figure 4.. DDM parameter estimates and the fitted psychometric and chronometric function.
(A,B) Histogram of individual starting point shift (A) and the evidence accumulation shift (B) calculated from the DDM (full model). Black dotted line indicates the 0% point (i.e. no effect), and the red dotted line indicates the median of the distribution (i.e. amount of shift). Significant rightward shift of the starting point was observed (median: 5.6%), whereas not for the evidence accumulation shift (median: 1.39%). (C, D) Fit of DDM to the choice (C) and the decision time (D) data averaged across participants (see Materials and methods and Figure 4—figure supplement 1 Panel C). Data for Figure 4A–D is available as Figure 4—source data 1. *p<0.05. DOI: http://dx.doi.org/10.7554/eLife.18422.011
Figure 4—figure supplement 1.
Figure 4—figure supplement 1.. Schematic diagram explaining the drift diffusion model (DDM) and the simulated choice and decision time data.
(A) DDM model postulates that a decision is transformed into action when the evidence favouring one of the choices has been accumulated to a certain threshold level (decision bound) (left panel). The model makes a prediction about the pattern of choice probability and the decision time in respect to the strength of the motion signal (right panel). For the baseline, the starting point of the evidence accumulation is set to 0. (B) When there is more sensory evidence in favour of rightward motion (red line), the drift speed for the rightward decision will increase (left panel), and left would decrease. As a result, a rightward decision becomes more likely (shift of psychometric function) and the decision time pattern generally shifts to the left, showing a tendency to respond faster for the rightward motion (right panel). If the motor cost influences the sensory representation (Figure 2C), we would expect this pattern of results (sensory representation model). (C) A shift in the starting value of the accumulation process induces a prior bias towards a rightward decision, decreasing the required amount of evidence for rightward decision compared to the left (left panel). This will again bias the decision to favour the rightward decision. Instead of shifting the pattern of decision times to the left (as in B), the starting point model predicts an additional offset to the rightward and leftward decision time; shorter for the rightward decision and longer for the leftward decision. In this model, the bias therefore arises from a change in the decision layer transforming the sensory representation into the decision (Figure 2B), while the sensory evidence itself is not changing. DOI: http://dx.doi.org/10.7554/eLife.18422.013
Figure 4—figure supplement 2.
Figure 4—figure supplement 2.. Change of the correct RT, error RT and the correct rate from the baseline to the test phase.
(A) simulated data from the starting point model, (B) simulated data for the evidence accumulation model, (C) actual experimental data (n = 45). Left and right indicates the stimulus motion direction. The left decision was associated with the increased resistance during the test phase. Simulation parameters are based on the estimated parameters from the actual data (Table 2). Error bars in C indicate standard error of mean across participants. DOI: http://dx.doi.org/10.7554/eLife.18422.014

Comment in

References

    1. Bennur S, Gold JI. Distinct representations of a perceptual decision and the associated oculomotor plan in the monkey lateral intraparietal area. Journal of Neuroscience. 2011;31:913–921. doi: 10.1523/JNEUROSCI.4417-10.2011. - DOI - PMC - PubMed
    1. Bogacz R, Brown E, Moehlis J, Holmes P, Cohen JD. The physics of optimal decision making: a formal analysis of models of performance in two-alternative forced-choice tasks. Psychological Review. 2006;113:700–765. doi: 10.1037/0033-295X.113.4.700. - DOI - PubMed
    1. Britten KH, Shadlen MN, Newsome WT, Movshon JA. The analysis of visual motion: a comparison of neuronal and psychophysical performance. Journal of Neuroscience. 1992;12:4745–4765. - PMC - PubMed
    1. Burk D, Ingram JN, Franklin DW, Shadlen MN, Wolpert DM. Motor effort alters changes of mind in sensorimotor decision making. PLoS One. 2014;9:e92681. doi: 10.1371/journal.pone.0092681. - DOI - PMC - PubMed
    1. Cos I, Duque J, Cisek P. Rapid prediction of biomechanical costs during action decisions. Journal of Neurophysiology. 2014;112:1256–1266. doi: 10.1152/jn.00147.2014. - DOI - PubMed

Publication types