

Mitochondria control store-operated Ca2+ entry through Na+ and redox signals
- PMID: 28219928
- PMCID: PMC5350565
- DOI: 10.15252/embj.201592481
Mitochondria control store-operated Ca2+ entry through Na+ and redox signals
Abstract
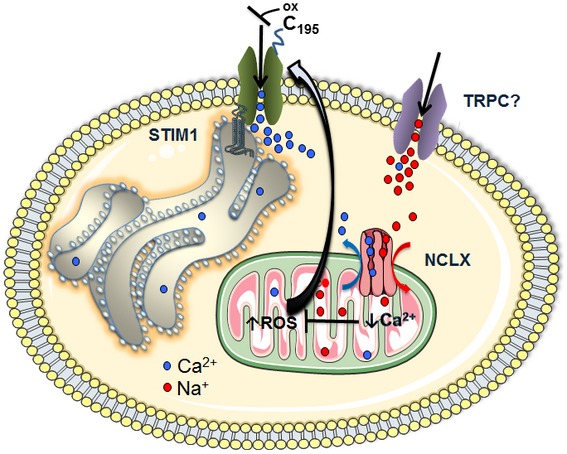
Mitochondria exert important control over plasma membrane (PM) Orai1 channels mediating store-operated Ca2+ entry (SOCE). Although the sensing of endoplasmic reticulum (ER) Ca2+ stores by STIM proteins and coupling to Orai1 channels is well understood, how mitochondria communicate with Orai1 channels to regulate SOCE activation remains elusive. Here, we reveal that SOCE is accompanied by a rise in cytosolic Na+ that is critical in activating the mitochondrial Na+/Ca2+ exchanger (NCLX) causing enhanced mitochondrial Na+ uptake and Ca2+ efflux. Omission of extracellular Na+ prevents the cytosolic Na+ rise, inhibits NCLX activity, and impairs SOCE and Orai1 channel current. We show further that SOCE activates a mitochondrial redox transient which is dependent on NCLX and is required for preventing Orai1 inactivation through oxidation of a critical cysteine (Cys195) in the third transmembrane helix of Orai1. We show that mitochondrial targeting of catalase is sufficient to rescue redox transients, SOCE, and Orai1 currents in NCLX-deficient cells. Our findings identify a hitherto unknown NCLX-mediated pathway that coordinates Na+ and Ca2+ signals to effect mitochondrial redox control over SOCE.
Keywords: NCLX; SOCE; CRAC channel; mitochondrial redox; sodium signaling.
© 2017 The Authors.
Figures
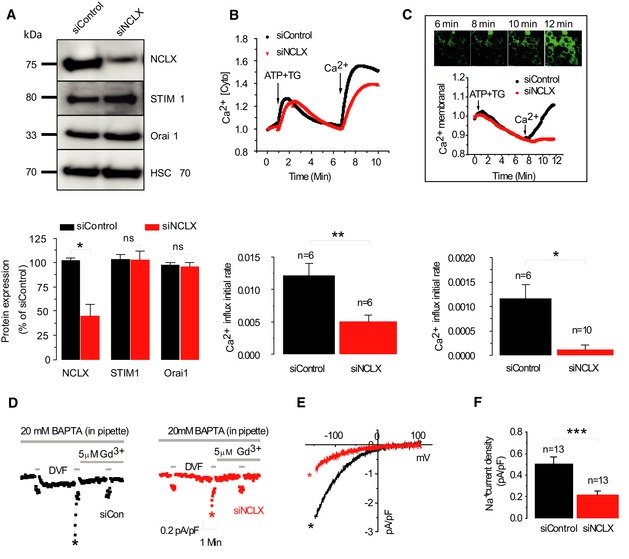
Upper panel: Western blot was performed with 100 μg of protein samples obtained from HEK293T cells transfected with either siControl or siNCLX. Lower panel: Densitometry analysis of immunoblots of siControl‐transfected cells (n = 3) versus siNCLX‐transfected cells (n = 3) representing normalized expression levels (% of control) of NCLX, STIM1 and Orai1.
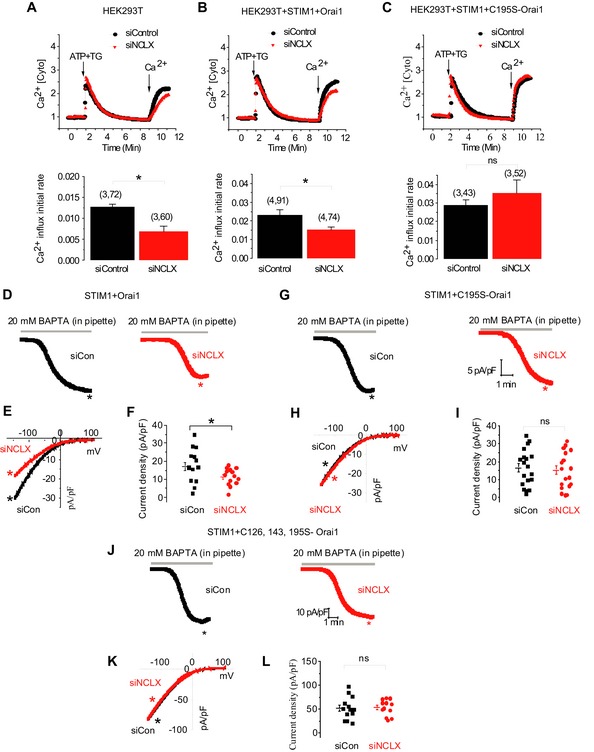
Upper panel: HEK293T cells were transfected with either scrambled siRNA construct (siControl, black) or siNCLX (red) and loaded with Fura‐2. SOCE was triggered by ATP (100 μM) and thapsigargin (TG, 1 μM), and Fura‐2 fluorescence was monitored as described in Materials and Methods. Lowe panel: Averaged rates of Ca2+ rise in siNCLX‐silenced cells from several independent recordings (n = 6) versus siControl‐transfected cells (n = 6).
Upper panel: Fluorescence of the membrane calcium sensor, GCamp5, targeted to the plasma membrane following treatment as described above using confocal microscopy. The scale bar represents 10 μm. Middle panel: Traces of membrane‐localized Ca2+ responses were measured in HEK293T cells co‐transfected with either the siNCLX (red) or siControl (black) and GCamp5‐expressing plasmid. The lower panel shows the averaged rates of membrane‐localized Ca2+ rise either in siControl cells (n = 6) or siNCLX cells (n = 10).
Electrophysiological recordings were performed on the same batch of transfected cells used for Western blot and shown in panel (A). Representative time courses of whole‐cell CRAC currents activated by dialysis of 20 mM BAPTA through the patch pipette and taken at −100 mV from cells transfected either with siControl (black trace) or siNCLX (red trace).
Representative I–V relationships are taken from traces in (D) where indicated by color‐coded asterisks.
Statistical analysis on Na+ CRAC currents measured at −100 mV is shown.
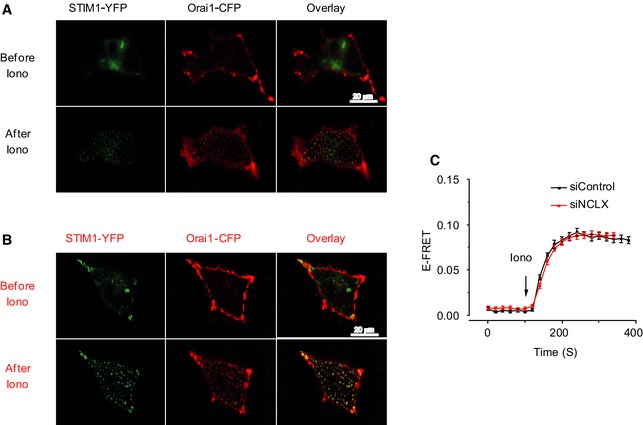
- A, B
HEK293T cells stably expressing Orai1‐CFP and STIM1‐YFP were transfected with either control siRNA (A) or NCLX siRNA (B) and incubated for 72 h. E‐FRET experiments were then performed. The scale bar represents 20 μm.
- C
Silencing of NCLX by siNCLX (red) has no effect on Orai1 and STIM1 colocalization after store depletion induced by applying 2.5 μM ionomycin to the bath solution, compared to siControl (black; means ± SEM).
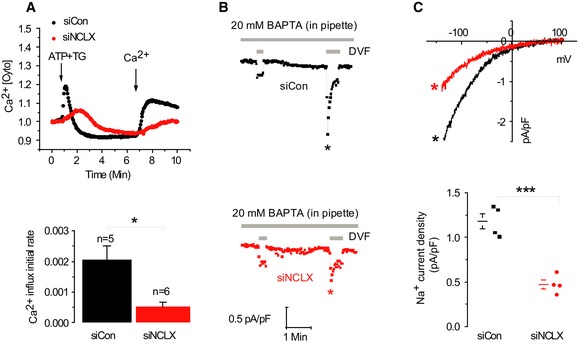
- A
Upper panel: Fluorescence traces of cytosolic Ca2+ responses in VSMC cells. Lower panel: Averaged rates of cytosolic Ca2+ influx in siControl cells (n = 5) and siNCLX cells (n = 6).
- B, C
Electrophysiological CRAC recordings in cells as in (A) using the same protocol used in Fig 2. Statistical analysis on Na+ CRAC currents measured at −100 mV is shown in (C).
- A, B
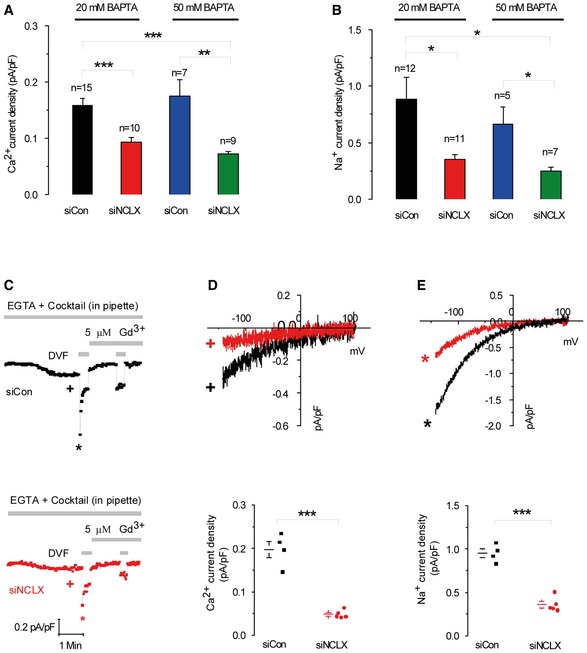
Analysis of Ca2+ (A) and Na+ (B) CRAC currents measured at −100 mV in HEK293T cells transfected with either siControl or siNCLX using the indicated concentrations of BAPTA (20 mM versus 50 mM) in the pipette solution to activate CRAC and buffer cytosolic Ca2+.
- C–E
Electrophysiological CRAC recordings were performed on cells where store depletion was induced by the use of a pipette solution containing low buffering capacity (0.1 mM EGTA) with IP3 (30 μM) and a cocktail to energize the mitochondria whose composition is listed in the Results section. Representative time courses of whole‐cell current development at −100 mV (D, E) and measured in Ca2+‐containing and DVF solutions, respectively, by comparison with siControl. At the end of recordings, 5 μM Gd3+ was used to inhibit CRAC currents. Representative I–V relationships of Ca2+ (D) and Na+ (E) CRAC in cells transfected with siControl or siNCLX are taken from traces in (C) where indicated by color‐coded asterisks. Statistical analysis on Ca2+ and Na+ CRAC currents measured at −100 mV (D, E).
- A, B
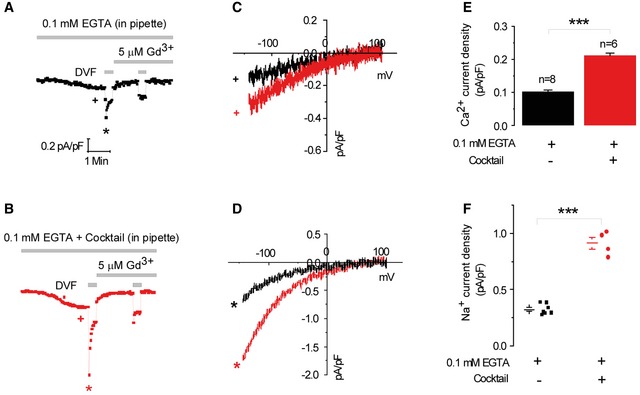
Electrophysiological CRAC recordings were performed on HEK293T cells where store depletion was induced by the use of a pipette solution containing 0.1 mM EGTA with IP3 with (B) and without (A) inclusion of a cocktail to energize the mitochondria. At the end of recordings, 5 μM Gd3+ was used to inhibit CRAC currents.
- C, D
Representative I–V relationships of Ca2+ (C) and Na+ (D) CRAC in are taken from traces in (A) and (B) where indicated by color‐coded asterisks.
- E, F
Statistical analysis on Ca2+ and Na+ CRAC currents measured at −100 mV.
- A, B
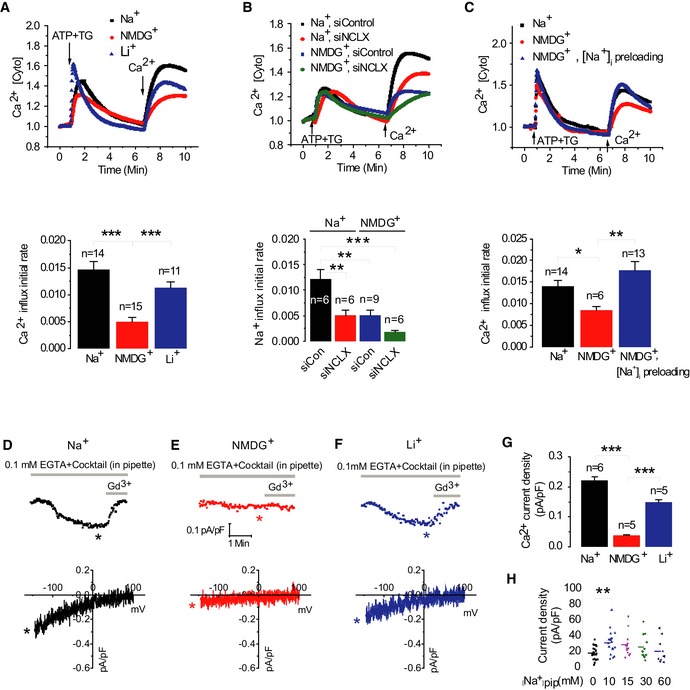
Upper panel: Cytosolic Ca2+, Ca2+ [Cyto], responses monitored in HEK293T cells after store depletion by ATP and TG as in Fig 1B and upon extracellular Na+ ions replacement by either NMDG+ or Li+ ions. Lower panel: Averaged rates of cytosolic Ca2+ influx. The combined effects of NMDG+ together with silencing of NCLX on cytosolic Ca2+ influxes via SOCE are presented in (B).
- C
Upper panel: After being loaded with Fura‐2, intracellular Na+, [Na+]i was preloaded by preincubation for 20 min with ouabain (100 μM) in the presence of Na+, following loading of intracellular Na+ SOCE protocol was applied as in Fig 1 using NMDG+‐containing Ringer. Lower panel: Averaged Ca2+ influx rates in NMDG+ [Na+]i preloaded cells (n = 6), Na+ control cells (n = 14), and cells perfused with NMDG+ alone (n = 13).
- D–H
Representative Ca2+ CRAC current recordings and corresponding color‐matched I–V relationships measured in HEK293T cells with different monovalent cation‐based bath solution is shown in (D) for Na+, in (E) for NMDG+, and in (F) for Li+; 20 mM Ca2+ was included in all bath solutions. Statistical analysis on Ca2+ CRAC currents measured at −100 mV in all three conditions is shown in (G). The effects of cytosolic Na+ concentration on Ca2+ CRAC currents. (H) The whole‐cell patch clamp recordings were performed in HEK293T cells transiently expressing eYFP‐STIM1 and CFP‐Orai1. Scatter plots represent Ca2+ CRAC currents activated by dialysis through the patch pipette of a solution containing 20 mM BAPTA and the different concentration of Na+. Currents were measured at −100 mV and shown as current density pA/pF.
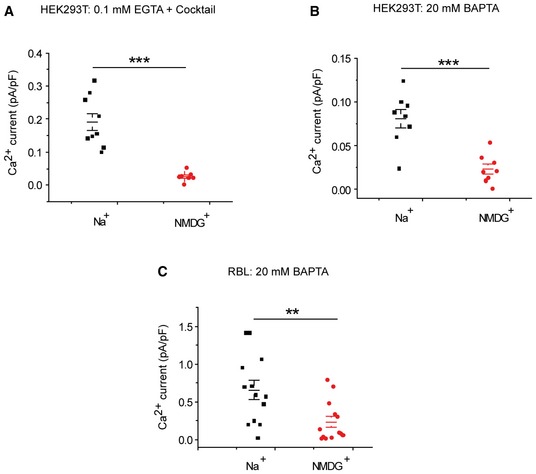
- A–C
Scatter plots representing Ca2+ CRAC currents activated either by dialysis through the patch pipette of a solution containing either 0.1 mM EGTA+IP3 (A) or 20 mM BAPTA (B) in HEK293T cells, or in RBL cells activated by dialysis of a solution containing 20 mM BAPTA (C). P‐values (A‐C) indicate the results of an unpaired student's t‐test.
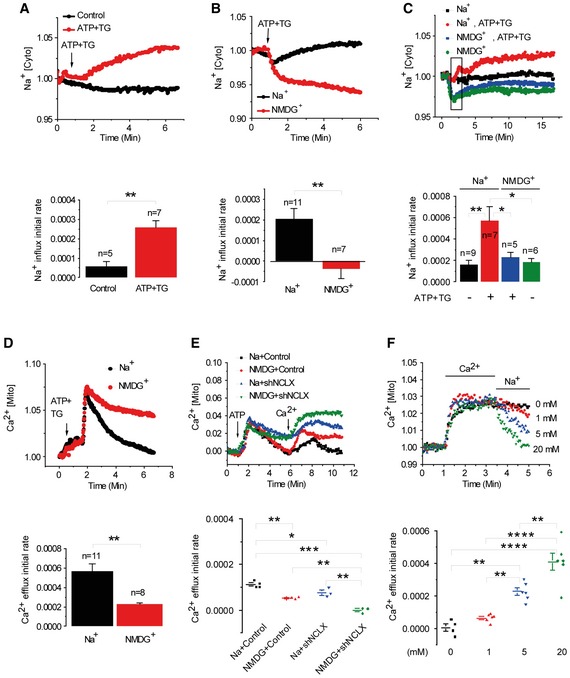
Upper panel: Fluorescence traces of cytosolic Na+ responses, Na+ [Cyto], in ATP‐depleted cells (n = 7) versus control non‐depleted HEK293T cells (n = 5) loaded with Asanta Natrium. Na+ influx averaged rates are shown in the lower panel.
Upper panel: Fluorescence traces of cytosolic Na+. Lower panel: Averaged rates of cytosolic Na+ influx in cells superfused with either Na+‐ (n = 11) or NMDG+ (n = 7)‐containing Ringer's solution.
Upper panel: Traces of mitochondrial Na+ transport in cells preloaded with the mitochondrial Na+ dye, CoroNa red in HEK293T cells. Lower panel: Mitochondrial Na+ influx rates in the presence (n = 7) or absence (n = 5) of Na+.
Upper panel: Traces of mitochondrial Ca2+, Ca2+ [Mito], recorded by monitoring RP‐mt fluorescence following Ca2+‐store depletion in HEK293T cells by ATP and TG as in Fig 1B in the presence of Na+ or NMDG+. Lower panel: Mitochondrial Ca2+ efflux in cells in the presence of NMDG+ (n = 8) compared to Na+ (n = 11).
Upper panel: Traces of Ca2+ [Mito] of cell superfused with ATP alone in Ca2+‐free Ringer followed by superfusion with Ca2+ Ringer with or without Na+ in shControl cells versus shNCLX cells. Lower panel: Rates of traces shown in the upper panel in the presence (n = 4) or absence (n = 3) of Na+ ions in cells transfected with shControl (n = 3) or shNCLX (n = 3).
Upper panel: Cytosolic Na+‐dose dependence of Ca2+ [Mito] efflux. Lower panel: Mitochondrial Ca2+ efflux rates at the indicated concentrations of Na+ [mM] [0 (n = 4); 1, 5 and 20 (n = 6)].
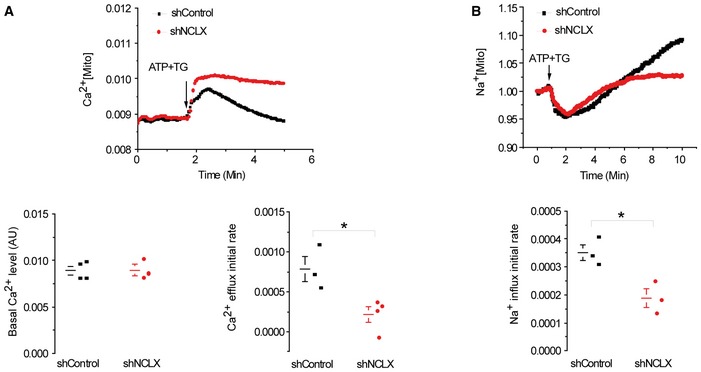
Upper panel: Mitochondrial Ca2+ was monitored in cells expressing the mitochondrial Ca2+ sensor RP‐mt. Mitochondrial Ca2+ transient was evoked by application of ATP and TG, added when indicated. Lower right panel: Rates of mitochondrial Ca2+ efflux derived from the upper panel. Lower left panel: The basal Ca2+ level (arbitrary units, AU) of shControl (n = 3) versus shNCLX (n = 4).
Upper panel: Mitochondrial Na+ uptake in HEK293T cells preloaded with the mitochondrial Na+ sensor, CoroNa red. Na+ signals were evoked by ATP and TG added when indicated. Lower panel: Rates of mitochondrial Na+ influx derived from the upper panel.
- A
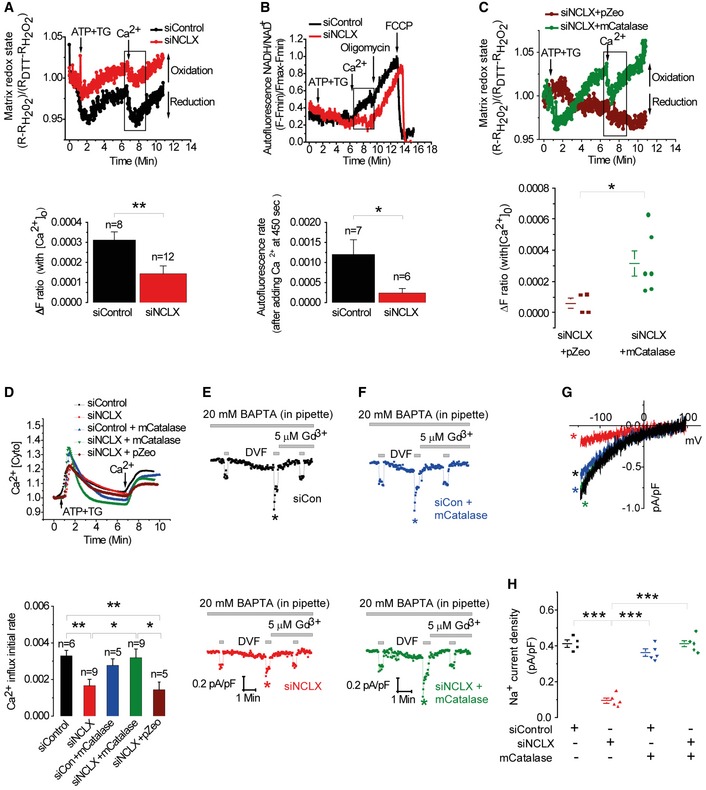
Upper panel: Traces of mitochondrial roGFP1 fluorescence in HEK293T cells co‐transfected with either siControl or siNCLX and Ca2+‐ store depleted as described in Fig 1B. Changes in roGFP1 410/480 ratio fluorescence were determined using minimal and maximal values obtained by application of 100 mM DTT and 10 mM H2O2, respectively, as described in Materials and Methods. Lower panel: ΔF ratio of redox change after Ca2+ restoration to the external milieu in siControl cells (n = 8) compared to siNCLX cells (n = 12).
- B
Upper panel: Effect of NCLX on redox state determined by monitoring NAD(P)H intrinsic fluorescence in HEK293T cells, transfected with either siNCLX or siControl, and treated as described in Fig 1B. Oligomycin or FCCP were used for calibration and added where indicated. Lower panel: Averaged autofluorescence rates after adding Ringer's solution containing Ca2+.
- C
Upper panel: Effect of mitochondrial catalase (pZeoSV2 + mCat) expression. Lower panel: Rates of redox change in siNCLX + pZeoSV2 + (pZeo) empty vector transfected cells (n = 4) compared to siNCLX cells transfected with m‐catalase (n = 6).
- D
Upper panel: Fluorescence traces of cytosolic Ca2+ responses in HEK293T cells co‐transfected with either siControl or siNCLX together with pZeo or m‐catalase. Lower panel: Averaged rates of Ca2+ influx in cells transfected with siNCLX (n = 9) or cells co‐transfected with siNCLX and either m‐catalase (n = 9) or pZeo (n = 5) compared to cells transfected with siControl (n = 6) or co‐transfected with siControl and m‐catalase (n = 5).
- E–H
CRAC electrophysiological recordings in HEK293T cells activated by dialysis of 20 mM BAPTA through the patch pipette under the same conditions of transfection used in (B). I–V relationships are shown in (G) and statistical analysis on Na+ CRAC currents measured at −100 mV is shown in (H). m‐Catalase is routinely co‐transfected with a plasmid encoding eGFP for identification of transfected cells.
- A
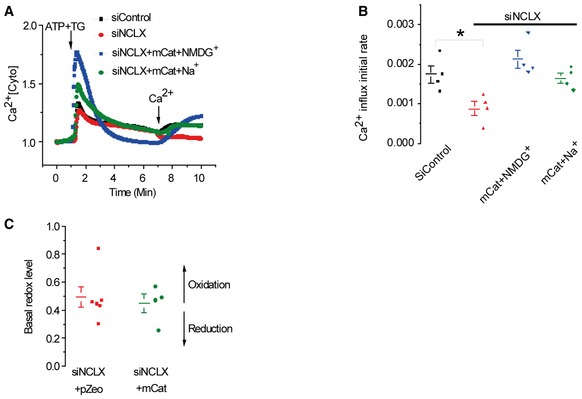
HEK293T cells were transfected with either siControl or siNCLX with or without m‐catalase. Cytosolic Ca2+ responses were monitored in HEK293T cells after store depletion by ATP and TG as in Fig 1B in the presence or absence of Na+ ions.
- B, C
Averaged rates (means ± SEM) of Ca2+ influx in either siControl cells (n = 4), siNCLX (n = 4), siNCLX+m‐catalase with Ringer containing Na+ (n = 4), or NMDG+ (n = 4) are shown in (B). P‐values indicate the results of a one‐way ANOVA test followed by Tukey post hoc analysis. *P < 0.05. The basal redox levels of siNCLX+pZeo cells (n = 6) versus siNCLX+m‐catalase (n = 4) are shown in (C).
- A–C
HEK293T cells were transfected with either control siRNA (black) or NCLX siRNA (red) and incubated for 72 h (A). Cells were then transfected again with siRNA along with either plasmids, STIM1 and Orai1 (B), or plasmids, STIM1 and C195S‐Orai1 (C), and incubated for another 24 h. The numbers in bar graphs (i.e., (x, y)) represent the total number of independent recording (x) and the total number of cells from all recordings (y). SOCE was triggered as described in Fig 1B, and Fura‐2 fluorescence was monitored as described in Materials and Methods. Averaged rates of Ca2+ influx were shown in the lower panels.
- D–L
Representative time course traces (D and G) of Orai1‐ and Orai1‐C195S‐mediated CRAC currents activated by dialysis through the patch pipette of a solution containing 20 mM BAPTA and recorded in a bath solution containing 20 mM Ca2+. I–V curves are shown in (E and H) which are taken from traces as indicated by color‐coded asterisks. Scatter blots (F and I) depict maximal CRAC currents values taken at −100 mV and represented as current densities (pA/pF). Similar CRAC current recordings from HEK293T cells expressing STIM1 and C126S/C143S/C195S‐Orai1 triple mutant are shown in (J–L).
References
-
- Akerboom J, Chen TW, Wardill TJ, Tian L, Marvin JS, Mutlu S, Calderon NC, Esposti F, Borghuis BG, Sun XR, Gordus A, Orger MB, Portugues R, Engert F, Macklin JJ, Filosa A, Aggarwal A, Kerr RA, Takagi R, Kracun S et al (2012) Optimization of a GCaMP calcium indicator for neural activity imaging. J Neurosci 32: 13819–13840 - PMC - PubMed
-
- Alvarez J, Montero M, Garcia‐Sancho J (1999) Subcellular Ca(2+) dynamics. News Physiol Sci 14: 161–168 - PubMed
-
- Ardon F, Rodriguez‐Miranda E, Beltran C, Hernandez‐Cruz A, Darszon A (2009) Mitochondrial inhibitors activate influx of external Ca(2+) in sea urchin sperm. Biochim Biophys Acta 1787: 15–24 - PubMed
-
- Baron S, Caplanusi A, van de Ven M, Radu M, Despa S, Lambrichts I, Ameloot M, Steels P, Smets I (2005) Role of mitochondrial Na+ concentration, measured by CoroNa red, in the protection of metabolically inhibited MDCK cells. J Am Soc Nephrol 16: 3490–3497 - PubMed
MeSH terms
Substances
Grants and funding
LinkOut - more resources
Full Text Sources
Other Literature Sources
Molecular Biology Databases
Research Materials
Miscellaneous
