. 2017 Feb 24;355(6327):820-826.
doi: 10.1126/science.aal2014. Epub 2017 Feb 20.

Predicting human olfactory perception from chemical features of odor molecules

Collaborators, Affiliations

Predicting human olfactory perception from chemical features of odor molecules

Andreas Keller et al. Science. .

Abstract

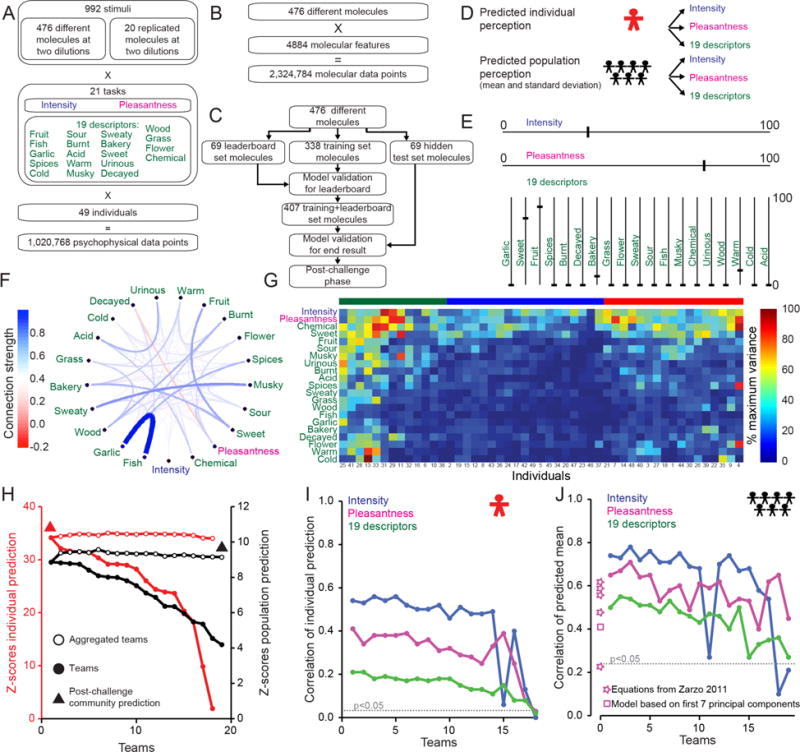
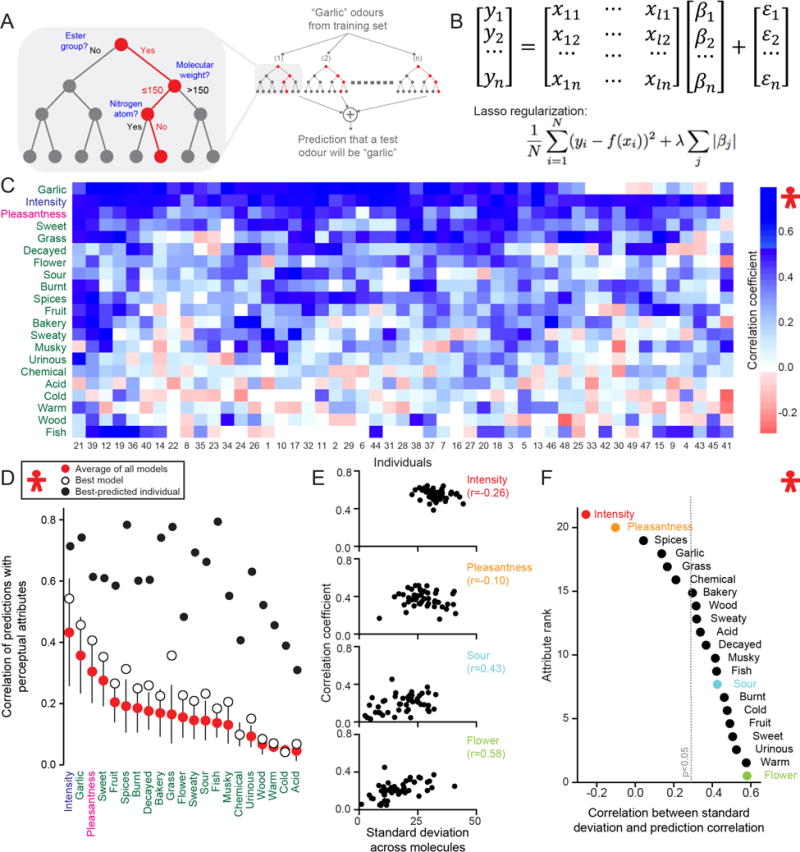
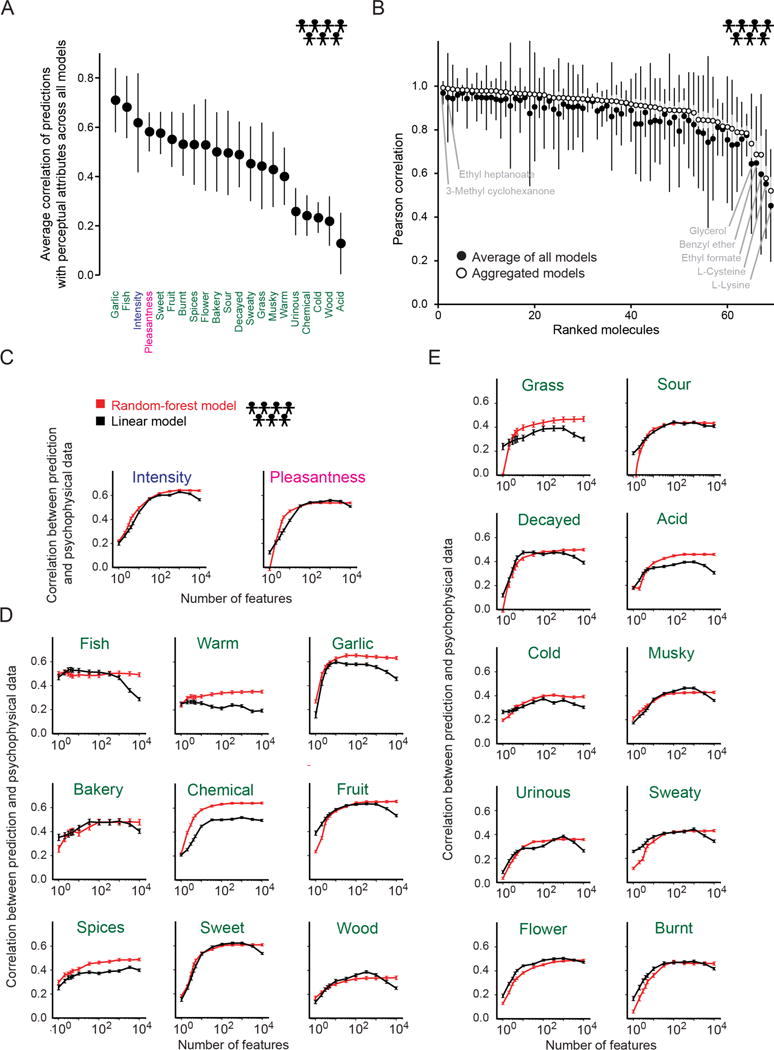
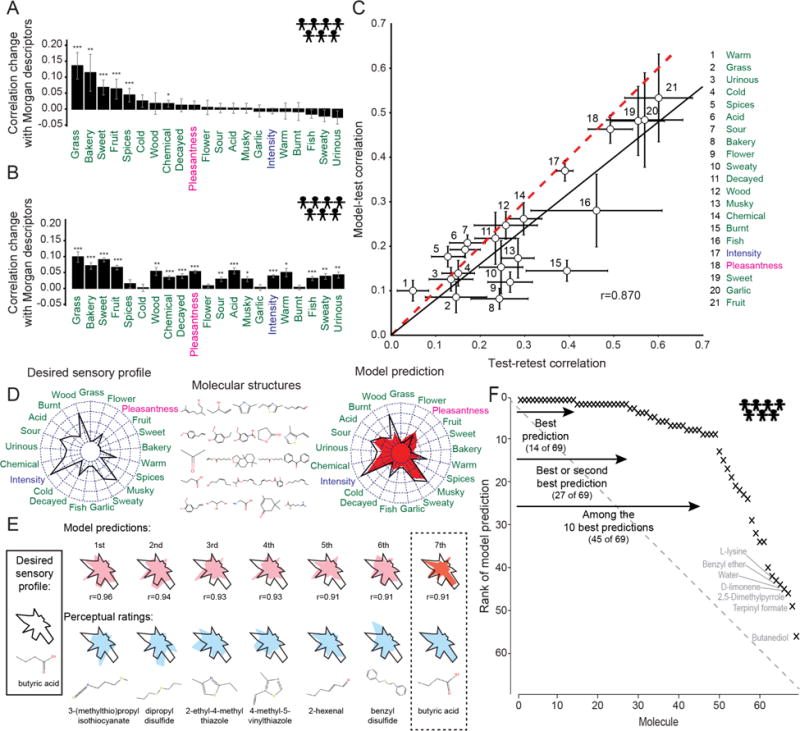
It is still not possible to predict whether a given molecule will have a perceived odor or what olfactory percept it will produce. We therefore organized the crowd-sourced DREAM Olfaction Prediction Challenge. Using a large olfactory psychophysical data set, teams developed machine-learning algorithms to predict sensory attributes of molecules based on their chemoinformatic features. The resulting models accurately predicted odor intensity and pleasantness and also successfully predicted 8 among 19 rated semantic descriptors ("garlic," "fish," "sweet," "fruit," "burnt," "spices," "flower," and "sour"). Regularized linear models performed nearly as well as random forest-based ones, with a predictive accuracy that closely approaches a key theoretical limit. These models help to predict the perceptual qualities of virtually any molecule with high accuracy and also reverse-engineer the smell of a molecule.


Figures

Fig. 1
Fig. 1. DREAM Olfaction Prediction Challenge
(A) Psychophysical data. (B) Chemoinformatic data. (C) DREAM challenge flowchart. (D) Individual and population challenges. (E) Hypothetical example of psychophysical profile of a stimulus. (F) Connection strength between 21 attributes for all 476 molecules. Width and color of the lines show the normalized strength of the edge. (G) Perceptual variance of 21 attributes across 49 individuals for all 476 molecules at both concentrations sorted by Euclidean distance. Three clusters are indicated by green, blue, and red bars above the matrix. (H) Model Z-scores, best performers at left. (I–J) Correlations of individual (I) or population (J) perception prediction sorted by team rank. The dotted line represents the p < 0.05 significance threshold with respect to random predictions. The performance of four equations for pleasantness prediction suggested by Zarzo (10) [from top to bottom: equations (10, 9, 11, 7, 12)] and of a linear model based on the first seven principal components inspired by Khan et al. (8) are shown.
Fig. 2
Fig. 2. Predictions of individual perception
(A) Example of a random-forest algorithm that utilizes a subset of molecules from the training set to match a semantic descriptor (e.g “garlic”) to a subset of molecular features. (B) Example of a regularized linear model. For each perceptual attribute yi a linear model utilizes molecular features xij weighted by βi to predict the psychophysical data of 69 hidden test set molecules, with sparsity enforced by the magnitude of λ. (C) Correlation values of best-performer model across 69 hidden test set molecules, sorted by Euclidean distance across 21 perceptual attributes and 49 individuals. (D) Correlation values for the average of all models (red dots, mean ± s.d.), best-performing model (white dots), and best-predicted individual (black dots), sorted by the average of all models. (E) Prediction correlation of the best-performing random-forest model plotted against measured standard deviation of each subject’s perception across 69 hidden test set molecules for the four indicated attributes. Each dot represents one of 49 individuals. (F) Correlation values between prediction correlation and measured standard deviation for 21 perceptual attributes across 49 individuals, color coded as in E. The dotted line represents the p < 0.05 significance threshold obtained from shuffling individuals.
Fig. 3
Fig. 3. Predictions of population perception
(A), Average of correlation of population predictions. Error bars indicate standard deviations calculated across models. (B) Ranked prediction correlation for 69 hidden test set molecules produced by aggregated models (open black circles, standard deviation indicated with grey bars) and the average of all models (solid black dots, standard deviation indicated with black bars). (C–E) Prediction correlation with increasing number of Dragon features using random-forest (red) or linear (black) models. Attributes are ordered from top to bottom and left to right by the number of features required to obtain 80% of the maximum prediction correlation using the random-forest model. Plotted are intensity and pleasantness (C), and attributes that required six or fewer (D) or more than six features (E). The combined training+leaderboard set of 407 molecules was randomly partitioned 250 times to obtain error bars for both types of models.
Fig. 4
Fig. 4. Quality of predictions
(A–B) Community phase predictions for random-forest (A) and linear (B) models using both Morgan and Dragon features for population prediction. The training set was randomly partitioned 250 times to obtain error bars *p < 0.05, **p < 0.01, ***p < 0.001 corrected for multiple comparisons (FDR). (C) Comparison between correlation coefficients for model predictions and for test-retest for individual perceptual attributes using the aggregated predictions from linear and random-forest models. Error bars reflect standard error obtained from jackknife resampling of the retested molecules. Linear regression of the model-test correlation coefficients against the test-retest correlation coefficients yields a slope of 0.80 ± 0.02 and a correlation of r = 0.870 (black line) compared to a theoretically optimal model (perfect prediction given intra-individual variability, dashed red line). Only the model-test correlation coefficient for “burnt” (15) was statistically distinguishable from the corresponding test-retest coefficient (p < 0.05 with FDR correction). (D) Schematic for reverse-engineering a desired sensory profile from molecular features. The model was presented with the experimental sensory profile of a molecule (spider plot, left) and tasked with searching through 69 hidden test set molecules (middle) to find the best match (right, model prediction in red). Spider plots represent perceptual data for all 21 attributes, with the lowest rating at the center and highest at the outside of the circle. (E) Example where the model selected a molecule with a sensory profile 7th closest to the target, butyric acid. (F) Population prediction quality for the 69 molecules in the hidden test set when all 19 models are aggregated. The overall area under the curve (AUC) for the prediction is 0.83, compared to 0.5 for a random model (grey dotted line) and 1.0 for a perfect model.

References

    1. Boelens H. Structure-activity relationships in chemoreception by human olfaction. Trends Pharmacol Sci. 1983;4:421–426.
    1. Sell C. Structure-odor relationships: On the unpredictability of odor. Angew Chem Int Edit. 2006;45:6254–6261. - PubMed
    1. Koulakov AA, Kolterman BE, Enikolopov AG, Rinberg D. In search of the structure of human olfactory space. Frontiers in systems neuroscience. 2011;5:65. - PMC - PubMed
    1. Castro JB, Ramanathan A, Chennubhotla CS. Categorical dimensions of human odor descriptor space revealed by non-negative matrix factorization. PLoS ONE. 2013;8:e73289. - PMC - PubMed
    1. Laska M, Teubner P. Olfactory discrimination ability for homologous series of aliphatic alcohols and aldehydes. Chem Senses. 1999;24:263–270. - PubMed

Publication types