. 2017 Mar 22;37(12):3311-3330.
doi: 10.1523/JNEUROSCI.2969-16.2017. Epub 2017 Feb 20.

Enhanced Sensitivity to Hyperpolarizing Inhibition in Mesoaccumbal Relative to Nigrostriatal Dopamine Neuron Subpopulations

Affiliations

Enhanced Sensitivity to Hyperpolarizing Inhibition in Mesoaccumbal Relative to Nigrostriatal Dopamine Neuron Subpopulations

Rahilla A Tarfa et al. J Neurosci. .

Abstract

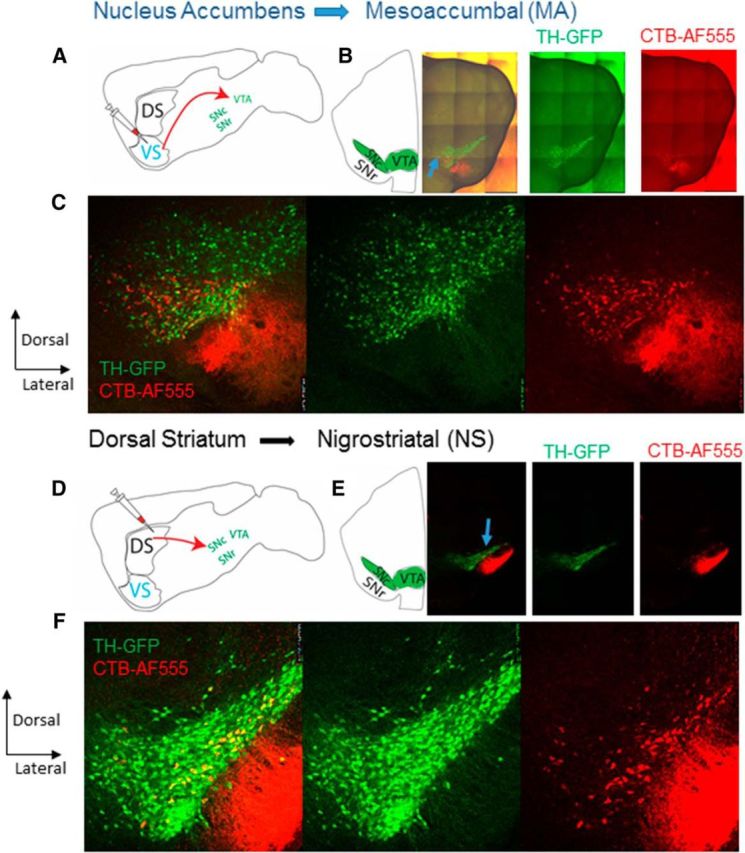
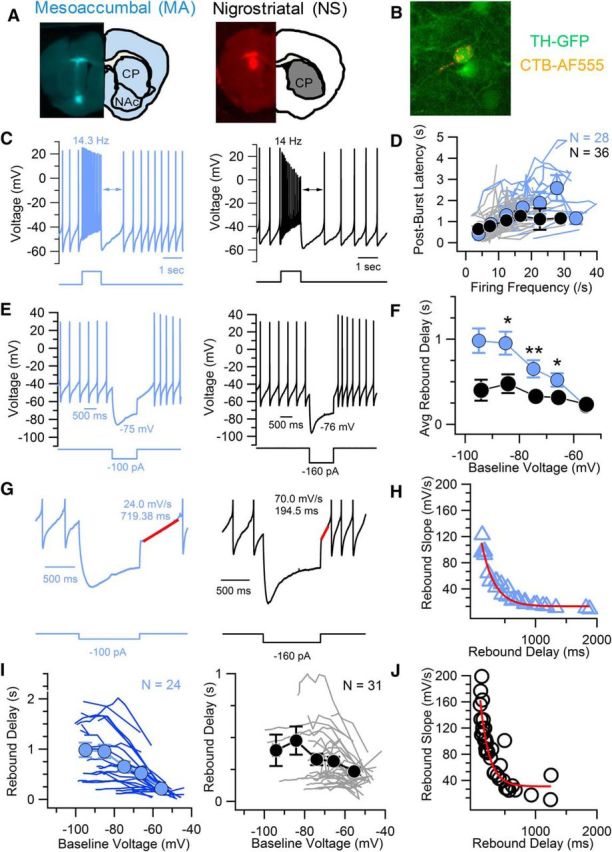
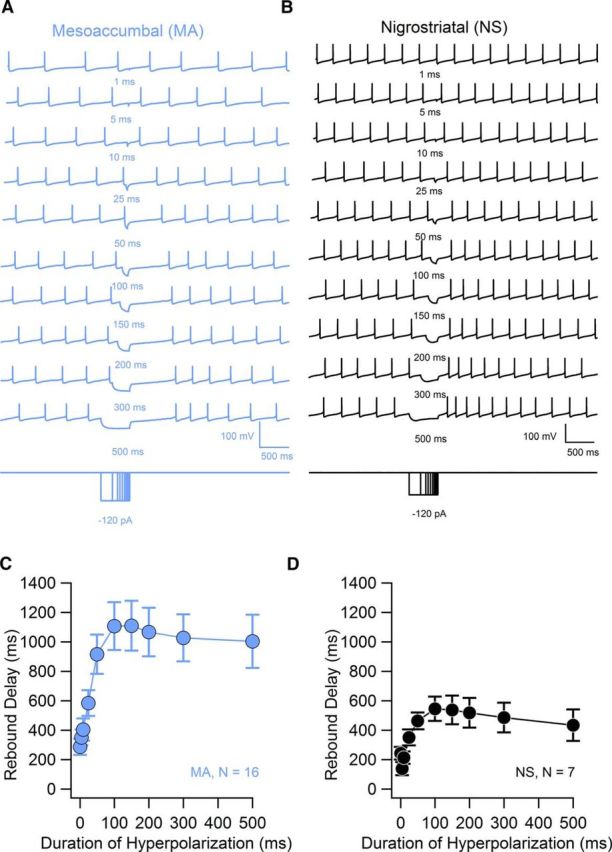
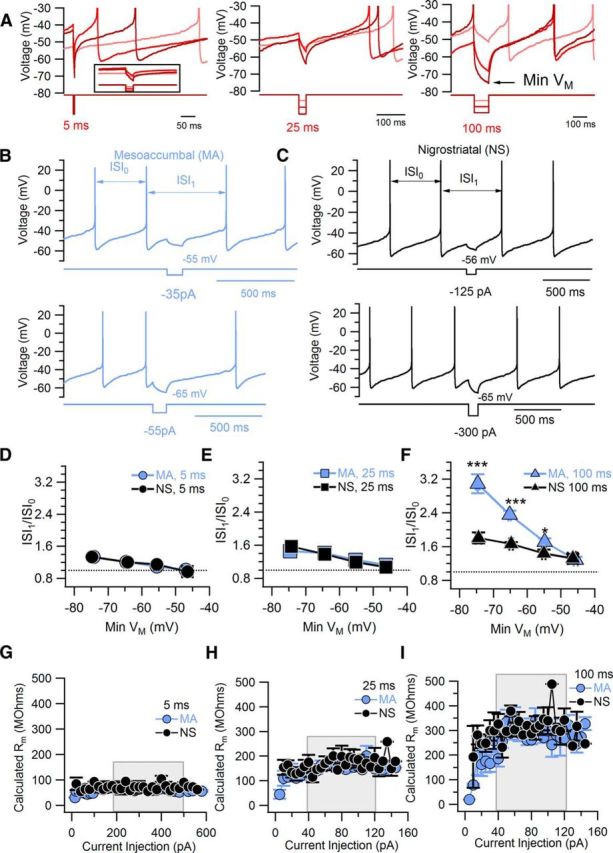
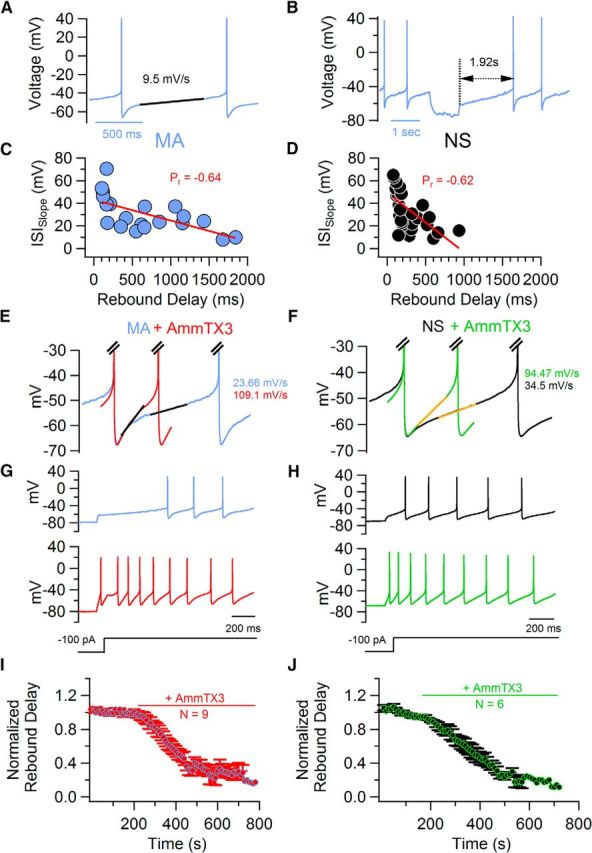
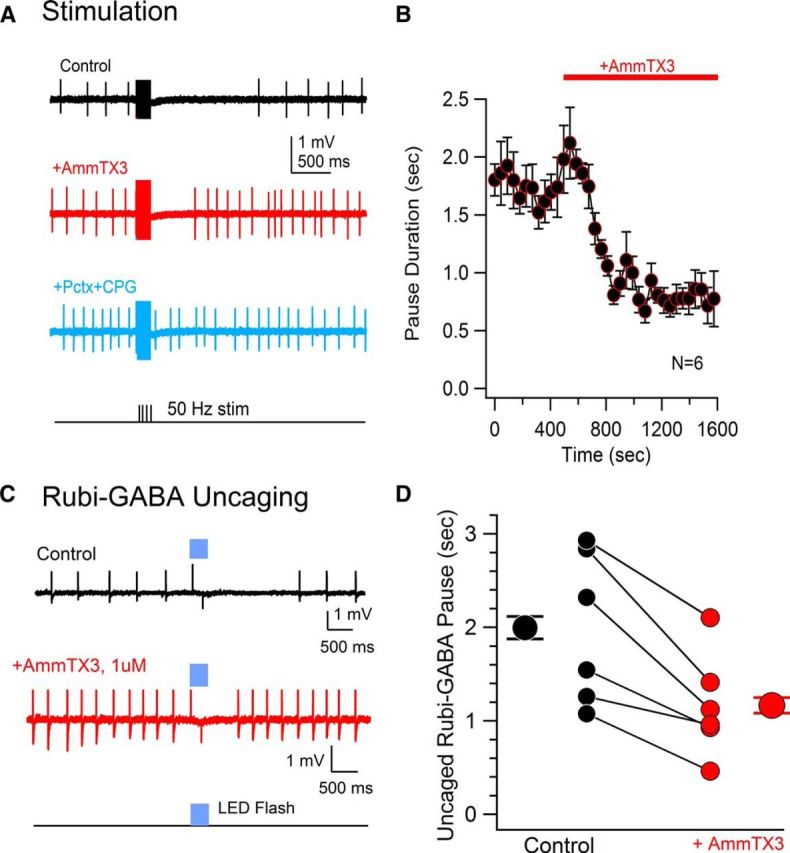
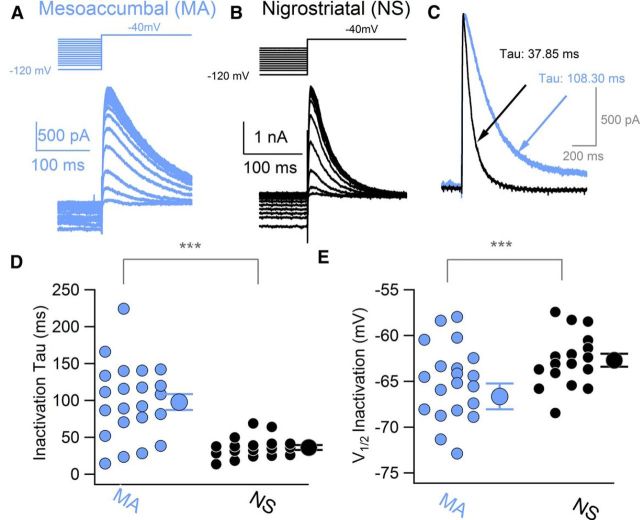
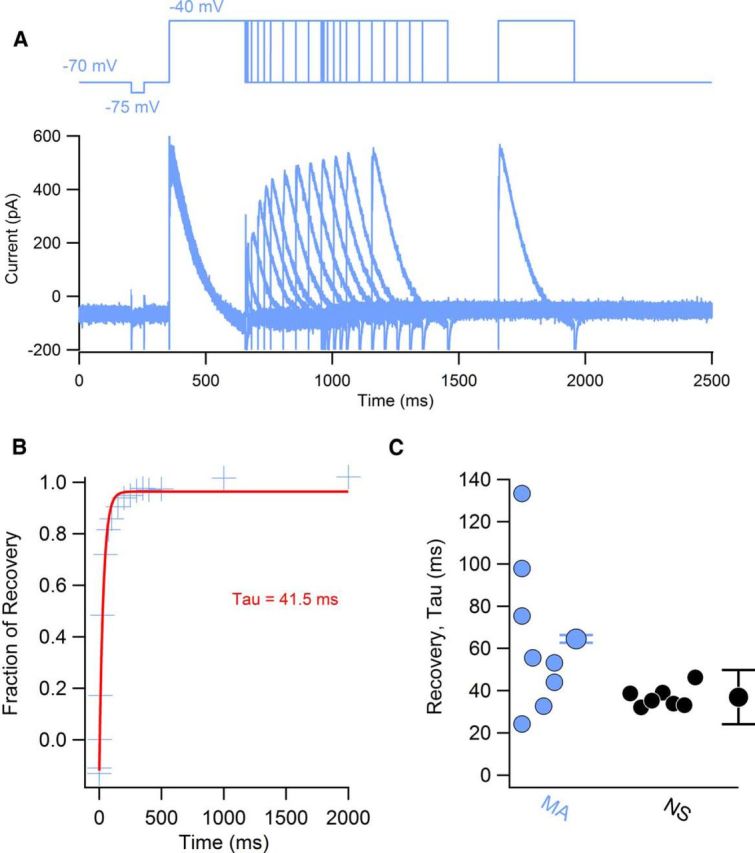
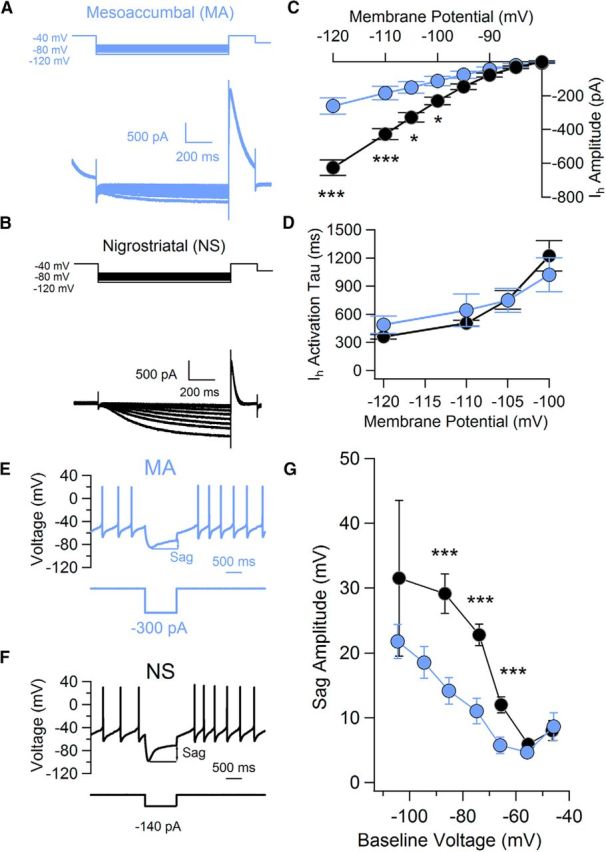
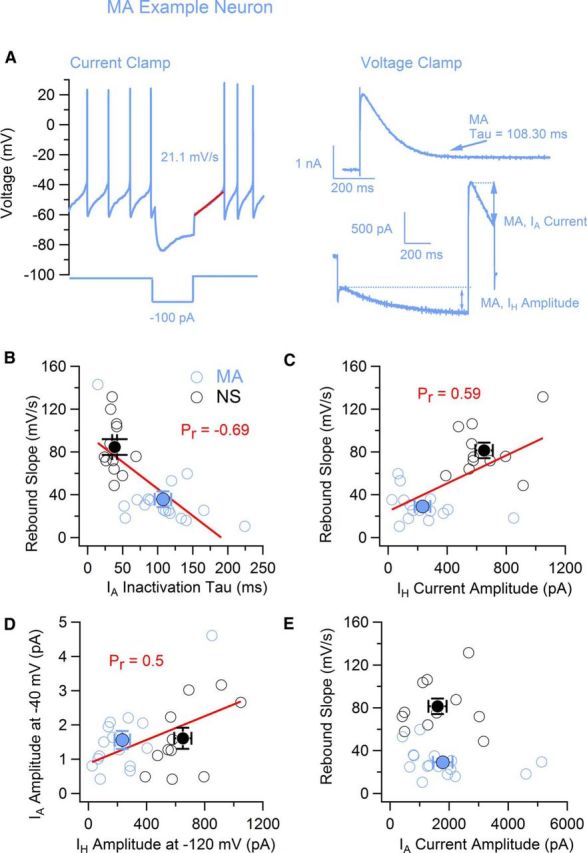
Midbrain dopamine neurons recorded in vivo pause their firing in response to reward omission and aversive stimuli. While the initiation of pauses typically involves synaptic or modulatory input, intrinsic membrane properties may also enhance or limit hyperpolarization, raising the question of how intrinsic conductances shape pauses in dopamine neurons. Using retrograde labeling and electrophysiological techniques combined with computational modeling, we examined the intrinsic conductances that shape pauses evoked by current injections and synaptic stimulation in subpopulations of dopamine neurons grouped according to their axonal projections to the nucleus accumbens or dorsal striatum in mice. Testing across a range of conditions and pulse durations, we found that mesoaccumbal and nigrostriatal neurons differ substantially in rebound properties with mesoaccumbal neurons displaying significantly longer delays to spiking following hyperpolarization. The underlying mechanism involves an inactivating potassium (IA) current with decay time constants of up to 225 ms, and small-amplitude hyperpolarization-activated currents (IH), characteristics that were most often observed in mesoaccumbal neurons. Pharmacological block of IA completely abolished rebound delays and, importantly, shortened synaptically evoked inhibitory pauses, thereby demonstrating the involvement of A-type potassium channels in prolonging pauses evoked by GABAergic inhibition. Therefore, these results show that mesoaccumbal and nigrostriatal neurons display differential responses to hyperpolarizing inhibitory stimuli that favors a higher sensitivity to inhibition in mesoaccumbal neurons. These findings may explain, in part, observations from in vivo experiments that ventral tegmental area neurons tend to exhibit longer aversive pauses relative to SNc neurons.SIGNIFICANCE STATEMENT Our study examines rebound, postburst, and synaptically evoked inhibitory pauses in subpopulations of midbrain dopamine neurons. We show that pauses in dopamine neuron firing, evoked by either stimulation of GABAergic inputs or hyperpolarizing current injections, are enhanced by a subclass of potassium conductances that are recruited at voltages below spike threshold. Importantly, A-type potassium currents recorded in mesoaccumbal neurons displayed substantially slower inactivation kinetics, which, combined with weaker expression of hyperpolarization-activated currents, lengthened hyperpolarization-induced delays in spiking relative to nigrostriatal neurons. These results suggest that input integration differs among dopamine neurons favoring higher sensitivity to inhibition in mesoaccumbal neurons and may partially explain in vivo observations that ventral tegmental area neurons exhibit longer aversive pauses relative to SNc neurons.

Keywords: action potential; dopamine; mesoaccumbal; nigrostriatal; potassium channel.


Figures

Figure 1.
Figure 1.
Retrograde labeling of mesoaccumbal and nigrostriatal dopamine neurons. A, Schematic of a sagittal section of a mouse brain along with mesoaccumbal projection. CTB conjugated to Alexa555 was injected into nucleus accumbens to retrogradely label dopamine neurons in the VTA. B, Schematic (left) and 10× tiled image of a coronal section of midbrain slice (right) in TH-GFP mouse depicting mesoaccumbal subpopulations. GFP-positive TH cells are show in green, and CTB-positive NAc-projecting neurons are shown in red. C, Image of VTA and SNc demonstrating the mesoaccumbal subpopulation. D, Schematic of injection site of CTB in the dorsal striatum. E, Schematic (left) and 10× tiled image (right) of a coronal section of midbrain slice in same TH-GFP mouse depicting nigrostriatal subpopulation. F, Image of the VTA (medial) and SNc (lateral). DS, Dorsal striatum; VS, ventral striatum.
Figure 2.
Figure 2.
Comparison of postburst pauses and rebound delays in mesoaccumbal and nigrostriatal dopamine subpopulations. A, Injection site of CTB in the nucleus accumbens (left) and dorsal striatum (right) of a TH-GFP mouse. B, Example of TH-GFP+ dopamine neuron retrogradely labeled with CTB-AF555 injected into nucleus accumbens. C, Example traces in which spontaneous firing recorded in mesoaccumbal (blue) and nigrostriatal (black) neurons has been interrupted with a depolarizing current injection. Arrows indicate postburst latency. D, Plot of averaged binned postburst latency versus burst frequency in mesoaccumbal and nigrostriatal dopamine neurons. Closed symbols represent the mean ± SEM. Lines represent data from individual neurons (blue, mesoaccumbal; gray, nigrostriatal). E, Example traces of rebound delays from mesoaccumbal (blue) and nigrostriatal (black) in response to a 1 s hyperpolarizing current injection. Baseline voltage values are indicated. F, Plot of averaged binned maximal rebound delays versus baseline voltage. G, Examples of rebound delays shown on an expanded scale for clarity showing linear fit of the rebound delay (red lines) as a measure of the rebound slope. H, Plot of rebound slope versus rebound delay in mesoaccumbal dopamine neurons (triangles) measured from a baseline voltage of ∼−75 mV. The red line indicates exponential fit. I, Summary of rebound pause duration in mesoaccumbal neurons (left). Dark blue lines show individual neurons (N = 24), and light blue circles show 5 mV binned averages ± SEM. A summary of nigrostriatal neurons is shown on the right. Gray lines show individual neurons (N = 31), and black circles and lines show 5 mV binned averages ± SEM. J, Same plot as in H but in nigrostriatal dopamine neurons (circles). The red line indicated exponential fit. Asterisks indicate a P value <0.05.
Figure 3.
Figure 3.
Time-dependent development of the rebound delay. A, Example of rebound pauses in a mesoaccumbal neuron in response to 120 pA hyperpolarizing current injection delivered for different durations. B, Same as in A for an example nigrostriatal neuron. C, D, Summary plots of rebound delays versus the duration of hyperpolarization in mesoaccumbal neurons (light blue symbols) and nigrostriatal neurons (black symbols). Data are plotted as averages ± SEM.
Figure 4.
Figure 4.
Effect of short duration hyperpolarizations in mesoaccumbal and nigrostriatal dopamine neurons. A, Example traces from a single mesoaccumbal dopamine neurons in which spontaneous firing was interrupted for 5 ms by a family of 20 pA current injection steps (left). The inset shows a zoomed in image of the 5 ms hyperpolarization. Center, Same example neuron to the left, depicting the 25 ms hyperpolarization, carried out in 5 pA steps. Right, Same example neuron depicting the 100 ms hyperpolarization done in 5 pA steps. All neurons were injected with a series of current injection steps for 5, 25, and 100 ms in the aforementioned current injection amplitudes, interleaved with the neuron's spontaneous firing. B, Example traces from a single mesoaccumbal dopamine neuron in which spontaneous firing was interrupted by separate 100 ms current injections. Top trace, A −35 pA injection hyperpolarized the membrane potential to a baseline voltage of −55 mV, resulting in an ISI1 of 512.24 ms compared to an ISI0 of 330.4 ms. Bottom trace, A −55 pA injection hyperpolarized the membrane potential to a baseline voltage of −65 mV, resulting in an ISI1 of 668.94 ms compared to an ISI0 of 320.66 ms. C, Same as in A for an example nigrostriatal dopamine neuron. Spontaneous firing was interrupted by a −125 pA (top) and a −300 pA (bottom) current injection, which hyperpolarized the cell to a baseline voltage of −56 mV and −65 mV. In the top trace, ISI1 = 647.88 ms and ISI0 = 540.06 ms. In the bottom trace, ISI1 = 663.12 ms and ISI0 = 457.70 ms. D–F, Voltage dependence of the ISI1/ISI0 ratio in response to 5 ms (D), 25 ms (E), and 100 ms (F) hyperpolarizations in mesoaccumbal (light blue symbols) and nigrostriatal (black symbols) subpopulations. Asterisks indicate that mesoaccumbal and nigrostriatal cells display significant differences in delay responses to 100 ms hyperpolarizations starting at baseline values of – 55 mV. G–I, Plots of the average calculated resistance versus the current injection amplitude across all neurons within the mesoaccumbal (light blue symbols) and nigrostriatal (black symbols) subpopulations for 5 ms (G), 25 ms (H), and 100 ms (I) hyperpolarizations.
Figure 5.
Figure 5.
AmmTX3, a specific blocker of Kv4 subunits, abolishes rebound pauses of all durations in mesoaccumbal and nigrostriatal dopamine neurons. A, Example of an averaged interspike interval from a spontaneously active mesoaccumbal dopamine neuron. The black line indicates linear fit to slope. B, Rebound delay from the same neuron. C, D, Plot of the relationship between the slope of the interspike voltage trajectory and the rebound delay. E, Example traces from a mesoaccumbal neuron demonstrating effect of 1M AmmTX3 on interspike voltage trajectory during pacemaking. The interspike interval slope increased from 23.66 to 109.1 mV/s in the presence of 1M of AmmTX3. F, Effect of AmmTX3 on interspike voltage trajectory of a nigrostriatal neuron. The interspike voltage increased from 34.5 to 94.47 mV/s in AmmTX3. G, H, Traces demonstrating effect of AmmTX3 in reducing rebound pause in mesoaccumbal (E) and nigrostriatal (F) dopamine neurons. I, J, Averaged time course of normalized rebound delays under control conditions and following application of 1M AmmTX3 in mesoaccumbal (orange symbols; I) and nigrostriatal dopamine neurons (black symbols; J). Data are shown as averages ± SEM.
Figure 6.
Figure 6.
Pauses evoked by inhibitory synaptic stimulation and GABA uncaging reduced by AmmTX3 block of A-type potassium currents. A, Effect of AmmTX3 on synaptically evoked pauses. Cell-attached recording of a pause in a VTA neuron evoked by 50 Hz stimulation for 300 ms under control conditions (black trace), in AmmTX3 (red trace), and in the presence of picrotoxin and CGP55845 (blue trace). Spikes are cropped. B, Averaged time course of inhibitory pause under control conditions and following bath application of AmmTX3 for 6 VTA neurons. C, Effect of AmmTX3 on inhibitory pauses evoked by RuBi-GABA uncaging. Cell-attached recording of a pause under control conditions (black trace) in AmmTX3 (red trace). Spikes are cropped. D, Summary plot of the effect of AmmTX3 block on uncaging-evoked pause in six VTA neurons.
Figure 7.
Figure 7.
Biophysical properties of A-type potassium currents midbrain dopamine neurons. A, B, Voltage protocol (top) and example traces (bottom) of A-type potassium currents in mesoaccumbal (light blue traces; A) and nigrostriatal (black traces; B) dopamine neurons evoked by a family of voltage steps to −40 mV stepping from a range of voltages between −120 and −50 mV. C, Comparison of inactivation kinetics of A-type potassium currents evoked by steps from −90 to −40 mV. Inactivation time constants were determined from fits to single exponential functions. D, Summary of inactivation voltage dependence of half inactivation in mesoaccumbal (light blue symbols) and nigrostriatal (black symbols) dopamine neurons. E, Summary of inactivation time constant measured from steps to −40 mV in mesoaccumbal and nigrostriatal dopamine neurons. ***, P < 0.05.
Figure 8.
Figure 8.
Recovery from inactivation of A-type potassium currents in mesoaccumbal and mesostriatal dopamine neurons. A, Voltage protocol (top) and example traces (bottom) testing recovery from inactivation following a 250 ms conditioning step from −70 to −40 mV. Recovery was tested over a range of intervals including 1–2000 ms. B, Plot of fraction of recovery for data shown in A. Current from test pulses were normalized to current evoked by conditioning pulse. Fit to a single exponential function is shown in red. C, Summary of recovery time constants for A-type currents recorded in mesoaccumbal and nigrostriatal neurons.
Figure 9.
Figure 9.
Biophysical properties of H-current in mesoaccumbal and nigrostriatal subpopulations. A, B, Voltage protocols (top) and representative family of hyperpolarization-activated currents (IH; bottom) evoked by a range of steps from −120 to −80 mV, recorded in a mesoaccumbal (A) and nigrostriatal (B) dopamine neurons. C, Summary current–voltage relationship plots for H currents recorded from mesoaccumbal (light blue) and nigrostriatal (black) dopamine subpopulations. D, Summary of time constant of activation for H currents measured in mesoaccumbal and nigrostriatal dopamine subpopulations. Time constant of activation values were obtained by fitting an exponential to the raw current traces of H currents. E, F, Example traces displaying depolarizing sag potentials in response to hyperpolarizing current injections in mesoaccumbal (E) and nigrostriatal (F) neurons. Sag potentials were measured as the difference between the peak minimum and baseline voltages. G, Summary plot of sag amplitudes measured in mesoaccumbal and nigrostriatal dopamine neurons. ***, P < 0.05.
Figure 10.
Figure 10.
Correlation of inactivation kinetics of IA and the amplitude of IH with rebound properties in mesoaccumbal and nigrostrial dopamine neurons. A, Left, Example of rebound delay in mesoaccumbal (MA) dopamine neuron. The linear fit to determine the rebound slope is shown in red. Right, Voltage-clamp-recorded IA (top) and IH (bottom) currents from same neuron shown in A. A-type potassium currents were elicited by a step to −40 mV (top), and IH currents were measured from a step to −120 mV. B, Plot of rebound slope versus IA inactivation time constant. Data from mesoaccumbal neurons are shown with light blue open symbols, and those from nigrostriatal (NS) neurons are shown with black open symbols. The linear fit to the data is shown in red along with Pr values. Light blue and black closed symbols are average ± SEM. C, Plot of rebound slope versus IH current amplitude. D, Plot of IA amplitude versus IH amplitude. E, Plot of rebound slope versus IA current amplitude. Note that the linear fit is not shown due to lack of correlation (Pr = −0.13).
Figure 11.
Figure 11.
Computational model testing the relative contribution of IA, IH, and IT to the rebound delay and GABAA-evoked pauses in firing. A, Traces of simulated A-type potassium currents covering the experimentally observed range of inactivation time constants from 25 to 200 ms. IA currents were elicited by steps from −90 to −30 mV. Important to note is that the model conductances were adjusted to offset changes in peak current amplitudes resulting from alteration of decay time constants. B, Rebound delays increase in duration in models with slower IA inactivation kinetics. C, Voltage dependence of the rebound delay plotted in a model for IA time constant of inactivation ranging from 25 to 200 ms. Note the increase in the rebound delay with increasing voltage and with increase in the inactivation tau of IA. D, GABAA evoked pauses increase in duration in models with slower IA inactivation kinetics. Simulated synaptic input was delivered at 50 Hz for 300 ms. E, Comparison voltage sags in three model neurons that range in relative peak conductance values of IH from one to six times peak, using an IA tau value of 200 ms. F, Plot of inactivation time constant of IA versus rebound delays, measured from a baseline voltage of −70 mV, in models with amplitudes of IH ranging from one to six times the peak. G, Comparison of rebound delay in two model neurons where T-type calcium is present at our control permeability value and at 10 times that value, with 200 ms of IA inactivation tau. Note the decrease in the rebound delay with T-type calcium present. H, Plot of rebound delay versus inactivation tau of IA in the our model neuron where T-type calcium current is present at our control permeability value (light blue circles) and 10 times that value (black circles).

Similar articles

Cited by

References

    1. Amendola J, Woodhouse A, Martin-Eauclaire MF, Goaillard JM (2012) Ca(2)(+)/cAMP-sensitive covariation of I(A) and I(H) voltage dependences tunes rebound firing in dopaminergic neurons. J Neurosci 32:2166–2181. 10.1523/JNEUROSCI.5297-11.2012 - DOI - PMC - PubMed
    1. An WF, Bowlby MR, Betty M, Cao J, Ling HP, Mendoza G, Hinson JW, Mattsson KI, Strassle BW, Trimmer JS, Rhodes KJ (2000) Modulation of A-type potassium channels by a family of calcium sensors. Nature 403:553–556. 10.1038/35000592 - DOI - PubMed
    1. Anderson D, Rehak R, Hameed S, Mehaffey WH, Zamponi GW, Turner RW (2010) Regulation of the KV4.2 complex by CaV3.1 calcium channels. Channels 4:163–167. 10.4161/chan.4.3.11955 - DOI - PubMed
    1. Aransay A, Rodríguez-López C, García-Amado M, Clascá F, Prensa L (2015) Long-range projection neurons of the mouse ventral tegmental area: a single-cell axon tracing analysis. Front Neuroanat 9:59. - PMC - PubMed
    1. Baranauskas G. (2004) Cell-type-specific splicing of KChIP4 mRNA correlates with slower kinetics of A-type current. Eur J Neurosci 20:385–391. 10.1111/j.1460-9568.2004.03494.x - DOI - PubMed

Publication types

LinkOut - more resources