. 2017 Mar 22;37(12):3413-3424.
doi: 10.1523/JNEUROSCI.1000-16.2017. Epub 2017 Feb 20.

Neural Representation and Causal Models in Motor Cortex

Affiliations

Neural Representation and Causal Models in Motor Cortex

Kris S Chaisanguanthum et al. J Neurosci. .

Abstract

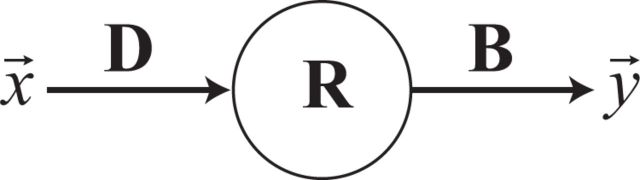
Dorsal premotor (PMd) and primary motor (M1) cortices play a central role in mapping sensation to movement. Many studies of these areas have focused on correlation-based tuning curves relating neural activity to task or movement parameters, but the link between tuning and movement generation is unclear. We recorded motor preparatory activity from populations of neurons in PMd/M1 as macaque monkeys performed a visually guided reaching task and show that tuning curves for sensory inputs (reach target direction) and motor outputs (initial movement direction) are not typically aligned. We then used a simple, causal model to determine the expected relationship between sensory and motor tuning. The model shows that movement variability is minimized when output neurons (those that directly drive movement) have target and movement tuning that are linearly related across targets and cells. In contrast, for neurons that only affect movement via projections to output neurons, the relationship between target and movement tuning is determined by the pattern of projections to output neurons and may even be uncorrelated, as was observed for the PMd/M1 population as a whole. We therefore determined the relationship between target and movement tuning for subpopulations of cells defined by the temporal duration of their spike waveforms, which may distinguish cell types. We found a strong correlation between target and movement tuning for only a subpopulation of neurons with intermediate spike durations (trough-to-peak ∼350 μs after high-pass filtering), suggesting that these cells have the most direct role in driving motor output.SIGNIFICANCE STATEMENT This study focuses on how macaque premotor and primary motor cortices transform sensory inputs into motor outputs. We develop empirical and theoretical links between causal models of this transformation and more traditional, correlation-based "tuning curve" analyses. Contrary to common assumptions, we show that sensory and motor tuning curves for premovement preparatory activity do not generally align. Using a simple causal model, we show that tuning-curve alignment is only expected for output neurons that drive movement. Finally, we identify a physiologically defined subpopulation of neurons with strong tuning-curve alignment, suggesting that it contains a high concentration of output cells. This study demonstrates how analysis of movement variability, combined with simple causal models, can uncover the circuit structure of sensorimotor transformations.

Keywords: computational model; electrophysiology; macaque; motor cortex; reaching; variability.


Figures

Figure 1.
Figure 1.
Spike waveform analysis. a, Mean spike waveforms, colored according to waveform trough-to-peak time. Colors are for presentational clarity. b, Histogram of fraction of cells recorded in each spike waveform width bin. Spike-width distributions vary across microarrays, likely attributable to implantation depth. Note that because the electrophysiological signals were high-pass filtered, the waveform durations reported here are shorter than the true durations.
Figure 2.
Figure 2.
Neural activity does not exhibit context dependence between experimental block types. Scatter plots show a comparison of the mean firing rates in the three-target and eight-target blocks. Each data point is the mean rate for a given recorded cell and target, during the delay period (left) or the peri-movement period (right). Log–log plots are shown for clarity, but the Pearson correlation coefficients were computed on the raw values. Similar results (p ≥ 0.94) were obtained with Spearman rank-order correlations.
Figure 3.
Figure 3.
Relationship between target and movement tuning. a, b, Target tuning. For two example cells (Monkey E, same experimental session), delay-period firing rate is plotted against the reach target angle (gray points represent trials; open circles and error bars show per-target means and SDs, respectively) for trials in the eight-target blocks. The black trace is the best-fit cosine tuning curve (Eqs. 1, 4). c, d, Movement tuning. Scatter plots show delay-period firing rates versus initial movement angle for individual trials, color-coded by target. For each target in the three-target blocks, the reach regression slope (Eq. 3) is drawn. The cosine target tuning curve from a and b is shown for comparison in black. e, f, Scatter plot of reach slope versus target slope for each cell and each target in the three-target blocks of all sessions.
Figure 4.
Figure 4.
A simple schematic of the circuit that drives visually guided reach. A stimulus x⃗ is presented; information about this stimulus is encoded by the firing rates R of cells in a neural population, which in turn drive a motor command y⃗. D is the target tuning matrix (Eq. 4), and B is the motor weighting matrix (Eq. 5).
Figure 5.
Figure 5.
Simulation of the effect of downstream noise. a–c, The expected relationship between target and reach slopes predicted by the minimum-variance model (Eq. 9) for 0% (a), 50% (b), and 100% (c) of total motor variance arising downstream of the neural population. Here, behavioral noise caused by population noise (Σpop = [DTE−1D]−1) and downstream contribution (Σdownstr) are assumed to be isotropic. d, Summary: expected regression slope between target and reach slopes (SE shown) as a function of fraction of motor variance that arises downstream of the neural population. Black circles (with errors) show where experimental data (see Fig. 3) lie.
Figure 6.
Figure 6.
Effect of nonprojection neurons. a, An augmented model for the sensorimotor circuit. As in Figure 4, behavior is driven by neural activity encoding the stimulus x⃗; however, here there is also a subpopulation of input cells or interneurons whose activity Rin only affects the output of the circuit through connections, via weight matrix W, to the population of output projection neurons. b–d, Example weight matrices W for the augmented model in a: random connectivity between nonprojection neurons and output neurons (b), tuned connectivity with positive weights (c), and tuned connectivity with negative weights (d). (For display, weights are normalized to range between positive and negative unity.) e–g, Simulated minimum-variance predictions for the relationship between target and reach slopes for the output projection (gold; Eq. 12a) and nonprojection (gray, with regression slope; Eq. 12b) cell populations. These simulations do not include downstream or measurement/statistical noise.
Figure 7.
Figure 7.
Differences in target and movement tuning correlation across spike waveform shape. a–c, Scatter plot of movement tuning slope f versus target tuning slope d for cells in each of three waveform groups, defined as trough-to-peak times from 200–250 μs (a), 350–400 μs (b), and 500–550 μs (c). Data are for each target in the three-target blocks of each session and for both animals combined (compare Fig. 3); gray lines are regression fits to the f versus d data. d, Regression slope of f versus d for subsets of cells identified by their waveform trough-to-peak time, in 50 μs bins; data from both animals are combined. Open circles denote the datasets shown in a–c. e, Same as d, but with data separated by animal and brain area. Asterisks denote statistical significance (*p < 0.05, z test) of nonzero result; additional asterisks denote additional SE of significance, i.e., ***p < 10−4 and ****p < 10−6. f, g, For cells binned as in d and e: mean (and SEM) of target tuning modulation depth (|d⃗I| in Eq. 1; f) and coefficient of determination R2 of the movement tuning regression (g). Note that for g only, the regression was computed on the first-order difference (trial-to-trial changes) in both neural activity and behavior, as this mitigates potential effects of nonstationarity (Chaisanguanthum et al., 2014), providing a more unbiased estimate of the strength of tuning. Results are qualitatively unchanged when the raw values are used instead.
Figure 8.
Figure 8.
Relationship between movement tuning and target tuning, with tunings measured across and between epochs. Each square represents the normalized slope (i.e., divided by the SE) of the regression between a target tuning d and a movement tuning f, where d and f come from the epoch noted on the ordinate and abscissa, respectively. The epochs are numbered as follows: (i) pretrial, (ii) trial start, (iii) trial ready, (iv) delay period (premovement), and (v) peri-movement (see Materials and Methods). a–c were computed with the same subsets of cells used in Figure 7a–c. Thus, the three squares outlined in white correspond to delay-period data marked with open circles in Figure 7d. Squares marked with asterisks correspond to those with significantly positive slopes (*p < 0.02, **p < 0.005, ***p < 0.0001).

Similar articles

References

    1. Best MD, Takahashi K, Suminski AJ, Ethier C, Miller LE, Hatsopoulos NG (2016) Comparing offline decoding performance in physiologically defined neuronal classes. J Neural Eng 13:026004. 10.1088/1741-2560/13/2/026004 - DOI - PMC - PubMed
    1. Carandini M, Heeger DJ (2011) Normalization as a canonical neural computation. Nat Rev Neurosci 13:51–62. 10.1038/nrc3398 - DOI - PMC - PubMed
    1. Chaisanguanthum KS, Shen HH, Sabes PN (2014) Motor variability arises from a slow random walk in neural state. J Neurosci 34:12071–12080. 10.1523/JNEUROSCI.3001-13.2014 - DOI - PMC - PubMed
    1. Churchland MM, Afshar A, Shenoy KV (2006) A central source of movement variability. Neuron 52:1085–1096. 10.1016/j.neuron.2006.10.034 - DOI - PMC - PubMed
    1. Churchland MM, Cunningham JP, Kaufman MT, Ryu SI, Shenoy KV (2010) Cortical preparatory activity: representation of movement or first cog in a dynamical machine? Neuron 68:387–400. 10.1016/j.neuron.2010.09.015 - DOI - PMC - PubMed

Publication types