. 2017 Mar 29;37(13):3478-3490.
doi: 10.1523/JNEUROSCI.3674-16.2017. Epub 2017 Feb 20.

A Unique "Angiotensin-Sensitive" Neuronal Population Coordinates Neuroendocrine, Cardiovascular, and Behavioral Responses to Stress

Affiliations

A Unique "Angiotensin-Sensitive" Neuronal Population Coordinates Neuroendocrine, Cardiovascular, and Behavioral Responses to Stress

Annette D de Kloet et al. J Neurosci. .

Abstract

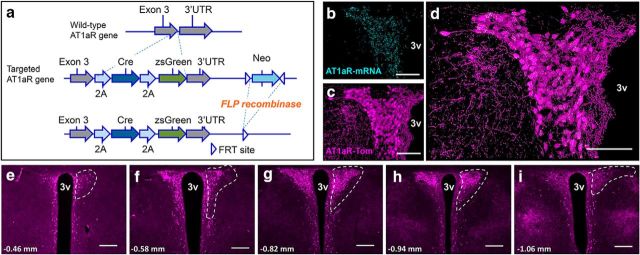
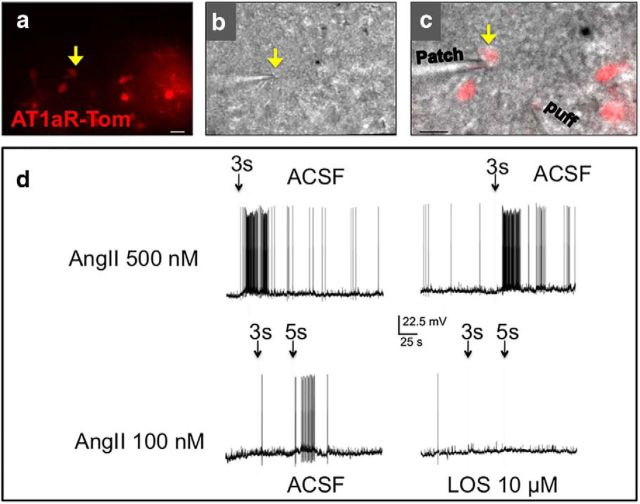
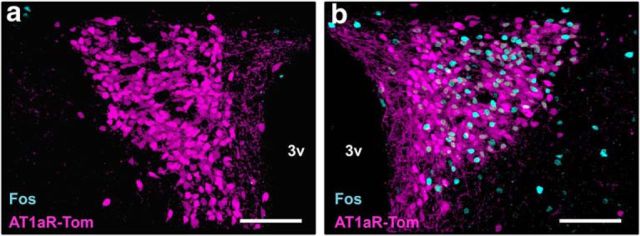
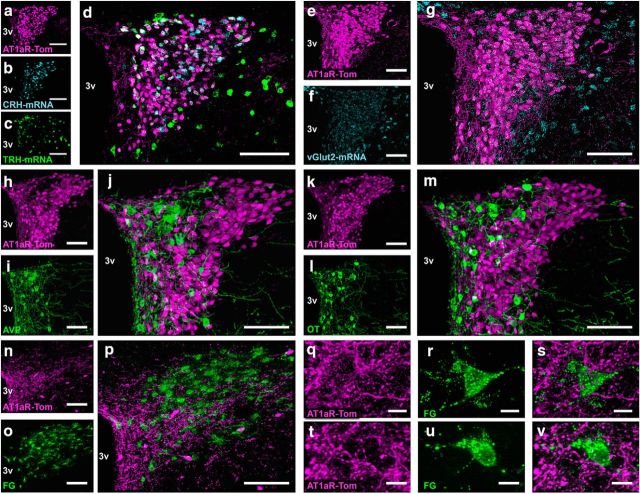
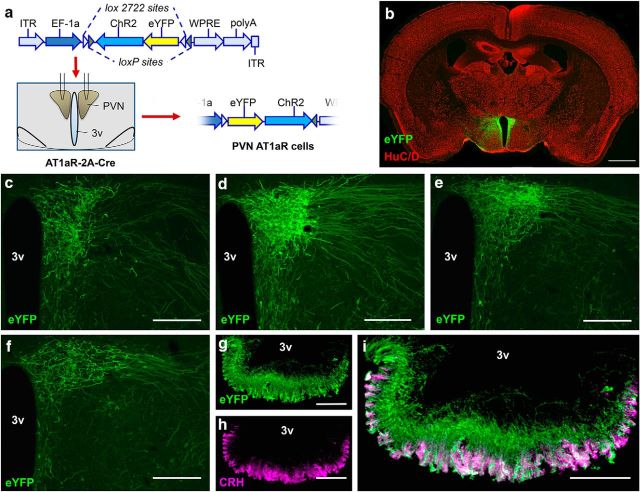
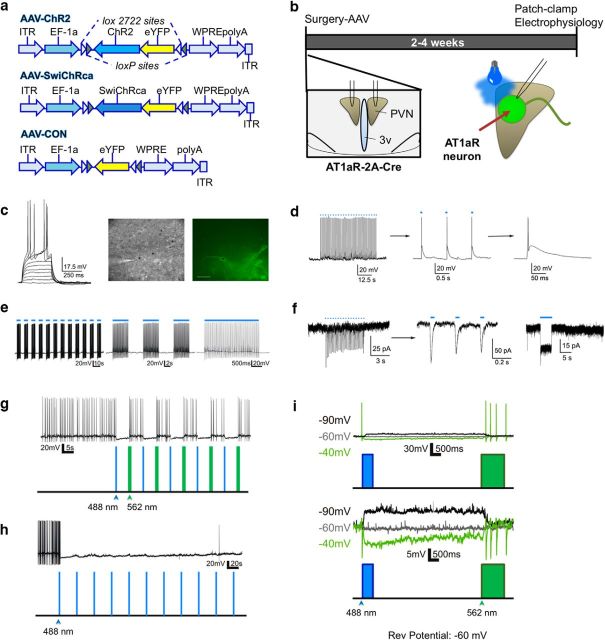
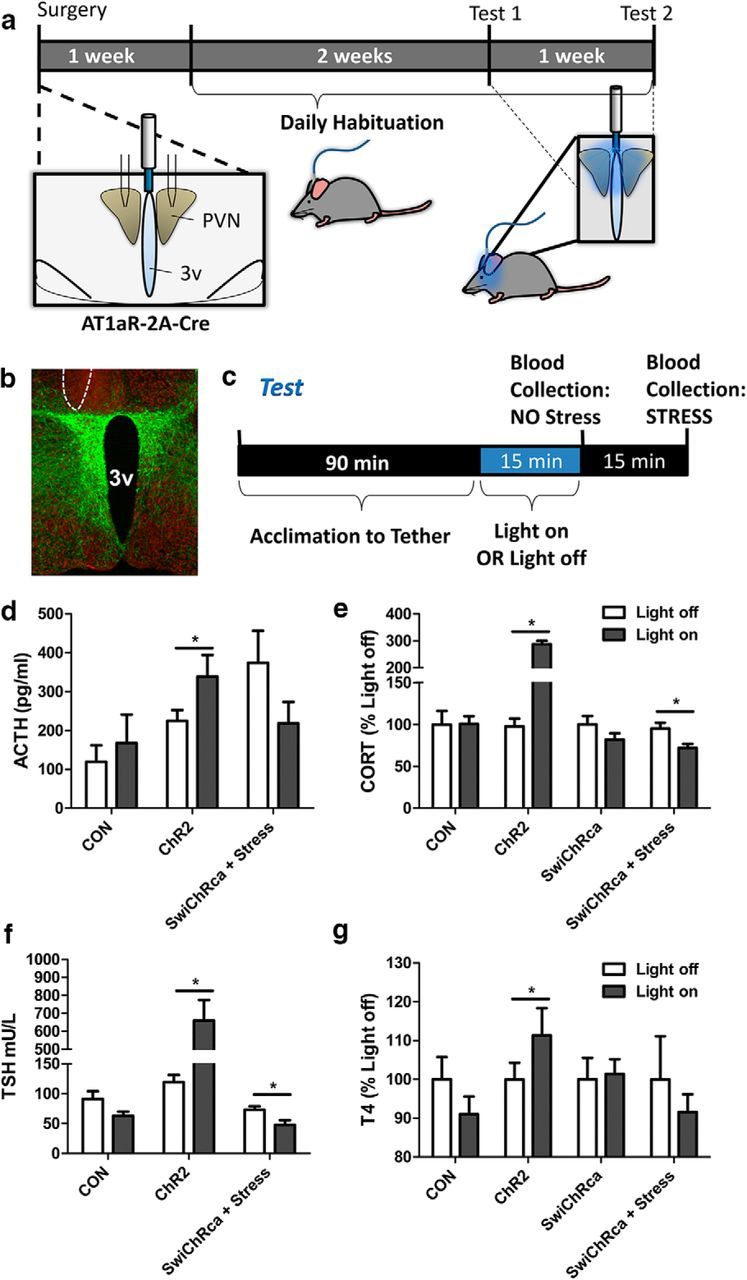
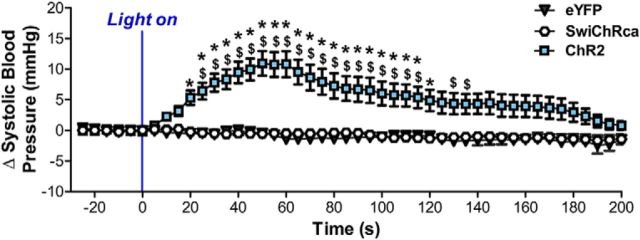
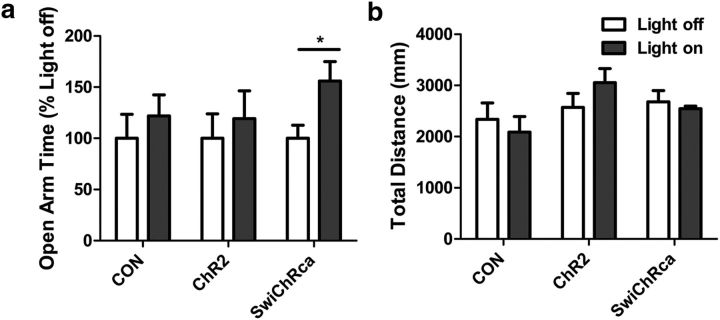
Stress elicits neuroendocrine, autonomic, and behavioral responses that mitigate homeostatic imbalance and ensure survival. However, chronic engagement of such responses promotes psychological, cardiovascular, and metabolic impairments. In recent years, the renin-angiotensin system has emerged as a key mediator of stress responding and its related pathologies, but the neuronal circuits that orchestrate these interactions are not known. These studies combine the use of the Cre-recombinase/loxP system in mice with optogenetics to structurally and functionally characterize angiotensin type-1a receptor-containing neurons of the paraventricular nucleus of the hypothalamus, the goal being to determine the extent of their involvement in the regulation of stress responses. Initial studies use neuroanatomical techniques to reveal that angiotensin type-1a receptors are localized predominantly to the parvocellular neurosecretory neurons of the paraventricular nucleus of the hypothalamus. These neurons are almost exclusively glutamatergic and send dense projections to the exterior portion of the median eminence. Furthermore, these neurons largely express corticotrophin-releasing hormone or thyrotropin-releasing hormone and do not express arginine vasopressin or oxytocin. Functionally, optogenetic stimulation of these neurons promotes the activation of the hypothalamic-pituitary-adrenal and hypothalamic-pituitary-thyroid axes, as well as a rise in systolic blood pressure. When these neurons are optogenetically inhibited, the activity of these neuroendocrine axes are suppressed and anxiety-like behavior in the elevated plus maze is dampened. Collectively, these studies implicate this neuronal population in the integration and coordination of the physiological responses to stress and may therefore serve as a potential target for therapeutic intervention for stress-related pathology.SIGNIFICANCE STATEMENT Chronic stress leads to an array of physiological responses that ultimately rouse psychological, cardiovascular, and metabolic impairments. As a consequence, there is an urgent need for the development of novel therapeutic approaches to prevent or dampen deleterious aspects of "stress." While the renin-angiotensin system has received some attention in this regard, the neural mechanisms by which this endocrine system may impact stress-related pathologies and consequently serve as targets for therapeutic intervention are not clear. The present studies provide substantial insight in this regard. That is, they reveal that a distinct population of angiotensin-sensitive neurons is integral to the coordination of stress responses. The implication is that this neuronal phenotype may serve as a target for stress-related disease.

Keywords: anxiety; cardiovascular; depression; glucocorticoids; hypertension; thyroid.


Figures

Figure 1.
Figure 1.
Validation of the AT1aR-Cre mouse line. a, Top, Wild-type AT1aR gene. Middle, To express both Cre-recombinase and zsGreen without interrupting AT1aR expression, 2A-Cre-2A zsgreen was introduced upstream of AT1aR 3′ UTR via homologous recombination. Bottom, F1 heterozygous mice were bred with a FLP-deleter strain, leading to the excision of the neomycin selection cassette. b–d, Projection images of the PVN collected from a mouse expressing both the AT1aR-Cre and the td-Tomato-stop-flox reporter gene depicting (b) AT1aR mRNA in cyan, (c) AT1aR-tdTomato-containing cells (AT1aR-Tom) in magenta, and (d) the merged image highlighting extensive overlap between the two markers. g–i, 10× images of coronal sections through the PVN of AT1aR-Tom reporter mice portraying (in magenta) the distribution of AT1aR-Tom throughout the PVN. White dashed lines outline the PVN unilaterally and the number on the bottom left of each image corresponds to the rostrocaudal distance from bregma. 3v, Third cerebral ventricle. Scale bars: b–d, 100 μm; e–i, 200 μm.
Figure 2.
Figure 2.
Ang-II excites AT1aR-Tom neurons in the PVN. a, b, Representative example of a patched AT1aR-tdTomato neuron (arrow) visualized under fluorescence (a) and differential interference contrast (b) illumination. c, Superimposed images of a and b. Scale bars, 40 μm. d, Top, Representative traces showing reproducible excitatory responses in the patched AT1aR-tdTomato neuron in response to a focal puff of Ang-II. Bottom, Representative traces from the same neuron showing that the Ang-II-mediated excitatory response was blocked by losartan (LOS).
Figure 3.
Figure 3.
AT1aR-tdTomato neurons are activated by restraint stress. a, b, Representative projection images through the PVN of AT1aR-tdTomato reporter mice under (a) nonstressed control conditions or (b) subsequent to an acute restraint stress challenge. AT1aR-tdTomato is depicted in magenta and Fos (a marker of neuronal activation) is depicted in cyan. 3v, Third ventricle. Scale bars, 100 μm.
Figure 4.
Figure 4.
Neurochemical phenotype of AT1aR-containing cells within the PVN. a–m, Coronal sections through the PVN of an AT1aR-tdTomato reporter mouse depicting tdTomato and either (a–d) CRH and TRH mRNA, (e–g) vGlut2 mRNA, (h–j) AVP, (k–m) OT, or (h–j) FG-labeled rostral ventrolateral medulla-projecting preautonomic neurons. a–d, Projection images of the PVN depicting (a) AT1a-Tom in magenta, (b) CRH mRNA in cyan, (c) TRH mRNA in green, and (d) the merged image. e–g, Projection images of the PVN depicting (e) AT1a-Tom in magenta, (f) vGlut2 mRNA in cyan, and (g) the merged image. h–j, Projection images of the PVN depicting (h) AT1a-Tom in magenta, (i) AVP in green, and (j) the merged image. k–m, Projection images of the PVN depicting (k) AT1a-Tom in magenta, (l) OT in green, and (m) the merged image. n–p, Projection images of the PVN collected from AT1aR-tdTomato mice that received FG injections into the RVLM and were perfused 7 d later depicting (n, q, t) AT1aR in magenta, (o, r, u) FG-labeled RVLM-projecting neurons in green, and (p, s, v) the merged images. 3v, Third cerebral ventricle. Scale bars: a–p, 100 μm; q–v, 10 μm.
Figure 5.
Figure 5.
AT1aR-Cre neurons project primarily to the median eminence. a, Schematic illustrating (1) the viral construct used to direct the Cre-dependent expression of ChR2 and eYFP to neurons within the PVN of the AT1aR-Cre mouse, (2) the bilateral injection of the AAV into the PVN, and (3) the subsequent Cre-mediated inversion of the dual floxed eYFP and ChR2 into the correct orientation. b, Coronal section through the PVN of a representative “hit” used for the neuroanatomical studies highlighting the specific localization of eYFP (green) to the neurons (HuC/D, labeled in red) of PVN of the AT1aR-Cre mouse and not to adjacent brain nuclei. c–f, Higher-magnification images of the PVN of such a representative hit underscoring again the specificity of the injection and also depicting the ventrolateral projection of the eYFP fibers. g, Dual-label IHC for eYFP and CRH in an AT1aR-Cre mouse that received the AAV-ChR2-eYFP into the PVN. 3v, Third cerebral ventricle. Scale bars: b, 1 μm; c–f, 200 μm; g–i, 100 μm.
Figure 6.
Figure 6.
In vitro optogenetic stimulation/inhibition of PVN AT1aR neurons. a, Viral constructs used for the in vitro and in vivo optogenetic studies. b, Schematic of the experimental protocols used for the evaluation of the impact of optogenetic stimulation/inhibition in vitro. c, Left, Representative example of membrane potential changes in response to depolarizing current steps of increasing magnitude (10 pA steps) in a patched AAV-ChR2 neuron. The patched neuron was visualized using differential interference contrast (middle) and fluorescence (right) light. Asterisk indicates recorded neuron. Scale bar, 40 μm. d, Left, Representative trace showing optogenetically evoked firing activity in the patched AAV-ChR2 neuron (50× 488 nm laser pulse, 2 ms each, 1 s interval). Middle, Right, Same trace is shown at a progressively expanded scale to show that each light stimulation can reproducibly evoke single action potentials in the patched neuron. e, Left, A different stimulation protocol (75× 488 nm laser pulse, 20 ms each, 67 ms interval, 15 Hz) was used to evoke bursting firing in the patched AAV-ChR2 neuron. Middle, Right, The same trace is shown at a progressively expanded scale. f, Left, Representative voltage-clamp trace obtained from a AAV-ChR2 neuron (30× 488 nm laser pulse, 10 ms each, 200 ms interval) showing reproducible evoked inward currents. Middle, Same trace is shown at a more expanded time scale. Right, A single, prolonged (5 s) light stimulation pulse was given, evoking a sustained, noninactivating inward current. g, Representative trace of a patched AAV-SwiChRca neuron showing that repeated brief opening (488 nm, 500 ms duration) and closing (562 nm, 1000 ms duration; 5 s interval between opening and closing) of the chloride channels, evoked a transient inhibition of firing activity in the patched neuron. h, Representative trace of a patched AAV-SwiChRca neuron showing that repeated 488 nm light pulses (500 ms each, every 30 s for 6 min) nearly silenced the patched neuron for the duration of the light stimulation. i, Top, Another example of a patched AAV-SwiChRca neuron in current-clamp mode showing that the changes in membrane potential evoked by opening/closing chloride channels had a reversal potential of ∼−60 mV. For display purposes, all traces were aligned at the beginning, even though the holding potential was different. Bottom, The same traces are shown at an expanded voltage scale (action potentials were clipped) to better display changes in membrane potential.
Figure 7.
Figure 7.
Impact of in vivo optogenetic stimulation/inhibition of PVN AT1aR neurons on the HPA and HPT axes. a, Schematic of the experimental protocols used for the evaluation of the impact of optogenetic stimulation/inhibition on the activity of the HPA and HPT axes. Stereotaxic surgery for the injection of the AAVs described in Figure 6a bilaterally into the PVN and unilateral implantation of the fiber optic post was followed by a period of recovery and habituation to the tethering protocol, and then by the test protocol. b, Image of a representative hit used for these studies with eYFP in green and the neuronal marker HuC/D in red; the unilateral site of post implantation is outlined by a dashed line. c, The test protocol used to generate the neuroendocrine data. The blue-light stimulation/inhibition parameters are as follows: the AAV-ChR2-eYFP and the AAV-eYFP mice were subjected to 20 ms pulses, 15 Hz, 5 s on followed by 5 s off; the AAV-SwiChR2 mice received 500 ms pulses at 0.033 Hz; in all cases, the stimulation/inhibition protocols continued for 15 min. d–g, Stimulation/inhibition of AT1aR neurons using this protocol led to alterations in the circulating levels of (d) ACTH, (e) CORT, (f) TSH, and (g) T4. 3v, Third cerebral ventricle. Error bars indicate SEM. *p < 0.05.
Figure 8.
Figure 8.
Impact of in vivo optogenetic stimulation/inhibition of PVN AT1aR neurons on systolic blood pressure. Systolic blood pressure response to blue light in mice that were delivered either by AAV-eYFP, AAV-ChR2-eYFP, or AAV-SwiChRca bilaterally into the PVN. As described in detail in the Materials and Methods, mice that received Cre-inducible AAV-eYFP or Cre-inducible AAV-ChR2 were stimulated with blue light for 60 s (20 ms pulses, 15 Hz, 5 s on followed by 5 s off) and mice that received Cre-inducible AAV-SwiChR were stimulated with blue light for 180 s (500 ms pulses, 0.033 Hz). Error bars indicate SEM. *p < 0.05, significantly different from AAV-eYFP. $ = p < 0.05, significantly different from AAV-SwiChRca.
Figure 9.
Figure 9.
Impact of in vivo optogenetic stimulation/inhibition of PVN AT1aR neurons on anxiety-like behavior in the EPM. a, b, Open arm time (a) and total distance traveled (b) of mice that were delivered either AAV-eYFP, AAV-ChR2-eYFP, or AAV-SwiChRca bilaterally into the PVN. Blue-light stimulation parameters for the AAV-ChR2-eYFP and the AAV-eYFP mice were as follows: 20 ms pulses, 15 Hz, 5 s on followed by 5 s off. For the AAV-SwiChR2 mice, the stimulation parameters were 500 ms pulses at 0.033 Hz. The stimulation/inhibition protocols continued for the entirety of the 5 min test. Error bars indicate SEM. *p < 0.05.

Similar articles

Cited by

References

    1. Aguilera G, Young WS, Kiss A, Bathia A (1995) Direct regulation of hypothalamic corticotropin-releasing-hormone neurons By angiotensin-II. Neuroendocrinology 61:437–444. - PubMed
    1. Angunsri R, Sritharathikhun T, Suttirat S, Tencomnao T (2009) Association of angiotensin-converting enzyme gene promoter single nucleotide polymorphisms and haplotype with major depression in a northeastern Thai population. J Renin Angiotensin Aldosterone Syst 10:179–184. 10.1177/1470320309344151 - DOI - PubMed
    1. Baghai TC, Schule C, Zwanzger P, Minov C, Zill P, Ella R, Eser D, Oezer S, Bondy B, Rupprecht R (2002) Hypothalamic-pituitary-adrenocortical axis dysregulation in patients with major depression is influenced by the insertion/deletion polymorphism in the angiotensin I-converting enzyme gene. Neurosci Lett 328:299–303. 10.1016/S0304-3940(02)00527-X - DOI - PubMed
    1. Baghai TC, Binder EB, Schule C, Salyakina D, Eser D, Lucae S, Zwanzger P, Haberger C, Zill P, Ising M, Deiml T, Uhr M, Illig T, Wichmann HE, Modell S, Nothdurfter C, Holsboer F, Müller-Myhsok B, Möller HJ, Rupprecht R et al. (2006) Polymorphisms in the angiotensin-converting enzyme gene are associated with unipolar depression, ACE activity and hypercortisolism. Mol Psychiatry 11:1003–1015. 10.1038/sj.mp.4001884 - DOI - PubMed
    1. Ben-Barak Y, Russell JT, Whitnall MH, Ozato K, Gainer H (1985) Neurophysin in the hypothalamo-neurohypophysial system. I. Production and characterization of monoclonal antibodies. J Neurosci 5:81–97. - PMC - PubMed

Publication types