. 2017 Feb 6:8:14.
doi: 10.3389/fendo.2017.00014. eCollection 2017.

Synchronization by Daytime Restricted Food Access Modulates the Presence and Subcellular Distribution of β-Catenin and Its Phosphorylated Forms in the Rat Liver

Affiliations

Synchronization by Daytime Restricted Food Access Modulates the Presence and Subcellular Distribution of β-Catenin and Its Phosphorylated Forms in the Rat Liver

Dalia Luz De Ita-Pérez et al. Front Endocrinol (Lausanne). .

Abstract

β-catenin, the principal effector of the Wnt pathway, is also one of the cadherin cell adhesion molecules; therefore, it fulfills signaling and structural roles in most of the tissues and organs. It has been reported that β-catenin in the liver regulates metabolic responses such as gluconeogenesis and histological changes in response to obesity-promoting diets. The function and cellular location of β-catenin is finely modulated by coordinated sequences of phosphorylation-dephosphorylation events. In this article, we evaluated the levels and cellular localization of liver β-catenin variants, more specifically β-catenin phosphorylated in serine 33 (this phosphorylation provides recognizing sites for β-TrCP, which results in ubiquitination and posterior proteasomal degradation of β-catenin) and β-catenin phosphorylated in serine 675 (phosphorylation that enhances signaling and transcriptional activity of β-catenin through recruitment of different transcriptional coactivators). β-catenin phosphorylated in serine 33 in the nucleus shows day-night fluctuations in their expression level in the Ad Libitum group. In addition, we used a daytime restricted feeding (DRF) protocol to show that the above effects are sensitive to food access-dependent circadian synchronization. We found through western blot and immunohistochemical analyses that DRF protocol promoted (1) higher total β-catenins levels mainly associated with the plasma membrane, (2) reduced the presence of cytoplasmic β-catenin phosphorylated in serine 33, (3) an increase in nuclear β-catenin phosphorylated in serine 675, (4) differential co-localization of total β-catenins/β-catenin phosphorylated in serine 33 and total β-catenins/β-catenin phosphorylated in serine 675 at different temporal points along day and in fasting and refeeding conditions, and (5) differential liver zonation of β-catenin variants studied along hepatic acinus. In conclusion, the present data comprehensively characterize the effect food synchronization has on the presence, subcellular distribution, and liver zonation of β-catenin variants. These results are relevant to understand the set of metabolic and structural liver adaptations that are associated with the expression of the food entrained oscillator (FEO).

Keywords: food entrained oscillator; liver; microscopy; phosphorylation; β-catenin variants.


Figures
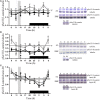
Figure 1
Figure 1
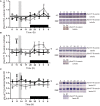
Daily profile of pSer33 β-catenin in the rat liver under the daytime restricted feeding (DRF) protocol. Semiquantitative western blot analysis of pSer33 β-catenin at total homogenate (A), cytosolic fraction (B), and nuclear fraction (C). Each value was normalized using the housekeeping proteins tubulin [for (A,B)] and lamin B1 [for (C)]. A representative western blot for each condition is shown. Gray squares, AL group; black circles, DRF group; triangles, Fa group; inverse triangles, Rf group. Data are represented as the mean ± SEM (n = 4–5 different animals per temporal point). Horizontal lines represent the 24-h cycle average. The vertical gray bar indicates food access (12:00–14:00 hours), and the horizontal black rectangle in the x-axis corresponds to the dark phase. ψSignificant difference between AL and DRF groups in the 24-h average (Student’s t-test, p < 0.05). *Significant difference between AL and DRF groups at the same temporal point (two-way ANOVA followed by Sidak post hoc test, p < 0.0001). αSignificant difference between points of the same group (one-way ANOVA followed by Tukey post hoc test, p < 0.05). ΩSignificant difference between Fa and Rf groups (Student’s t-test, p < 0.05). #Significant difference between DRF (11:00 or 14:00 hours) versus Fa and Rf (Student’s t-test, p < 0.05).
Figure 2
Figure 2
Daily profile of pSer675 β-catenin in the rat liver under the daytime restricted feeding (DRF) protocol. Semiquantitative western blot analysis of pSer675 β-catenin at total homogenate (A), cytosolic fraction (B), and nuclear fraction (C). Each value was normalized using the housekeeping proteins tubulin [for (A,B)] and lamin B1 [for (C)]. A representative western blot for each condition is shown. Gray squares, AL group; black circles, DRF group; triangles, Fa group; inverse triangles, Rf group. Data are represented as the mean ± SEM (n = 4–5 animals per temporal point). Horizontal lines represent the 24-h cycle average. The vertical gray bar indicates food access (12:00–14:00 hours), and the horizontal black rectangle in the x-axis corresponds to the dark phase. ψSignificant difference between AL and DRF groups in the 24-h average (Student’s t-test, p < 0.05). αSignificant difference between points of the same group (one-way ANOVA followed by Tukey post hoc test, p < 0.05). ΩSignificant difference between Fa and Rf groups (Student’s t-test, p < 0.05). #Significant difference between DRF (11:00 or 14:00 hours) versus Fa and Rf (Student’s t-test, p < 0.05).
Figure 3
Figure 3
Daily profile of total β-catenins presence in the rat liver under the daytime restricted feeding (DRF) protocol. Semiquantitative western blot analysis of total β-catenins at total homogenate (A), cytosolic fraction (B), and nuclear fraction (C). Each value was normalized using the housekeeping proteins tubulin [for (A,B)] and lamin B1 [for (C)]. A representative western blot for each condition is shown. Gray squares, AL group; black circles, DRF group; triangles, Fa group; inverse triangles, Rf group. Data are represented as the mean ± SEM (n = 5–7 animals per temporal point). Horizontal lines represent the 24-h cycle average. The vertical gray bar indicates food access (12:00–14:00 hours), and the horizontal black rectangle in the x-axis corresponds to the dark phase. ψSignificant difference between AL and DRF groups in the 24-h average (Student’s t-test, p < 0.05). *Significant difference between AL and DRF groups at the same temporal point (two-way ANOVA followed by Sidak post hoc test, p < 0.0001). ΩSignificant difference between Fa and Rf groups (Student’s t-test, p < 0.05). #Significant difference between DRF (11:00 or 14:00 hours) versus Fa and Rf (Student’s t-test, p < 0.05).
Figure 4
Figure 4
Expression of the total β-catenins in the hepatocyte plasma membrane under the daytime restricted feeding (DRF) protocol. (A) Immunofluorescence signal for total β-catenins in three different temporal points: before food-anticipatory activity (FAA) (11:00 hours), after FAA (14:00 hours), and in the middle of the dark phase (02:00 hours), as well as under Fa and Rf conditions. Both a panoramic (yellow calibration bar = 50 µm) and a close-up view (blue calibration bar = 25 µm) indicated by an orange square are shown. A negative control (primary antibody omitted) is displayed in the insert of the panoramic panels. Histograms show quantification of (B) total β-catenins presence in hepatocyte plasma membrane (n = 3 animals) and (C) hepatocyte diameter at same temporal points described above under AL (white bars), DRF (black bars), and Fa and Rf (gray bars) conditions (n = 200). Data are represented as the mean ± SEM. The horizontal gray line represents the schedules average of each condition. ψSignificant difference between AL and DRF groups average (Student’s t-test, p < 0.05). *Significant difference between AL and DRF groups at the same temporal point (Student’s t-test, p < 0.05). f.a.u, fluorescence arbitrary units.
Figure 5
Figure 5
Cytosolic co-localization of pSer33 β-catenin and total β-catenins in histological liver samples of rats under daytime restricted feeding (DRF) protocol. Immunofluorescence signal for the pSer33 β-catenin (green), the total β-catenins (red), and the DAPI (blue) in DRF conditions at three different temporal points: 11:00, 14:00, and 02:00 hours (see Figure 4 for explanation), as well as Fa and Rf conditions. Both a panoramic (yellow calibration bar = 50 µm) and a close-up view (blue calibration bar = 25 µm) indicated by an orange square are shown. Negative controls (primary antibody omitted) are displayed in the insert of the panoramic panels. Histological liver samples from three different animals.
Figure 6
Figure 6
Plasma membrane co-localization of total β-catenins and pSer675 β-catenin in histological liver samples of rats under daytime restricted feeding (DRF) protocol. Immunofluorescence signal for pSer675 β-catenin (green), total β-catenins (red), and DAPI (blue) under DRF conditions at three different temporal points: 11:00, 14:00, and 02:00 hours (see Figure 4, for explanation), as well as under Fa and Rf conditions. Both a panoramic (yellow calibration bar = 50 µm) and a close-up view (blue calibration bar = 25 µm) indicated by an orange square are shown. Negative controls (primary antibody omitted) are displayed in the insert of the panoramic panels. Histological liver samples from three different animals.
Figure 7
Figure 7
Zonal distribution of total β-catenins in the hepatic acinus. Immunofluorescence signal for glutamine synthetase (green), total β-catenins (red), and DAPI (blue). Both a panoramic (purple calibration bar = 50 µm) and a close-up view (blue calibration bar = 25 µm and yellow calibration bar = 20 µm) indicated by an orange square are shown. Negative controls (primary antibody omitted) are displayed in the insert of the panoramic panels. Histological liver samples from three different animals. PC, pericentral zone; Iz, intermediate zone; PP, periportal zone; CV, central vein.
Figure 8
Figure 8
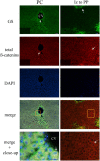
Zonal distribution of pSer675 β-catenin in the hepatic acinus. Immunofluorescence signal for glutamine synthetase (green), pSer675 β-catenin (red), and DAPI (blue). Both a panoramic (yellow calibration bar = 50 µm) and a close-up view (blue calibration bar = 25 µm) indicated by an orange square are shown. Negative controls (primary antibody omitted) are displayed in the insert of the panoramic panels. Histological liver samples from three different animals. CV = central vein.
Figure 9
Figure 9
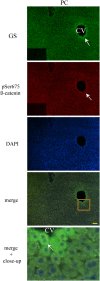
Zonal distribution of pSer33 β-catenin in the hepatic acinus. Immunofluorescence signal for glutamine synthase (green), pSer33 β-catenin (red), and DAPI (blue). Both a panoramic (yellow calibration bar = 50 µm) and a close-up view (blue calibration bar = 25 µm) indicated by an orange square are shown. Negative controls (primary antibody omitted) are displayed in the insert of the panoramic panels. Histological liver samples from 3 different animals. PC = pericentral zone; CV = central vein.
Figure 10
Figure 10
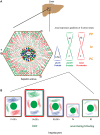
Schematic model of the main changes and adaptations showed by total β-catenins and its phosphorylated forms: pSer33 and p675 in the hepatic acinus under daytime restricted feeding protocol. (A) Zonal localization of the three different pools of β-catenin studied, total β-catenins (red), pSer33 β-catenin (blue), and p675 β-catenin (green) within the functional unit of liver, the hepatic acinus. This localization is represented in the form of gradients (triangles) according to the distinct zones of the acinus. PC was signaled and delimited by an orange circle. (B) Intracellular and plasma membrane localization of the β-catenin pools mentioned in (A) in hepatocytes at 11:00, 14:00, and 02:00 hours, as well as under Fa and Rf conditions. Hepatocytes size varies according to the time of the day and the feeding condition. Color filaments represent cytosolic localization of distinct β-catenins, and the green circle inside hepatocytes represent cell nucleus. CV, central vein; T, portal triad; PC, pericentral zone; Iz, intermediate zone; PP, periportal zone; C, cytosolic expression; M, plasma membrane expression.

Similar articles

Cited by

References

    1. Challet E, Caldelas I, Graff C, Pévet P. Synchronization of the molecular clockwork by light- and food-related cues in mammals. Biol Chem (2003) 384(5):711–9. 10.1515/BC.2003.079 - DOI - PubMed
    1. Mendoza J. Circadian clocks: setting time by food. J Neuroendocrinol (2007) 19(2):127–37. 10.1111/j.1365-2826.2006.01510.x - DOI - PubMed
    1. Mistlberger RE. Food-anticipatory circadian rhythms: concepts and methods. Eur J Neurosci (2009) 30(9):1718–29. 10.1111/j.1460-9568.2009.06965.x - DOI - PubMed
    1. Challet E, Solberg LC, Turek FW. Entrainment in calorie-restricted mice: conflicting zeitgebers and free-running conditions. Am J Physiol (1998) 274(6 Pt 2):R1751–61. - PubMed
    1. de Vasconcelos AP, Bartol-Munier I, Feillet CA, Gourmelen S, Pevet P, Challet E. Modifications of local cerebral glucose utilization during circadian food-anticipatory activity. Neuroscience (2006) 139(2):741–8. 10.1016/j.neuroscience.2005.12.045 - DOI - PubMed

LinkOut - more resources