. 2017 May 15;595(10):3143-3164.
doi: 10.1113/JP273891. Epub 2017 Apr 18.

Chronic alcohol feeding potentiates hormone-induced calcium signalling in hepatocytes

Affiliations

Chronic alcohol feeding potentiates hormone-induced calcium signalling in hepatocytes

Paula J Bartlett et al. J Physiol. .

Abstract

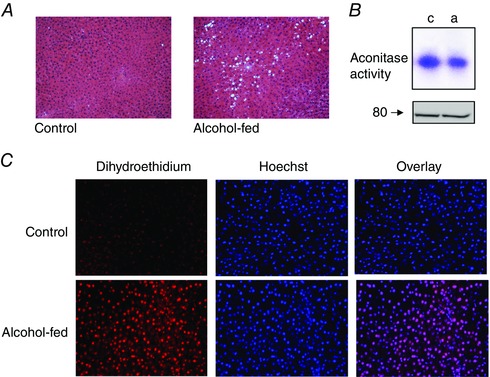
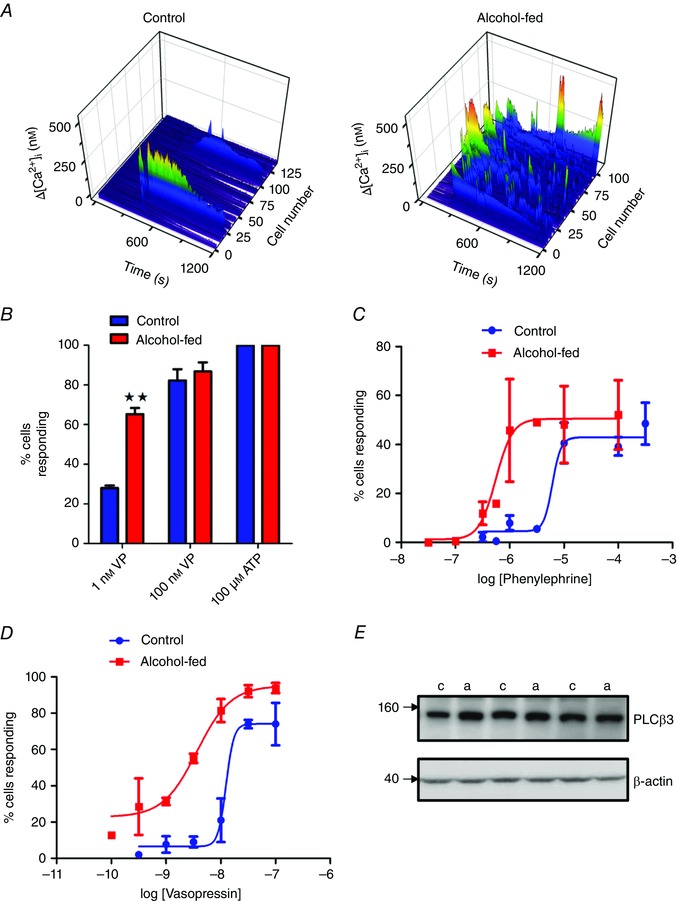
Chronic alcohol consumption causes a spectrum of liver diseases, but the pathogenic mechanisms driving the onset and progression of disease are not clearly defined. We show that chronic alcohol feeding sensitizes rat hepatocytes to Ca2+ -mobilizing hormones resulting in a leftward shift in the concentration-response relationship and the transition from oscillatory to more sustained and prolonged Ca2+ increases. Our data demonstrate that alcohol-dependent adaptation in the Ca2+ signalling pathway occurs at the level of hormone-induced inositol 1,4,5 trisphosphate (IP3 ) production and does not involve changes in the sensitivity of the IP3 receptor or size of internal Ca2+ stores. We suggest that prolonged and aberrant hormone-evoked Ca2+ increases may stimulate the production of mitochondrial reactive oxygen species and contribute to alcohol-induced hepatocyte injury. ABSTRACT: 'Adaptive' responses of the liver to chronic alcohol consumption may underlie the development of cell and tissue injury. Alcohol administration can perturb multiple signalling pathways including phosphoinositide-dependent cytosolic calcium ([Ca2+ ]i ) increases, which can adversely affect mitochondrial Ca2+ levels, reactive oxygen species production and energy metabolism. Our data indicate that chronic alcohol feeding induces a leftward shift in the dose-response for Ca2+ -mobilizing hormones resulting in more sustained and prolonged [Ca2+ ]i increases in both cultured hepatocytes and hepatocytes within the intact perfused liver. Ca2+ increases were initiated at lower hormone concentrations, and intercellular calcium wave propagation rates were faster in alcoholics compared to controls. Acute alcohol treatment (25 mm) completely inhibited hormone-induced calcium increases in control livers, but not after chronic alcohol-feeding, suggesting desensitization to the inhibitory actions of ethanol. Hormone-induced inositol 1,4,5 trisphosphate (IP3 ) accumulation and phospholipase C (PLC) activity were significantly potentiated in hepatocytes from alcohol-fed rats compared to controls. Removal of extracellular calcium, or chelation of intracellular calcium did not normalize the differences in hormone-stimulated PLC activity, indicating calcium-dependent PLCs are not upregulated by alcohol. We propose that the liver 'adapts' to chronic alcohol exposure by increasing hormone-dependent IP3 formation, leading to aberrant calcium increases, which may contribute to hepatocyte injury.

Keywords: alcohol; calcium signalling; hepatocyte.


Figures

Figure 1
Figure 1. Chronic alcohol feeding causes steatosis and oxidative damage in the liver
A, representative images of haematoxylin–eosin‐stained liver sections from control (left) and alcohol‐fed rats (right, 120 days). B, in‐gel detection of aconitase activity in liver mitochondria isolated from control (c) and alcohol‐fed (a) animals; total aconitase‐II protein levels are shown below. C, representative images of dihydroethidium‐ (left) and Hoechst 34580‐ (middle) stained frozen liver sections from an alcohol‐fed rat and its pair‐fed control. The oxidation of dihydroethidium produces ethidium which stains the nucleus a bright fluorescent red. The overlay of ethidium and Hoechst 34580 fluorescent images is shown to the right.
Figure 2
Figure 2. Effect of chronic alcohol feeding on vasopressin‐induced [Ca2+]i increases in the intact perfused liver
Livers from control or alcohol‐fed (60 days) littermates were isolated and loaded with fura2‐AM. Multi‐photon confocal images of fura2 fluorescence are shown in a linear greyscale and differential images of [Ca2+]i increases are depicted with a red overlay. Periportal (PP) and pericentral (PC) regions are indicated in first panel of each montage sequence. Control (A; panels 1–6) or alcohol‐fed (B; panels 1–6) livers were stimulated with increasing vasopressin (VP; 1–300 pm) concentrations and [Ca2+]i responses were monitored in real time. The time and VP concentration in the perfusate are shown on the top of each panel. Ca2+ increases in the absence of VP were observed in some hepatocytes from alcohol‐fed animals only (see red cell in B panel 2). Representative traces of VP‐dependent [Ca2+]i increases in individual hepatocytes from control (C) or alcohol‐fed (D) livers are shown. E, concentration dependence of VP‐induced [Ca2+]i responses in perfused livers of control (blue) or alcohol‐fed (red) rats. Data are the percentage of cells responding to the indicated VP concentration; mean ± SEM from three pairs of alcohol‐fed rats and their pair‐fed control littermates.
Figure 3
Figure 3. Chronic alcohol feeding sensitizes hepatocytes within intact perfused liver to vasopressin
Data from experiments shown in Fig. 2 were used to calculate the percentage of cells displaying Ca2+ oscillations (A) or sustained Ca2+ increases (B) in response to infusing the indicated VP concentrations. C, data show the average rates of intercellular Ca2+ wave propagation. The data were calculated for hormone concentrations that evoked Ca2+ increases that propagated across the entire lobule. The concentrations were 10–30 pm VP for alcohol‐fed livers and 100–300 pm VP for their littermate controls, reflecting the differences in hormone sensitivity between the two treatment groups.
Figure 4
Figure 4. Chronic alcohol feeding has no effect on ER Ca2+ load or rates of Ca2+ influx and efflux
Isolated hepatocytes were transfected with a membrane‐targeted Ca2+‐sensitive fluoresecent protein (LynD3cpv) or loaded with fura2 then treated with thapsigargin in the absence of extracellular Ca2+ to determine ER store size (area under curve, AUC). The subsequent repletion of extracellular Ca2+ followed by addition of excess BAPTA free acid was used to determine the rates of Ca2+ influx and efflux (τ), respectively. A, representative mean traces from control (blue) and alcohol‐fed (red) hepatocytes expressing LynD3cpv. B, summary table of results showing no differences between control and alcohol‐fed rats. ER store size are means ± SEM from three independent experiments. Ca2+ influx and efflux data are population means of all transfected cells in the field of view; n = 2 independent experiments; 8–15 cells per measurement (similar effects were observed with fura2‐loaded hepatocytes).
Figure 5
Figure 5. Chronic‐alcohol feeding desensitizes hepatocytes to the inhibitory effects of acute alcohol treatment
Livers from control or alcohol‐fed littermates were isolated and loaded with fluo‐8. Confocal images of fluo‐8 fluorescence are shown in a linear greyscale and differential images of [Ca2+]i increases are depicted with a red overlay. Control (A, B) and alcohol‐fed (C, D) livers were infused with increasing concentrations of vasopressin (VP) in the absence (A, C) or presence (B, D) of acute alcohol (25 mm) treatment. Time and VP concentration in the perfusate are shown on each image. Representative traces of VP‐dependent [Ca2+]i responses in individual hepatocytes are shown below each panel. E, concentration dependence of VP‐induced [Ca2+]i responses in the presence and absence of 25 mm alcohol. Data are the percentage of cells responding to indicated VP concentration; mean ± SEM from three pairs.
Figure 6
Figure 6. Chronic alcohol‐induced hypersensitivity to PLC‐coupled hormones is maintained in overnight hepatocyte cultures
Hepatocytes were cultured overnight in the absence of ethanol as described in the Methods. A, VP‐induced (1 nm) [Ca2+]i increases in hepatocytes from control and alcohol‐fed animals were determined in fura2‐loaded cells. The changes in [Ca2+]i levels (z axis) are shown in pseudocolour (blue low and red high) and plotted against time (x axis) for each individual cell from a single experiment (y axis). B, percentage of cells responding to indicated VP concentrations or maximal ATP stimulation in hepatocytes from control and alcohol‐fed animals. C, concentration dependence of phenylephrine elicited Ca2+ increases in overnight cultured hepatocytes from control (blue) and alcohol‐fed (red) animals. D, concentration dependence of vasopressin elicited Ca2+ increases in overnight cultured hepatocytes from animals fed alcohol for 120 days (red) and their pair‐fed controls (blue). E, Western blot analysis of PLCβ3 protein levels in cultured hepatocytes isolated from control (c) and alcohol‐fed (a) rats. No significant differences were detected. β‐Actin protein levels are shown for protein loading control.
Figure 7
Figure 7. The subcellular distribution and density of IP3 receptors is unaffected by chronic alcohol feeding
A, liver cryosections from control (i, iii, v, vii) or alcohol‐fed (ii, iv, vi, viii) animals were immunostained for IP3Rs or ZO‐1. Images show the lobular distribution pattern of IP3R type I (i, ii), IP3R type II (iii, iv), the co‐location pattern of ZO‐1 (red) and IP3R type II (green) in a merged image (v, vi) or the co‐location pattern of E‐cadherin and (red) and IP3R type II (green) in a merged image (vii, viii). B, IP3R type II protein levels were determined in membrane fractions prepared from cultured hepatocytes from control (c) or alcohol‐fed (a) rats. Summary data are shown in C normalized to SERCA, n = 4 pairs.
Figure 8
Figure 8. The sensitivity of IP3 receptors is unaffected by chronic alcohol feeding
A, representative traces showing [Ca2+]i responses elicited by photorelease of caged IP3 in individual hepatocytes isolated from control (blue) and alcohol‐fed (red) rats. Arrows denote the time point and number of UV flash events. B, summary data showing the percentage of cells responding to the indicated number of UV pulses. Comparison of type of Ca2+ responses observed in hepatocytes from control and alcohol‐fed animals in response to uncaging of IP3 show no difference in the percentage of cells displaying with no response (C), single Ca2+ spikes (D), Ca2+ oscillations (E) or sustained Ca2+ increases (F). Data are mean ± SEM from ≤60 cells from three pairs of control and alcohol‐fed rats.
Figure 9
Figure 9. Phospholipase C activity is potentiated by chronic alcohol feeding
Cellular IP3 levels were determined using a competitive radioligand binding assay (see Methods). A, representative experiment showing time‐course of VP‐induced IP3 production in hepatocytes from control and alcohol‐fed rats. B, summary data showing VP‐induced peak (30–90 s) and plateau (300 s) levels of IP3 in hepatocytes from alcohol‐fed rats and their pair‐fed controls. Data are expressed as fold increase over basal; n = 5 pairs, P ≤ 0.05. C, relative PLC activity was determined by assessment of hormone‐induced inositol polyphosphate (IPx) production in [3H]myo‐inositol‐labelled hepatocytes as described in the Methods. Data are mean ± SEM from five animal pairs. VP‐ and ATP‐induced PLC activity are significantly higher in hepatocytes from alcohol‐fed rats vs. controls; paired Student's t test ★★ P ≤ 0.001, P ≤ 0.05. E, isolated hepatocytes from control and alcohol‐fed rats were transfected with cDNAs encoding CFP‐ and YFP‐tagged PH domains of PLCδ4 to enable real time measurements of PLC activity (Bartlett et al. 2015). Representative traces showing the mean vasopressin‐ (3 nm, VP) and ATP‐ (100 μm) induced increases in the normalized FRET ratio in control (blue) or alcohol‐fed (red) hepatocytes. Data are representative of three independent experiments, n = 5–25 cells per experiment. Concentration‐dependence of VP‐induced PLC activity in hepatocytes after 60 (D) or 120 days (F) of alcohol feeding compared to their corresponding pair‐fed controls.
Figure 10
Figure 10. The effects of chronic alcohol feeding on PLC activity are not abolished by chelation of extra‐ and intracellular Ca2+
The Ca2+ sensitivity of PLC activity was assessed by comparing VP‐induced (100 nm) formation of inositol polyphosphates (IPx) in the absence of extracellular Ca2+ (nominal Ca2+) or in the presence of the intracellular Ca2+ chelator BAPTA‐AM (100 μm; 30 min pre‐incubation). A, analysis of hepatocytes isolated from control and alcohol‐fed rats revealed removal of extracellular Ca2+ and intracellular Ca2+ chelation attenuates PLC activity in both groups; however, VP‐induced IPx production remained significantly elevated in alcohol‐fed cells, paired Student's t test ★★ P ≤ 0.001, P ≤ 0.05. Data are mean ± SEM from three pairs. B, comparison of the ratio between VP‐induced responses from control (Ct) and alcohol‐fed (Af) cells shows that Ca2+ chelation does not abolish the effects of chronic alcohol feeding on PLC activity.

Comment in

  • Alcohol and calcium make a potent cocktail.
    Iwakiri Y, Nathanson MH. Iwakiri Y, et al. J Physiol. 2017 May 15;595(10):3109-3110. doi: 10.1113/JP274133. Epub 2017 Apr 18. J Physiol. 2017. PMID: 28295353 Free PMC article. No abstract available.

Similar articles

Cited by

References

    1. Abou Hashieh I, Mathieu S, Besson F & Gerolami A (1996). Inhibition of gap junction intercellular communications of cultured rat hepatocytes by ethanol: role of ethanol metabolism. J Hepatol 24, 360–367. - PubMed
    1. Albano E (2008a). New concepts in the pathogenesis of alcoholic liver disease. Expert Rev Gastroenterol Hepatol 2, 749–759. - PubMed
    1. Albano E (2008b). Oxidative mechanisms in the pathogenesis of alcoholic liver disease. Mol Aspects Med 29, 9–16. - PubMed
    1. Allen V, Swigart P, Cheung R, Cockcroft S & Katan M (1997). Regulation of inositol lipid‐specific phospholipase Cδ by changes in Ca2+ ion concentrations. Biochem J 327, 545–552. - PMC - PubMed
    1. Altamirano J & Bataller R (2011). Alcoholic liver disease: pathogenesis and new targets for therapy. Nat Rev Gastroenterol Hepatol 8, 491–501. - PubMed

Publication types

LinkOut - more resources