Clinical Trial
. 2017 Feb 21:6:e18554.
doi: 10.7554/eLife.18554.

High performance communication by people with paralysis using an intracortical brain-computer interface

Affiliations
Clinical Trial

High performance communication by people with paralysis using an intracortical brain-computer interface

Chethan Pandarinath et al. Elife. .

Abstract

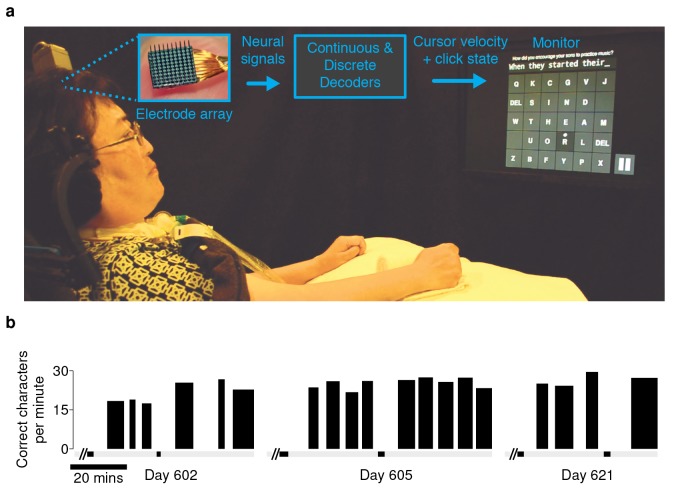
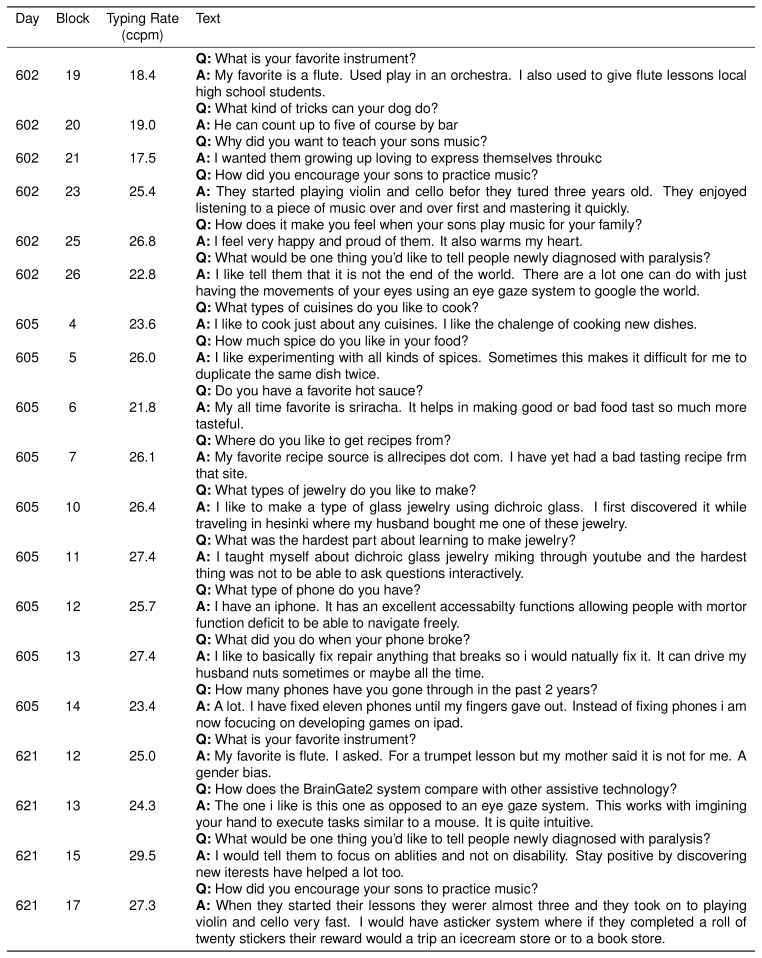
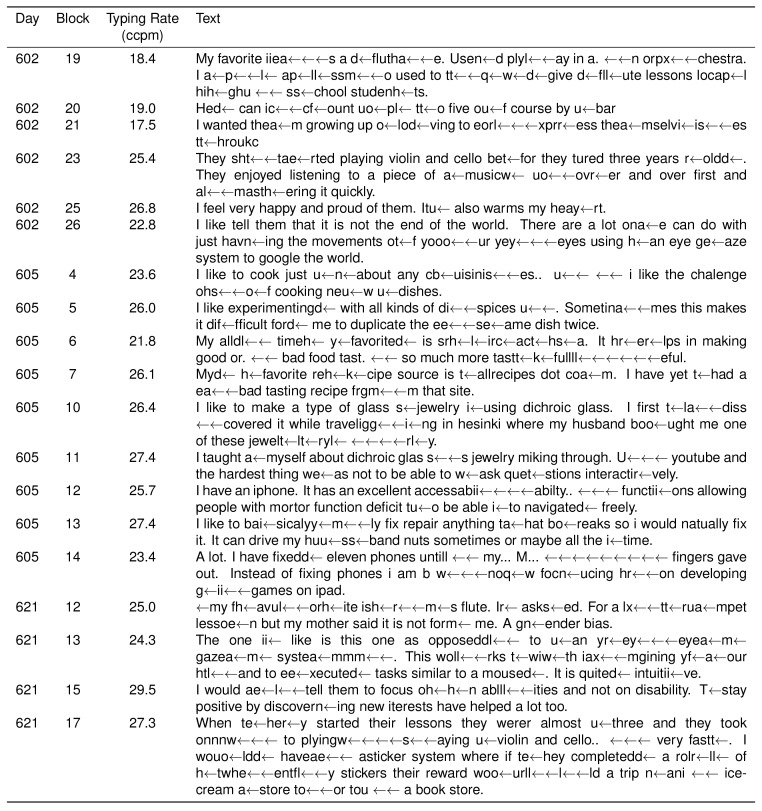
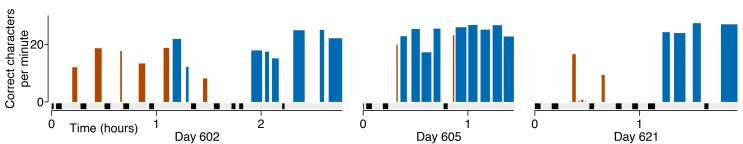
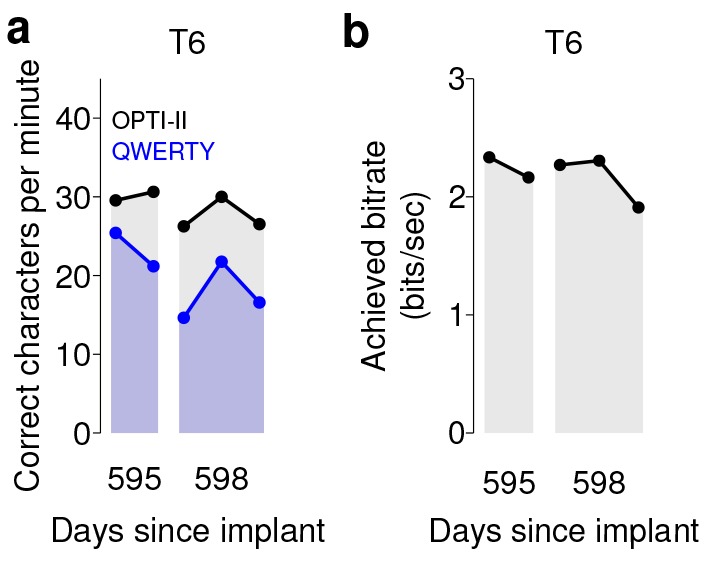
Brain-computer interfaces (BCIs) have the potential to restore communication for people with tetraplegia and anarthria by translating neural activity into control signals for assistive communication devices. While previous pre-clinical and clinical studies have demonstrated promising proofs-of-concept (Serruya et al., 2002; Simeral et al., 2011; Bacher et al., 2015; Nuyujukian et al., 2015; Aflalo et al., 2015; Gilja et al., 2015; Jarosiewicz et al., 2015; Wolpaw et al., 1998; Hwang et al., 2012; Spüler et al., 2012; Leuthardt et al., 2004; Taylor et al., 2002; Schalk et al., 2008; Moran, 2010; Brunner et al., 2011; Wang et al., 2013; Townsend and Platsko, 2016; Vansteensel et al., 2016; Nuyujukian et al., 2016; Carmena et al., 2003; Musallam et al., 2004; Santhanam et al., 2006; Hochberg et al., 2006; Ganguly et al., 2011; O'Doherty et al., 2011; Gilja et al., 2012), the performance of human clinical BCI systems is not yet high enough to support widespread adoption by people with physical limitations of speech. Here we report a high-performance intracortical BCI (iBCI) for communication, which was tested by three clinical trial participants with paralysis. The system leveraged advances in decoder design developed in prior pre-clinical and clinical studies (Gilja et al., 2015; Kao et al., 2016; Gilja et al., 2012). For all three participants, performance exceeded previous iBCIs (Bacher et al., 2015; Jarosiewicz et al., 2015) as measured by typing rate (by a factor of 1.4-4.2) and information throughput (by a factor of 2.2-4.0). This high level of performance demonstrates the potential utility of iBCIs as powerful assistive communication devices for people with limited motor function.Clinical Trial No: NCT00912041.

Keywords: ALS; assistive technology; brain-machine interface; human; human biology; medicine; neural prosthesis; neuroscience.


Conflict of interest statement

The authors declare that no competing interests exist.

Figures

Figure 1.
Figure 1.. Experimental setup and typing rates during free-paced question and answer sessions.
(a) Electrical activity was recorded using 96-channel silicon microelectrode arrays implanted in the hand area of motor cortex. Signals were filtered to extract multiunit spiking activity and high frequency field potentials, which were decoded to provide ‘point-and-click’ control of a computer cursor. (b) Performance achieved by participant T6 over the three days that question and answer sessions were conducted. The width of each black bar represents the duration of that particular block. The black bands along the gray bar just below the black blocks denote filter calibration times. The average typing rate across all blocks was 24.4 ± 3.3 correct characters per minute (mean ± s.d.). Video 1 shows an example of T6’s free typing. The filter calibration and assessment stages that preceded these typing blocks are detailed in Figure 1—figure supplement 3. DOI: http://dx.doi.org/10.7554/eLife.18554.003
Figure 1—figure supplement 1.
Figure 1—figure supplement 1.. Participant T6’s typed responses during the question and answer sessions.
During these sessions, T6 was prompted with questions and formulated responses de novo. She could engage and disengage the interface using a play/pause button (see Video 1). In these sessions, two successive spaces resulted in the insertion of the ‘.’ character in place of the first space. Consent was obtained to release T6’s typed text. DOI: http://dx.doi.org/10.7554/eLife.18554.004
Figure 1—figure supplement 2.
Figure 1—figure supplement 2.. Participant T6’s character selection during the question and answer sessions.
Same as previous table, but also includes all errors and backspace characters entered. DOI: http://dx.doi.org/10.7554/eLife.18554.005
Figure 1—figure supplement 3.
Figure 1—figure supplement 3.. Filter calibration, assessment, and typing blocks for the ‘free typing’ sessions performed with participant T6.
This expanded figure shows the free typing data presented in Figure 1, as well as the filter calibration and assessment stages that preceded the collection of those data. These sessions were not optimized for filter calibration, rather, performance was achieved and maintained by running evaluation or recalibration blocks at the participant or researchers’ discretion. The black bands along the gray bar just above the x-axis denote filter calibration time. Red bars denote evaluation blocks or blocks where T6 stopped the block early. Blue bars denote uninterrupted blocks of free typing. DOI: http://dx.doi.org/10.7554/eLife.18554.006
Figure 2.
Figure 2.. Performance in copy typing tasks.
(a) Layout for the OPTI-II keyboard (b) Layout for the QWERTY keyboard. (c) Layout for the ABDEF keyboard. (d) Examples of text typed during three copy typing evaluations with participants T6, T5, and T7. Each example shows the prompted text, followed by the characters typed within the first minute of the two-minute evaluation block. Box width surrounding each character denotes the time it took to select the character. ‘<’ character denotes selection of a backspace key. Colored symbols on the left correspond to blocks denoted in lower plots. (e) Performance in the copy typing task with the QWERTY (blue) and OPTI-II (black) keyboards across 5 days for participant T6. QWERTY performance was 23.9 ± 6.5 correct characters per minute (ccpm; mean ± s.d.), while OPTI-II performance was 31.6 ± 8.7 ccpm. X-axis denotes number of days since array was implanted. (f) Performance in the copy typing task with the QWERTY (blue) and OPTI-II (black) keyboards across 2 days for participant T5. Average performance was 36.1 ± 0.9 and 39.2 ± 1.2 ccpm for the QWERTY and OPTI-II keyboards, respectively. (g) Performance in the copy typing task with the ABCDEF (blue) and OPTI-II (black) keyboards across two days for participant T7. Average performance was 13.5 ± 1.9 and 12.3 ± 4.9 ccpm for the ABCDEF and OPTI-II keyboards, respectively. *Participant T7 did not use an HMM for selection. DOI: http://dx.doi.org/10.7554/eLife.18554.008
Figure 2—figure supplement 1.
Figure 2—figure supplement 1.. Data collection protocol for quantitative performance evaluation sessions.
Each research session followed a strict calibration and data collection protocol. This flow diagram is the research protocol for T6. T5 and T7’s protocols were very similar. T6 started with a glove-controlled movement calibration block (112 trials, 100 pixel target diameter, 750 ms hold time). T5 and T7 did not use data s, and instead that calibration block was substituted for a block where the cursor moved automatically while they attempted to move along with the cursor (‘open-loop’ calibration). This was followed by HMM click decoder calibration for T6. This was omitted for T7 as no HMM was used for sessions with him, but the cursor decoder was recalibrated at this stage. T5 did not need this either, as the HMM was trained on the same block as the cursor movement decoder. If the output of these two calibration steps resulted in a controllable cursor, then the data blocksets were started. Here, the decoders were recalibrated again based on a closed-loop control block, and data was collected under a strict timing protocol (see Figure 2—figure supplement 2). Blocksets were repeated as possible, at the discretion of the participant. Once a blockset was started for a particular research session, starting over with initial calibration was prohibited. DOI: http://dx.doi.org/10.7554/eLife.18554.009
Figure 2—figure supplement 2.
Figure 2—figure supplement 2.. Example of the blockset structure for quantitative performance evaluation sessions.
Each blockset began with a 3 min calibration or bias calculation block (purple). Breaks (green) were interspersed throughout the data collection. Each blockset consisted of three evaluation blocks (orange), two minutes each, that tested either copy typing or grid performance. Copy typing performance was evaluated with two keyboards (T6 and T5: QWERTY and OPTI-II, T7: ABCD and OPTI-II). Evaluation blocks were presented in a pseudo-randomized order (detailed in Materials and methods: Quantitative performance evaluations). In this example, T6 was first evaluated on a grid block, followed by a QWERTY cued typing block, followed by an OPTI-II cued typing block. DOI: http://dx.doi.org/10.7554/eLife.18554.010
Figure 2—figure supplement 3.
Figure 2—figure supplement 3.. Sentences used to evaluate performance in copy typing tasks.
Seven sentences were chosen for the copy typing task (presented in Figure 2). Sentence one is an English language pangram, i.e., it contains all the letters of the English alphabet, and is traditionally used to evaluate typing performance (e.g. Silfverberg et al., 2000). Sentences 2–4 are common English phrases that were easy for the participants to remember. Sentence five is the beginning of the ‘Rainbow Passage,’ commonly used in the speech pathology field to evaluate speech quality/deficits ([Fairbanks, 1960], pp. 124–139). Sentences 6 and 7 are conversational and were chosen to simulate the types of phrases an assistive communication device might be used to type in a conversation. DOI: http://dx.doi.org/10.7554/eLife.18554.011
Figure 3.
Figure 3.. Information throughput in the grid task.
(a) Performance in the grid task across 5 days for participant T6. T6 averaged 2.2 ± 0.4 bits per second (mean ± s.d.). (b) Performance in the grid task across 2 days for participant T5. T5 averaged 3.7 ± 0.4 bits per second. (c) Performance in the grid task across 2 days for participant T7. T7 averaged 1.4 ± 0.1 bits per second. X-axis denotes number of days since array was implanted. *Participant T7 did not use an HMM for selection. DOI: http://dx.doi.org/10.7554/eLife.18554.018
Figure 3—figure supplement 1.
Figure 3—figure supplement 1.. Performance of the HMM-based classifier during grid tasks with participants T6 and T5.
This figure replicates the analysis from Kim et al., 2011 (Kim et al., 2011) (Figure 5), which demonstrated the previous best discrete selection algorithm for a communication BCI. (a) Performance of the HMM for participant T6. The panel on the left shows all the clicks that occurred in the grid task across 5 days of quantitative performance evaluations. Each dot plots the position of a click relative to the center of the cued target (blue - correct click, red - false click), and the green square shows the size of a single grid target. The right panel shows a histogram of the distance between click location and the center of the target for all clicks. T6 clicked on the correct target 92.6% of the time (1007/1087 total clicks). (b) Performance of the HMM for participant T7 in the grid task over 4 days of quantitative performance evaluations. T5 clicked on the correct target 97.7% of the time (2325/2379 total clicks). As shown, for both participants, when incorrect clicks did occur, they primarily occurred close to the edge of the desired target. DOI: http://dx.doi.org/10.7554/eLife.18554.019
Figure 3—figure supplement 2.
Figure 3—figure supplement 2.. Information throughput for participant T5 when using a dense grid.
Performance in the grid task for participant T5 when measured with a denser grid (9 × 9, as opposed to the 6 × 6 grid used for all participants for the data shown in Figure 3). An example of T5’s performance in the 9 × 9 grid is shown in Video 10. DOI: http://dx.doi.org/10.7554/eLife.18554.020
Figure 4.
Figure 4.. Performance of the BCI with movements suppressed.
A potential concern is that the demonstrated performance improvement for participant T6 relative to previous studies is due to her retained movement ability. Participant T6 was capable of dexterous finger movements (as opposed to participants T5 and T7, who retained no functional movements of their limbs). To control for the possibility that physical movements underlie the demonstrated improvement in neural control, we measured T6’s BCI performance during the same quantitative performance evaluation tasks, but asked her to suppress her movements as best as she could. In these sessions, decoders were calibrated based on imagined (rather than attempted) finger movements. (a) During copy typing evaluations with movements suppressed, T6’s average performance using the OPTI-II keyboard was 28.6 ± 2.0 ccpm (mean ± s.d.), and her average performance using the QWERTY keyboard was 19.9 ± 4.3 ccpm (as discussed in the main text, her performance while moving freely was 31.6 ± 8.7 ccpm and 23.9 ± 6.5 ccpm for the OPTI-II and QWERTY keyboards, respectively). (b) During grid evaluations with movements suppressed, T6’s achieved bitrate was 2.2 ± 0.17 bps (compared to 2.2 ± 0.4 bps while moving freely). We note that using the BCI while suppressing movements is a more difficult and cognitively demanding task - since the participant’s natural, intuitive attempts to move actually generate physical movements, she needed instead to imagine movements, and restrict her motor cortical activity to patterns that do not generate movement. (This is supported by the participants own comment regarding the difficulty in controlling the BCI while imagining movement without actually moving: ‘It is a learning curve for me to not move while imagining.’) Despite this additional cognitive demand, performance with movements suppressed was quite similar to performance when the participant moved freely (within 0–20%) - in all three cases, the differences in performance were not significant (p>0.2 in all cases, Student’s t test). Data are from T6’s trial days 595 and 598. DOI: http://dx.doi.org/10.7554/eLife.18554.027
Figure 4—figure supplement 1.
Figure 4—figure supplement 1.. Participant T6’s movements are greatly reduced when movements are actively suppressed.
In the previous analysis (Figure 4), we demonstrated that T6’s performance was largely unchanged even when she actively suppressed her movements. Here we quantified the degree to which movements were suppressed during those sessions. We first analyzed the participant’s movements during decoder calibration (panels a and b) and then closed-loop BCI control (panel c). For decoder calibration, we compared freely moving sessions and sessions in which movements were suppressed (see Materials and methods: Quantifying movement suppression). Decoders were calibrated using a center-out-and-back task, with the cursor’s position tied to the measured finger position (freely moving sessions) or with the cursor’s position following pre-programmed movements (i.e., ‘open-loop’ calibration) and finger movements were imagined (movement suppressed sessions). For each condition (i.e., freely moving vs. suppressed movement), we measured finger position as a function of time (relative to the starting position for each trial), and averaged these positions across all trials for a given target direction (the position of each pair of traces denotes the target’s position relative to the center target). (a) During movement-based decoder calibration (freely moving sessions), thumb movements (red) controlled the vertical axis, while index finger movements (blue) controlled the horizontal axis. Horizontal scale bars represent 200 ms, and the vertical scale bar represents 100 units on the glove sensor scale (arbitrary units). (b) During open-loop decoder calibration (movement suppressed sessions), in which T6 was asked to simply imagine finger movements but avoid moving to the best of her abilities, finger movements were largely suppressed but minute movement was still detectable. Scale bars match the previous panel. Overall, during decoder calibration, movements were greatly reduced (p<0.01, paired Student’s t test), and the median suppression ratio was a factor of 7.2 (index finger) and 12.6 (thumb). (c) We also quantified the amount of movement during closed-loop BCI control (grid task) in sessions in which movements were suppressed. Because individual trials were highly variable (targets appeared in random locations during the grid task), we grouped trials by the target direction (i.e., the angle between the previous target and the prompted target for the current trial). The position of each pair of traces in the circle denotes the target direction. To ensure that any minute movements were captured in the analysis, the absolute value (rather than the signed value) of the finger position was taken prior to averaging across trials. Scale bars match the previous panel. As shown, movement during closed-loop BCI control was comparable to or less than movement during decoder calibration (panel b), which itself was a factor of 7.2–12.6 times less than movement during movement-based decoder calibration (panel a). DOI: http://dx.doi.org/10.7554/eLife.18554.028
Figure 5.
Figure 5.. Signal quality on the participants’ electrode arrays.
Each panel shows the recorded threshold crossing waveforms for all 96 channels of a given array for a 60 s period during the participant’s first quantitative performance evaluation block. T6 had a single implanted array, while T5 and T7 had two implanted arrays. Scale bars (lower left corner of each panel) represent 150 µV (vertical) and 0.5 milliseconds (horizontal). Voltages were analog band-pass filtered between 0.3 Hz and 7.5 kHz, then sampled by the NeuroPort system at 30 kHz. The resulting signals were then digitally high-pass filtered (500 Hz cutoff frequency) and re-referenced using common average referencing. Thresholds were set at −4.5 times the root-mean-squared (r.m.s.) voltage value for each channel. Channels without a corresponding trace did not have any threshold crossing events during this time period. Data are from sessions 570, 56, and 539 days post-implant for T6, T5, and T7, respectively. DOI: http://dx.doi.org/10.7554/eLife.18554.029
Figure 5—figure supplement 1.
Figure 5—figure supplement 1.. HF-LFP signals have similar time course and condition dependence to spiking activity.
Control algorithms for T6 incorporated high-frequency LFP power signals (HF-LFP; see Materials and methods). A potential concern with a power signal is that it may pick up artifacts related to EMG from eye movements. Here we analyze activity during a decoder calibration block to show that HF-LFP signals have a strikingly similar time course and condition dependence as spiking activity. (a) Sample of the signals recorded on T6’s array during a decoder calibration block. Some channels show discernible single or multiunit activity (threshold crossings), while others do not. Neural data was processed as in Figure 5, with thresholds set to −4 times the r.m.s. voltage value for each channel. Scale bars (lower left corner) represent 150 µV (vertical) and 0.5 milliseconds (horizontal). (b) Target positions and corresponding colors used to label each condition in the subsequent panels. (c) Threshold crossing rates as a function of time for each condition (movement to a given target location), beginning at the time of target onset, for five example channels with discernable threshold crossing activity. Each trace represents the mean ± s.e.m. threshold crossing rate for a given condition, computed across seven trials for each condition. Horizontal scale bar represents 100 ms, vertical scale bar represents 40 threshold crossings / sec. Traces from individual trials were smoothed by convolving with a Gaussian kernel with 50 ms s.d. prior to mean / standard deviation calculations. (d) Same plots, but depicting HF-LFP power instead of threshold crossing rates, for a different set of example channels that did not have discernible multiunit activity. Horizontal scale bar is again 100 ms, vertical scale (HF-LFP power) is in arbitrary units. The same trials as panel (c) above were used. As shown, HF-LFP power signals display a similar time course following target onset, as well as degree of condition dependence, as threshold crossing activity. Data are from T6’s post-implant day 570. DOI: http://dx.doi.org/10.7554/eLife.18554.030
Figure 5—figure supplement 2.
Figure 5—figure supplement 2.. HF-LFP signals show a similar time course and condition dependence to spiking activity during auditory-cued tasks in which the participant had her eyes closed.
Following Figure 5—figure supplement 1, to further rule out the possibility that HF-LFP signals are related to eye movements, we include data recorded as T6 performed an auditory-cued task with her eyes closed as she attempted multiple single-joint movements. The task included a delay period in which she was prompted (via an auditory cue) about the upcoming movement attempt, but was asked to not attempt the movement until receiving a go cue. (a) Sample of the signals recorded on T6’s array during the attempted movement. Some channels show discernible single or multiunit activity (threshold crossings), while others do not. Neural data was processed as in Figure 5, with thresholds set to −4 times the r.m.s. voltage value for each channel. Scale bars (lower left corner) represent 150 µV (vertical) and 0.5 milliseconds (horizontal). (b) Threshold crossing rates as a function of time for attempted single-joint flexion movements (index finger: red, thumb: yellow, wrist: light green, elbow: darker green) for five example channels with discernable threshold crossing activity. Each trace represents the mean ± s.e.m. threshold crossing rate for a given condition, computed across 20 trials for each condition. Horizontal scale bar represents 500 ms, vertical scale bar represents 20 threshold crossings / sec. Red box denotes the time each movement was prompted, and blue box denotes the time of the go cue (break in the traces is due to the randomized delay period across trials). As shown, activity is indicative of both planning and movement attempt epochs. Traces from individual trials were smoothed by convolving with a Gaussian kernel with 50 ms s.d. prior to mean / standard deviation calculations. (d) Same plots, but depicting HF-LFP power instead of threshold crossing rates, for a different set of example channels that did not have discernible multiunit activity. Horizontal scale bar is again 500 ms, vertical scale (HF-LFP power) is in arbitrary units. The same trials as panel (c) above were used. Because there were no visual cues and the participant had her eyes closed, it is unlikely that the participant was making condition dependent eye movements. However, as shown, even in the absence of visual cues, HF-LFP power signals display a similar time course following target onset, degree of planning- and movement-related activity, and degree of condition dependence, as threshold crossing activity. Data are from T6’s post-implant day 488. DOI: http://dx.doi.org/10.7554/eLife.18554.031

References

    1. Achtman N, Afshar A, Santhanam G, Yu BM, Ryu SI, Shenoy KV. Free-paced high-performance brain-computer interfaces. Journal of Neural Engineering. 2007;4:336–347. doi: 10.1088/1741-2560/4/3/018. - DOI - PubMed
    1. Aflalo T, Kellis S, Klaes C, Lee B, Shi Y, Pejsa K, Shanfield K, Hayes-Jackson S, Aisen M, Heck C, Liu C, Andersen RA. Decoding motor imagery from the posterior parietal cortex of a tetraplegic human. Science. 2015;348:906–910. doi: 10.1126/science.aaa5417. - DOI - PMC - PubMed
    1. Bacher D, Jarosiewicz B, Masse NY, Stavisky SD, Simeral JD, Newell K, Oakley EM, Cash SS, Friehs G, Hochberg LR. Neural Point-and-Click communication by a person with incomplete Locked-In Syndrome. Neurorehabilitation and Neural Repair. 2015;29:462–471. doi: 10.1177/1545968314554624. - DOI - PMC - PubMed
    1. Bishop W, Chestek CC, Gilja V, Nuyujukian P, Foster JD, Ryu SI, Shenoy KV, Yu BM. Self-recalibrating classifiers for intracortical brain-computer interfaces. Journal of Neural Engineering. 2014;11:026001. doi: 10.1088/1741-2560/11/2/026001. - DOI - PMC - PubMed
    1. Blabe CH, Gilja V, Chestek CA, Shenoy KV, Anderson KD, Henderson JM. Assessment of brain-machine interfaces from the perspective of people with paralysis. Journal of Neural Engineering. 2015;12:043002. doi: 10.1088/1741-2560/12/4/043002. - DOI - PMC - PubMed

Publication types

Associated data