. 2017 Feb 21:8:14294.
doi: 10.1038/ncomms14294.

An integrative approach unveils FOSL1 as an oncogene vulnerability in KRAS-driven lung and pancreatic cancer

Affiliations

An integrative approach unveils FOSL1 as an oncogene vulnerability in KRAS-driven lung and pancreatic cancer

Adrian Vallejo et al. Nat Commun. .

Abstract

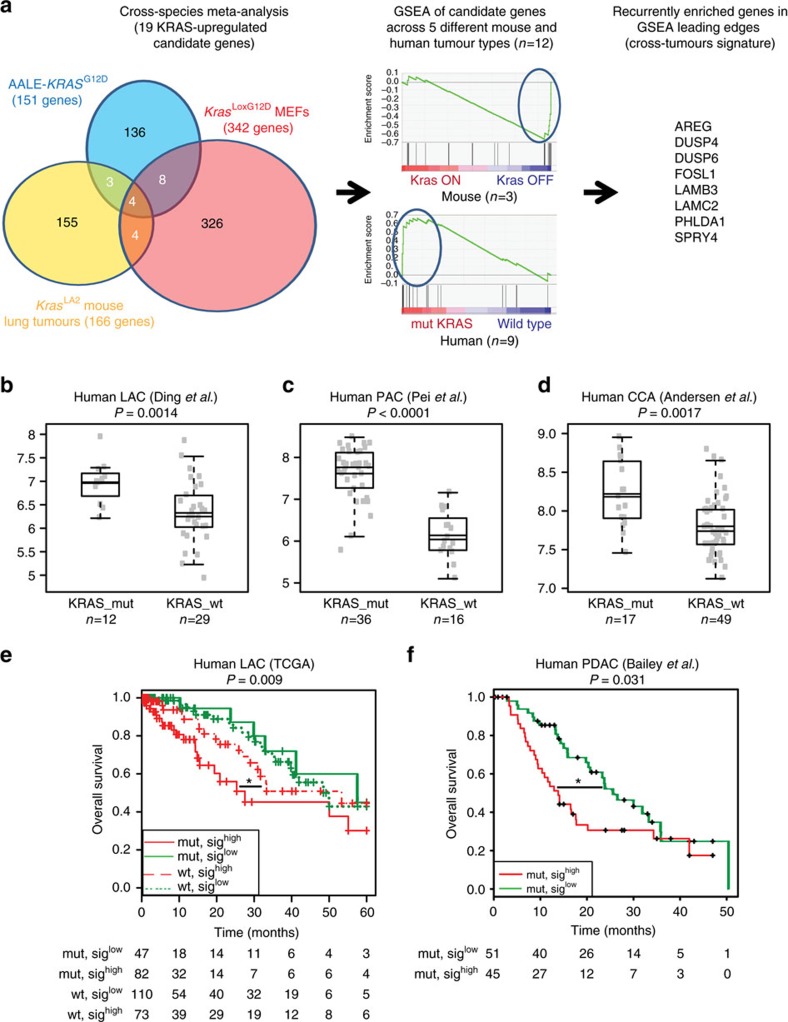
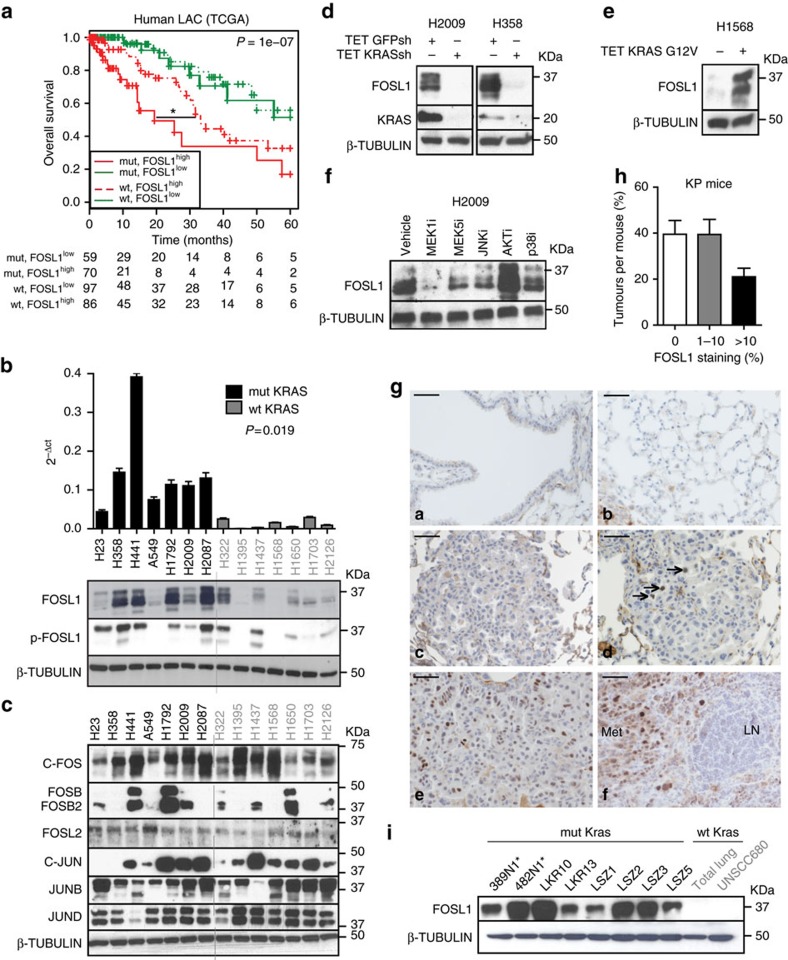
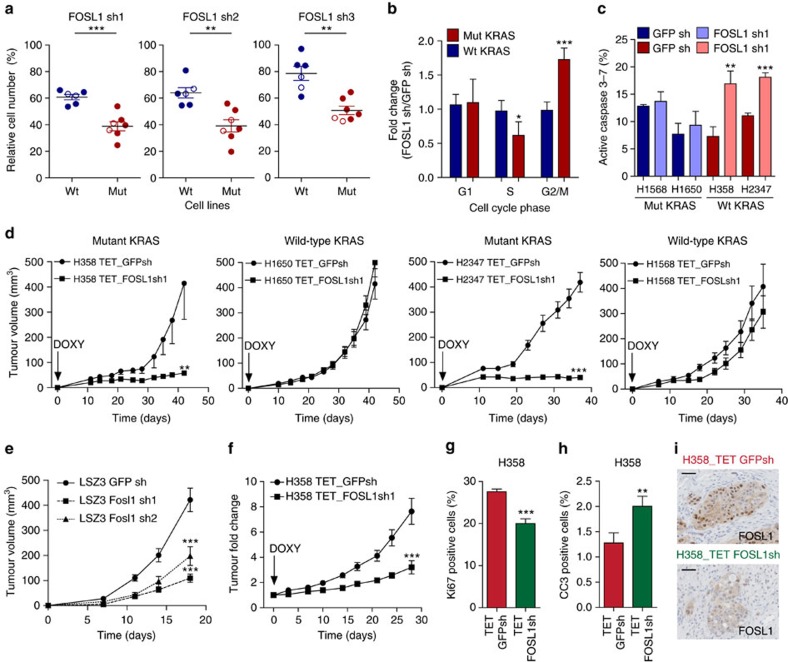
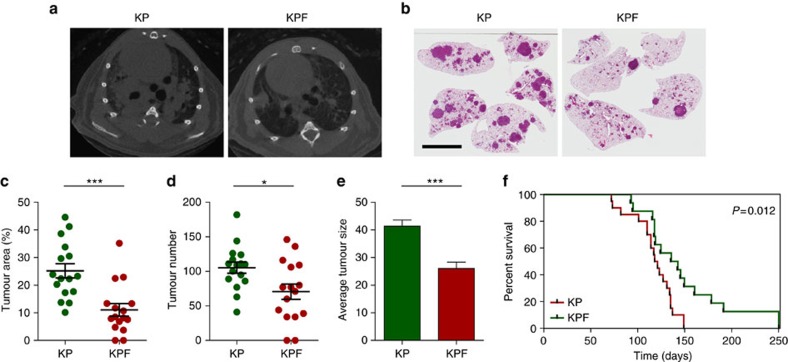
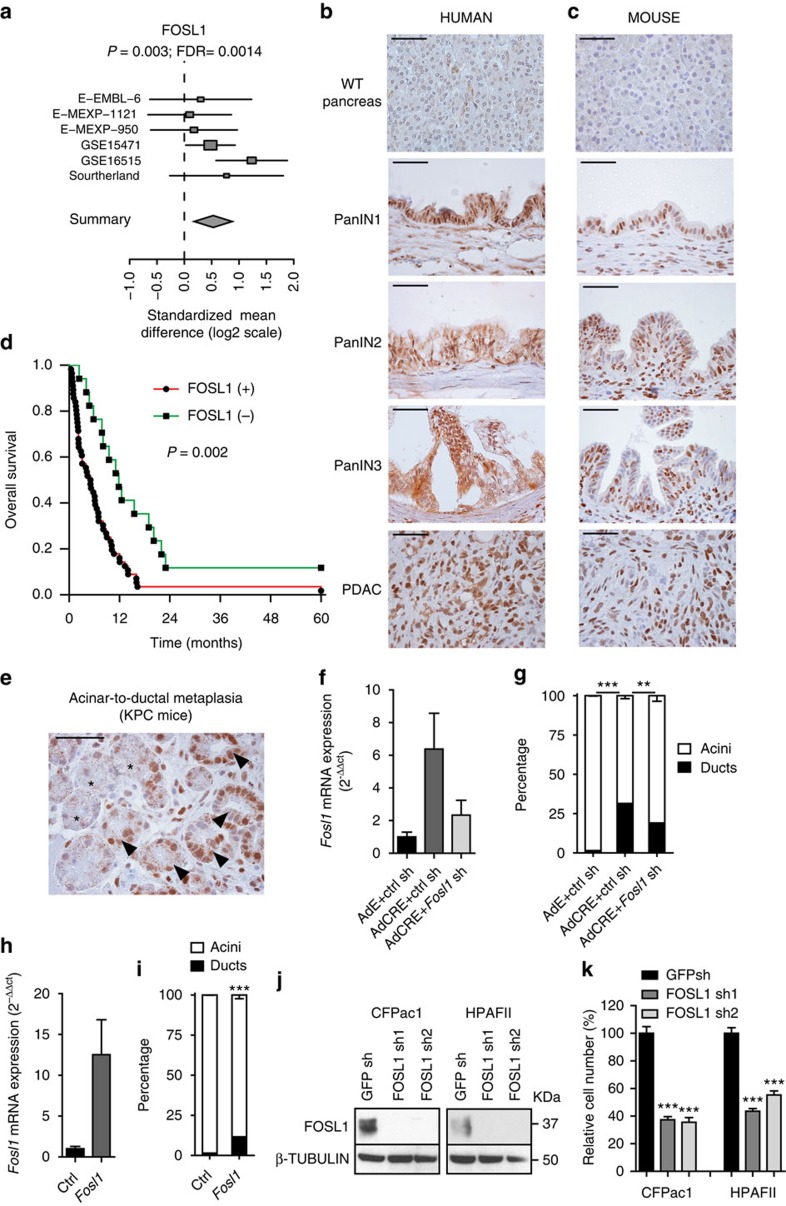
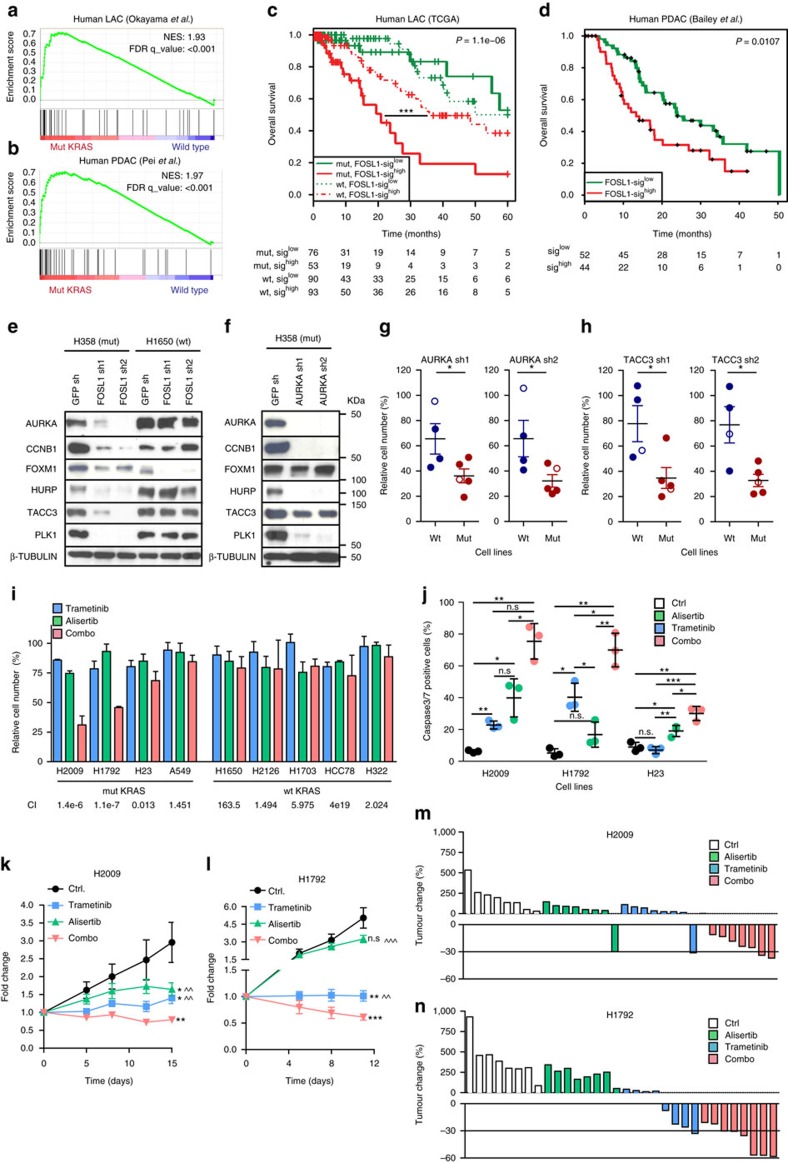
KRAS mutated tumours represent a large fraction of human cancers, but the vast majority remains refractory to current clinical therapies. Thus, a deeper understanding of the molecular mechanisms triggered by KRAS oncogene may yield alternative therapeutic strategies. Here we report the identification of a common transcriptional signature across mutant KRAS cancers of distinct tissue origin that includes the transcription factor FOSL1. High FOSL1 expression identifies mutant KRAS lung and pancreatic cancer patients with the worst survival outcome. Furthermore, FOSL1 genetic inhibition is detrimental to both KRAS-driven tumour types. Mechanistically, FOSL1 links the KRAS oncogene to components of the mitotic machinery, a pathway previously postulated to function orthogonally to oncogenic KRAS. FOSL1 targets include AURKA, whose inhibition impairs viability of mutant KRAS cells. Lastly, combination of AURKA and MEK inhibitors induces a deleterious effect on mutant KRAS cells. Our findings unveil KRAS downstream effectors that provide opportunities to treat KRAS-driven cancers.


Conflict of interest statement

The authors declare no competing financial interests.

Figures

Figure 1
Figure 1. Identification of cross-tumours KRAS-dependent genes.
(a) Workflow of the gene-expression strategy for the identification of mutant KRAS-regulated genes. (Left) Venn's diagram summarizing the cross-species meta-analysis. In white are genes over-expressed in mutant KRAS cells or tumours over wild-type KRAS controls (n=19). Blue: Human lung immortalized bronchoepithelial cells (AALE cells) expressing exogenous KRASG12D compared to wild-type KRAS-expressing cells. Orange: KrasLA2 mouse LAC tumours compared to normal lung tissue. Red: Kras-activated mouse embryo fibroblasts compared to wild-type Kras mouse embryo fibroblasts. (Center) GSEA graphs showing the number of mouse and human cancer data sets used to query the relevance of the initial 19 candidate genes identified. (Right) An eight-gene cross-tumours KRAS signature including genes recurrently found in more than 50% of the GSEA leading edges. (bd) Box plots of classification analyses based on the expression of the eight-gene cross-tumours signature in LAC, PDAC and CCA data sets. P values obtained using Student's t-test. (e) Kaplan–Meier plot of LAC patients for the expression of the eight-gene cross-tumours signature taking into account KRAS status. Wild-type group excluded patients with genetic alterations in non-KRAS oncogene drivers to prevent any bias in survival due to administration of targeted therapies. P values obtained using the log-rank test (Mantel Cox). (f) Kaplan–Meier plot of PDAC patients for the expression of the eight-gene cross-tumours signature. P values obtained using the log-rank test (Mantel-Cox). *P<0.05.
Figure 2
Figure 2. Upregulation of FOSL1 in LAC.
(a) Kaplan–Meier plot of the LAC TCGA data set for FOSL1 expression based on KRAS status. Wild-type group excluded patients with genetic alterations in non-KRAS oncogene drivers to prevent outcome bias due to patients treated with targeted therapies. P values obtained using the log-rank test (Mantel-Cox). *P<0.05. (b) mRNA and protein analyses by qPCR and western blot, respectively, for indicated genes and proteins in a panel of mutant (n=7) and wild-type (n=7) KRAS cell lines. mRNA levels were compared by Student's t-test. (c) Western blot analysis for members of the FOS and JUN families. (d) Western blot showing FOSL1 expression levels after KRAS inhibition with a specific shRNA in mutant KRAS cells (H2009 and H358). (e) Western blot to detect FOSL1 protein expression upon KRAS expression in wild-type KRAS cells (H1568). (f) Western blot of H2009 cells treated with U0126 (MEKi, 10 μM), BIX02189 (MEK5i, 10 μM), SB203580 (JNKi, 20 μM), LY294002 (AKTi, 10 μM) and SB203580 (p38i, 20 μM) and probed with indicated antibodies. (g) Expression of FOSL1 by immunohistochemistry in KrasLSLG12D, p53f/f mice (n=5; a: normal alveolar epithelium; b: normal bronchiolar epithelium; c,d: adenoma; e: adenocarcinoma; f: lymph node tumour metastasis (Met)). Scale bar 50 μm. (h) Quantification of FOSL1 staining in lung tumours of KrasLSLG12D, p53f/f(KP) mice. (i) FOSL1 protein expression in mouse LAC cells derived from KrasLA2 (LKR10, LKR13), KrasLSLG12D (LSZ1-5) and KrasLSLG12D, p53f/f (389N1, 482N1), squamous cell lung carcinoma cells (UNSCC680) and normal lung. Asterisk indicates metastatic cell lines isolated from the lymph nodes. QPCR plots and western blot images are representative of three independent experiments with different cell lysates. Error bars correspond to s.d.
Figure 3
Figure 3. Impact of FOSL1 inhibition on LAC cell proliferation in vitro and in vivo.
(a) Percent cell viability of human wild-type (HCC78, H1437, H1568, H1650, H1703 and H2126) and mutant (H23, H358, H441, A549, H1792, H2009 and H2347) KRAS LAC cell lines with three independent FOSL1 shRNAs. Data are relative to number of cells expressing a GFP shRNA. Relative cell number was assessed by an MTS assay for 4 days and repeated three times. (b) Cell cycle analysis using an EdU incorporation assay of mutant (H358 and H2347) and wild-type (H1568 and H1650) KRAS cell lines expressing an inducible shRNA against GFP or FOSL1. shRNA expression was induced by doxycycline (1 μg ml−1) for 3 days and then cells plated for 24 h before analysis. Data are normalized to cells expressing a GFP shRNA. Result is average of three independent experiments. Error bars correspond to s.d. (c) Analysis of active caspase 3/7 in the same cells as in (b). Data are normalized to cells expressing a GFP shRNA. Result is average of three independent experiments. Error bars correspond to s.d. (d) Average tumour volume of xenografts from H358, H2347, H1568 and H1650 cells expressing an inducible GFP or FOSL1 shRNA (n=8–12 per group). Mice were fed 2 mg ml−1 doxycycline plus 5% sucrose in drinking water when cells were implanted. Error bars correspond to s.e.m. (e) Average tumour volume of xenografts from mouse LAC cells (LSZ3) transduced with a control GPF shRNA (circle) and two shRNAs (square and triangle) against Fosl1 (n=8 per group). Error bars correspond to s.e.m. (f) Average tumour volume change of xenografts from H358 cells with inducible GFP and FOSL1 shRNAs (n=12 per group) relative to start of doxycycline treatment. Doxycycline treatment (2 mg ml−1 doxycycline plus 5% sucrose in drinking water) started at day 18 when tumours had an average volume of 80–100 mm3. Error bars correspond to s.e.m. ***P<0.001. (g) Analysis of Ki67 positive cells in representative areas (n=15 per group) of tumours in (f). Error bars correspond to s.e.m. ***P<0.001. (h) Analysis of cleaved caspase 3 positive cells in representative areas (n=10 per group) of tumours in (f). Error bars correspond to s.e.m. P value obtained using a Student's t-test. *P<0.05; **P<0.01. ***P<0.001. (i) Immunohistochemistry to detect FOSL1 expression in representative sections of the same tumours as in (f). Scale bars 50 μm.
Figure 4
Figure 4. Fosl1 is required in a genetically engineered mouse model of advanced LAC.
(a) Representative microCT scans of tumours in KrasLSLG12D/+; Trp53flox/flox; Fosl1+/+ (KP) and KrasLSL-G12D/+; Trp53flox/flox; Fosl1flox/flox (KPF) mice treated with AdCre and allowed to develop tumours for 12 weeks. (b) Representative H and E stained sections of KP and KPF lungs. Scale bar is 6 mm. (c) Dot plot of the quantification of tumour area in KP (n=16) and KPF (n=16) groups (n, number of mice per group). Error bars correspond to s.e.m. P value obtained using a Mann–Whitney test. (d) Dot plot showing mean number of tumours per mouse in KP and KPF mice. Error bars correspond to s.e.m. P value obtained using Student's t-test. (e) Bar graph of the average of tumour size in KP and KPF groups. Error bars correspond to s.e.m. P values obtained using Student's t-test. (f) Kaplan–Meier plot of KP (n=20) and KPF (n=16) mice. P values obtained using the log-rank test (Mantel-Cox). *P<0.05; ***P<0.001.
Figure 5
Figure 5. Requirement for FOSL1 expression in PDAC.
(a) Standardized Mean Difference (log2 scale) of FOSL1 mRNA expression meta-analysis across six PDAC data sets. (b,c) FOSL1 protein expression by immunohistochemistry in normal pancreas, pancreatic intraepithelial neoplasias and PDAC of human (b) and mouse (c) tissues. Scale bars: 50 μm. (d) Kaplan–Meier plot of FOSL1 protein expression in PDAC patients. (e) Immunohistochemistry for FOSL1 detection in normal pancreas acini (stars) and ADM (arrowheads) in p48cre/+, KrasloxG12D, Trp53Δ/Δ (KPC) mice. (f) Fosl1 mRNA expression in acinar cells from KrasloxG12D mice treated with control adenovirus (AdE), adenovirus Cre (AdCre) and AdCre plus a shRNA targeting Fosl1. (g) Percentage of acinar (white) and ductal (black) clusters in the same ADM experiment as in (f). Two independent organoid cultures were seeded in triplicate. After 5 days in culture, three areas were counted at random in each triplicate. (h) Fosl1 mRNA expression in acinar cells from Kras+/+ mice expressing an empty (ctrl) and a Fosl1-expressing vector. (i) Percentage of acinar (white) and ductal (black) clusters in the same ADM experiment as in (h). Two independent organoid cultures were seeded in triplicate. After 5 days in culture, three areas were counted at random in each triplicate. (j) Western blot analysis of FOSL1 protein in mutant KRAS PDAC cells (CFPac1 and HPAFII) transduced with two independent FOSL1 shRNAs. (k) Relative cell number assessed by MTS of mutant KRAS PDAC cells upon FOSL1 inhibition. Result is representative of three independent experiments. Error bars correspond to s.d. P value obtained using Student's t-test. **P<0.01; ***P<0.001.
Figure 6
Figure 6. FOSL1 regulates a transcriptional program including genes involved in mitosis progression amenable to pharmacological inhibition.
(a,b) GSEA of human LAC (a) and PDAC (b) data sets comparing mutant KRAS patients to wild-type KRAS patients. (c) Survival analysis of LAC patients (TCGA data set) stratified by KRAS status and expression of a FOSL1 signature. (d) Survival analysis of PDAC patients stratified by expression of a FOSL1 signature. P values obtained using the log-rank test (Mantel-Cox). (e) Western blot analysis on the indicated mitotic genes in mutant (H358) and wild-type (H1650) KRAS LAC cells after FOSL1 inhibition by two independent shRNAs. Western blot is representative of three independent western blots with different lysates. (f) Western blot analysis on the indicated mitotic genes in mutant KRAS LAC cells (H358) after AURKA inhibition by two independent shRNAs. Western blot is representative of three independent western blots with different lysates. (g,h) MTS assay of wild-type (HCC78, H1437, H1650 and H2126) and mutant KRAS (H23, H358, A539, H2009 and H2347) treated with two independent shRNAs targeting AURKA (g) or TACC3 (h). Open circles represent cell lines with similar population doubling time. Error bars correspond to s.d. Assay is average of two independent experiments. (i) MTS analysis of mutant and wild-type KRAS cells lines treated with alisertib (500 nM), trametinib (500 nM) or both. CI: combination index. CI<1 in bold. Results are average of four different independent treatment experiments performed in triplicate. (j) Analysis of active caspase 3/7 cells in H2009, H1792 and H23 cells treated with vehicle, alisertib (1 μM), trametinib (1 μM) or both for 72 h. P values obtained using Student's t-test. (k,l) Analysis of tumour volume of mice injected with H2009 or H1792 cell lines and orally administered vehicle, alisertib (25 mg kg−1), trametinib (1 mg kg−1) or both. Tumours were grown until average tumour volume ranged from 80 to 100 mm3 and randomized before treatment starts. Error bars correspond to s.e.m (n=8 per group). Comparisons to control group: *P<0.05; **P<0.01; ***P<0.001. Comparisons to combo group: ^^P<0.01; ^^^P<0.001. P values obtained using Student's t-test. (m,n) Analysis of tumour change from samples in (i,j) at the end of each experiment (n=8 per group).

References

    1. Pylayeva-Gupta Y., Grabocka E. & Bar-Sagi D. RAS oncogenes: weaving a tumorigenic web. Nat. Rev. Cancer 11, 761–774 (2011). - PMC - PubMed
    1. Johnson L. et al.. Somatic activation of the K-ras oncogene causes early onset lung cancer in mice. Nature 410, 1111–1116 (2001). - PubMed
    1. Hingorani S. R. et al.. Preinvasive and invasive ductal pancreatic cancer and its early detection in the mouse. Cancer Cell 4, 437–450 (2003). - PubMed
    1. Haigis K. M. et al.. Differential effects of oncogenic K-Ras and N-Ras on proliferation, differentiation and tumor progression in the colon. Nat. Genet. 40, 600–608 (2008). - PMC - PubMed
    1. O'Dell M. R. et al.. Kras(G12D) and p53 mutation cause primary intrahepatic cholangiocarcinoma. Cancer Res. 72, 1557–1567 (2012). - PMC - PubMed

Publication types

MeSH terms

Substances