. 2017 Feb 21:8:14256.
doi: 10.1038/ncomms14256.

Impact of genetic background and experimental reproducibility on identifying chemical compounds with robust longevity effects

Affiliations

Impact of genetic background and experimental reproducibility on identifying chemical compounds with robust longevity effects

Mark Lucanic et al. Nat Commun. .

Abstract

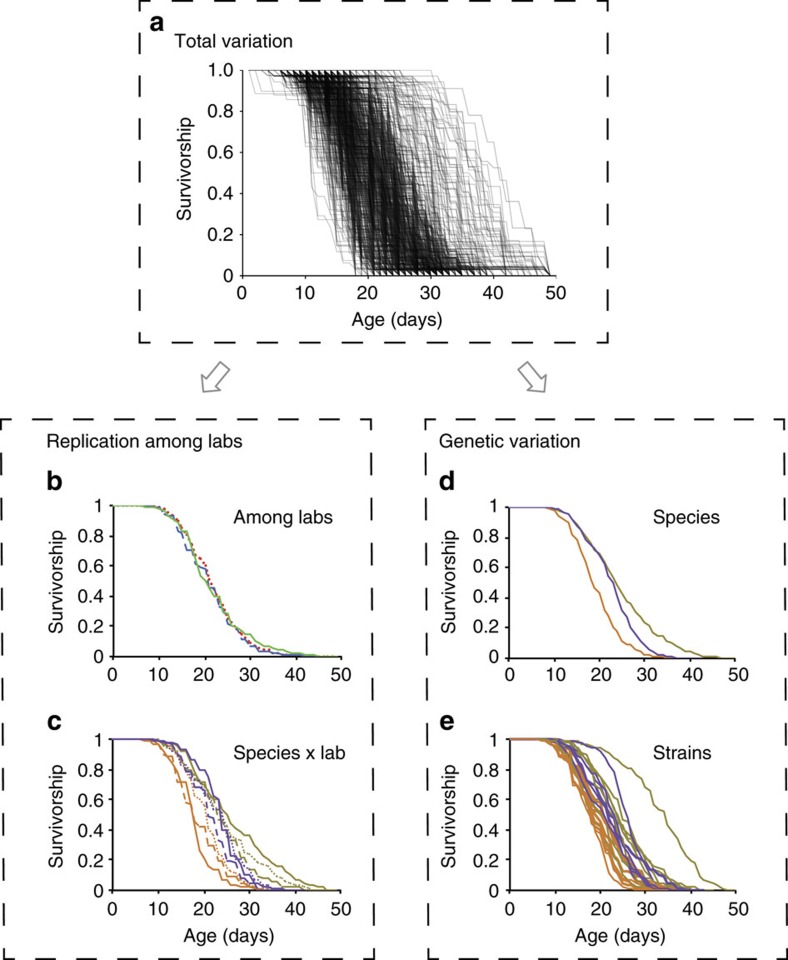
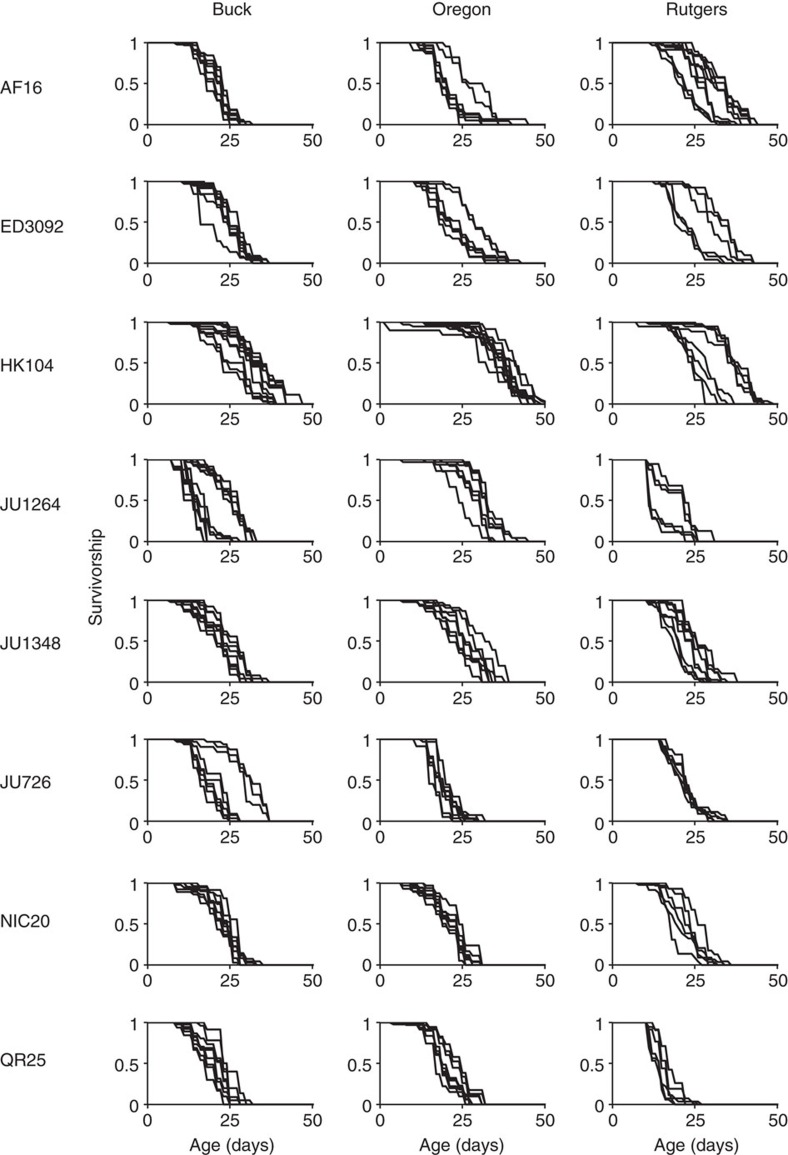
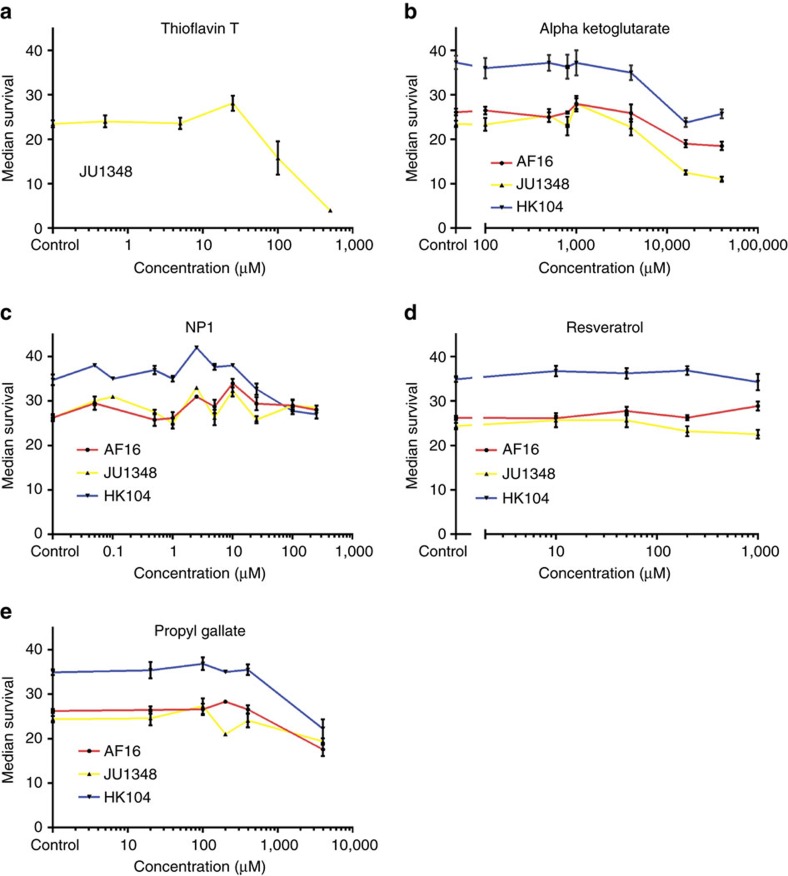
Limiting the debilitating consequences of ageing is a major medical challenge of our time. Robust pharmacological interventions that promote healthy ageing across diverse genetic backgrounds may engage conserved longevity pathways. Here we report results from the Caenorhabditis Intervention Testing Program in assessing longevity variation across 22 Caenorhabditis strains spanning 3 species, using multiple replicates collected across three independent laboratories. Reproducibility between test sites is high, whereas individual trial reproducibility is relatively low. Of ten pro-longevity chemicals tested, six significantly extend lifespan in at least one strain. Three reported dietary restriction mimetics are mainly effective across C. elegans strains, indicating species and strain-specific responses. In contrast, the amyloid dye ThioflavinT is both potent and robust across the strains. Our results highlight promising pharmacological leads and demonstrate the importance of assessing lifespans of discrete cohorts across repeat studies to capture biological variation in the search for reproducible ageing interventions.


Conflict of interest statement

The authors declare no competing financial interests.

Figures

Figure 1
Figure 1. Summary of developmental time and fertility of 22 Caenorhabditis strains.
(a,b) Graphical representation of the mean developmental time (a) and mean fertility (b) for 22 Caenorhabditis strains under the test culture conditions (see Methods). Each point represents the average of 20 individual animals, scored in one of the three CITP labs. Middle bar represents the mean with smaller bars indicating the s.e. Graphs are segregated by species such that eight C. briggsae strains are shown in grey, eight C. elegans strains are shown in black and six C. tropicalis strains are shown in off white. Statistical summaries of the parent data used to generate these graphs is presented in Table 1 and Supplementary Table 1, with the per-replicate estimates and sample sizes provided in Supplementary Data 1 and 2.
Figure 2
Figure 2. Natural and experimental variation in longevity among natural isolates of Caenorhabditis.
(a) The set of survivorship curves displaying the total range of observed longevity for each of the 728 experimental replicates (plates) from three laboratories measured across the three species and 22 natural isolates measured in this study. The cause of plate-to-plate differences in responses can be attributed to different sources using a hierarchical analysis that partitions the total observed variation to known sources of genetic differences and replication error. Overall, the average longevity across the entire experiment did not differ across the three laboratories (b), although there were species- and strain-specific responses that varied from lab to lab (c). There were also distinct differences among species (d), but in fact more variation among strains within species (e). Relative percentages of the total variation attributable to each source are given in Table 2. Orange lines are C. elegans, tan are C. briggsae and purple are C. tropicalis. Dashed lines (blue) are replicates from the Buck Institute, solid lines (green) are from Oregon and dotted lines (red) are from Rutgers. Sample sizes and per-replicate estimates for means and medians are provided in Supplementary Data 3.
Figure 3
Figure 3. Variation in longevity within labs for each replicate plate for eight natural isolates of C. briggsae.
It is noteworthy that in many cases a given natural isolate tends to display distinct patterns of responses under identical laboratory conditions rather than a continuous distribution of ‘error' among replicates. Among-replicate variation within each lab was a much larger barrier to reproducibility than variation in the average response of a strain across labs (Table 2). Each plate was initiated with n=35 animals.
Figure 4
Figure 4. Chemical effect on the median lifespan of six Caenorhabditis strains.
(aj) The effect on median lifespan from ten different chemical treatments is shown for six Caenorhabditis strains. The six strains consist of three C. elegans species (N2, MY16 and JU775, black text) and three C. briggsae species (JU1348, AF16 and HK104, grey). The per cent difference in median lifespan was determined by calculating the median lifespan for each plate population (single plate lifespan assays starting with 35–40 animals, each site at least 6 plates in at least 2 biological replicates). Every chemical test plate had a control plate associated with it (diluent only control plate, that was maintained with the test plate), which contained animals from the same egg lay and was always scored by the same technician as the test plate. In all graphs each point represents the percent difference in median lifespan between two single plate populations, one containing the chemical being tested and the other containing the diluent control. Data incorporate censored animals in calculating median lifespan. Points are colour coded to indicate the lab the data was collected in, as indicated in key on a. Middle bar represents the mean with small bars, indicating the s.e. Asterisks represent P-values from the CPH model (Supplementary Table 4; ****P<0.0001, ***P<0.001, **P<0.01 and *P<0.05). Summaries from the statistical analysis of the parent data used to generate these graphs are included in Table 2 and Supplementary Tables 2 and 4. Sample sizes and per-replicate estimates for means and medians are provided in Supplementary Data 4.
Figure 5
Figure 5. Dosage effects on the lifespan C. briggsae with select positive chemicals.
(ac) Dose response effects on the median lifespan of select C. briggsae strains after treatment with chemicals that exhibited strong positive effects on the C. elegans strains. Dosing was performed only on strains that failed to respond positively in the initial tests (single dose experiments), as we did not attempt to identify peak responses, instead we only sought to identify whether positive effects could be obtained by altering doses. Chemical doses were chosen to center around the effective dose identified for C. elegans strains and were sometimes expanded after preliminary rounds of testing. ThT exhibited a positive effect on strain JU1348 at 25 μM, but was profoundly toxic to all strains at and above 100 μM (a). NP1 exhibited a positive effect on AF16 and JU1348 at 10 μM relative to control treated populations and showed reduced toxicity to HK104 at low micromolar concentrations (b). αKG did not exhibit clear positive effects in any of the C. briggsae strains tested, but exhibited toxicity at high millimolar concentrations (c). None of the resveratrol doses assayed appeared to alter the median lifespan of any of the C. briggsae strains tested (d). PG showed a negative effect on median lifespan for all of the C. briggsae strains tested at low millimolar concentrations (e). Median lifespans were determined from single plate populations. Mean values are plotted here with small bars, indicating the s.e. (sample size and statistical summaries are included in Supplementary Data 5).

References

    1. Bitto A., Wang A. M., Bennett C. F. & Kaeberlein M. Biochemical genetic pathways that modulate aging in multiple species. Cold Spring Harb. Perspect. Med. 5, pii: a025114 (2015). - PMC - PubMed
    1. Gkikas I., Petratou D. & Tavernarakis N. Longevity pathways and memory aging. Front. Genet. 5, 155 (2014). - PMC - PubMed
    1. Jensen M. B. & Jasper H. Mitochondrial proteostasis in the control of aging and longevity. Cell Metab. 20, 214–225 (2014). - PMC - PubMed
    1. Lopez-Otin C., Blasco M. A., Partridge L., Serrano M. & Kroemer G. The hallmarks of aging. Cell 153, 1194–1217 (2013). - PMC - PubMed
    1. Fontana L. & Partridge L. Promoting health and longevity through diet: from model organisms to humans. Cell 161, 106–118 (2015). - PMC - PubMed

Publication types