

The prostate cancer prevention trial risk calculator 2.0 performs equally for standard biopsy and MRI/US fusion-guided biopsy
- PMID: 28220802
- PMCID: PMC7900903
- DOI: 10.1038/pcan.2016.46
The prostate cancer prevention trial risk calculator 2.0 performs equally for standard biopsy and MRI/US fusion-guided biopsy
Abstract
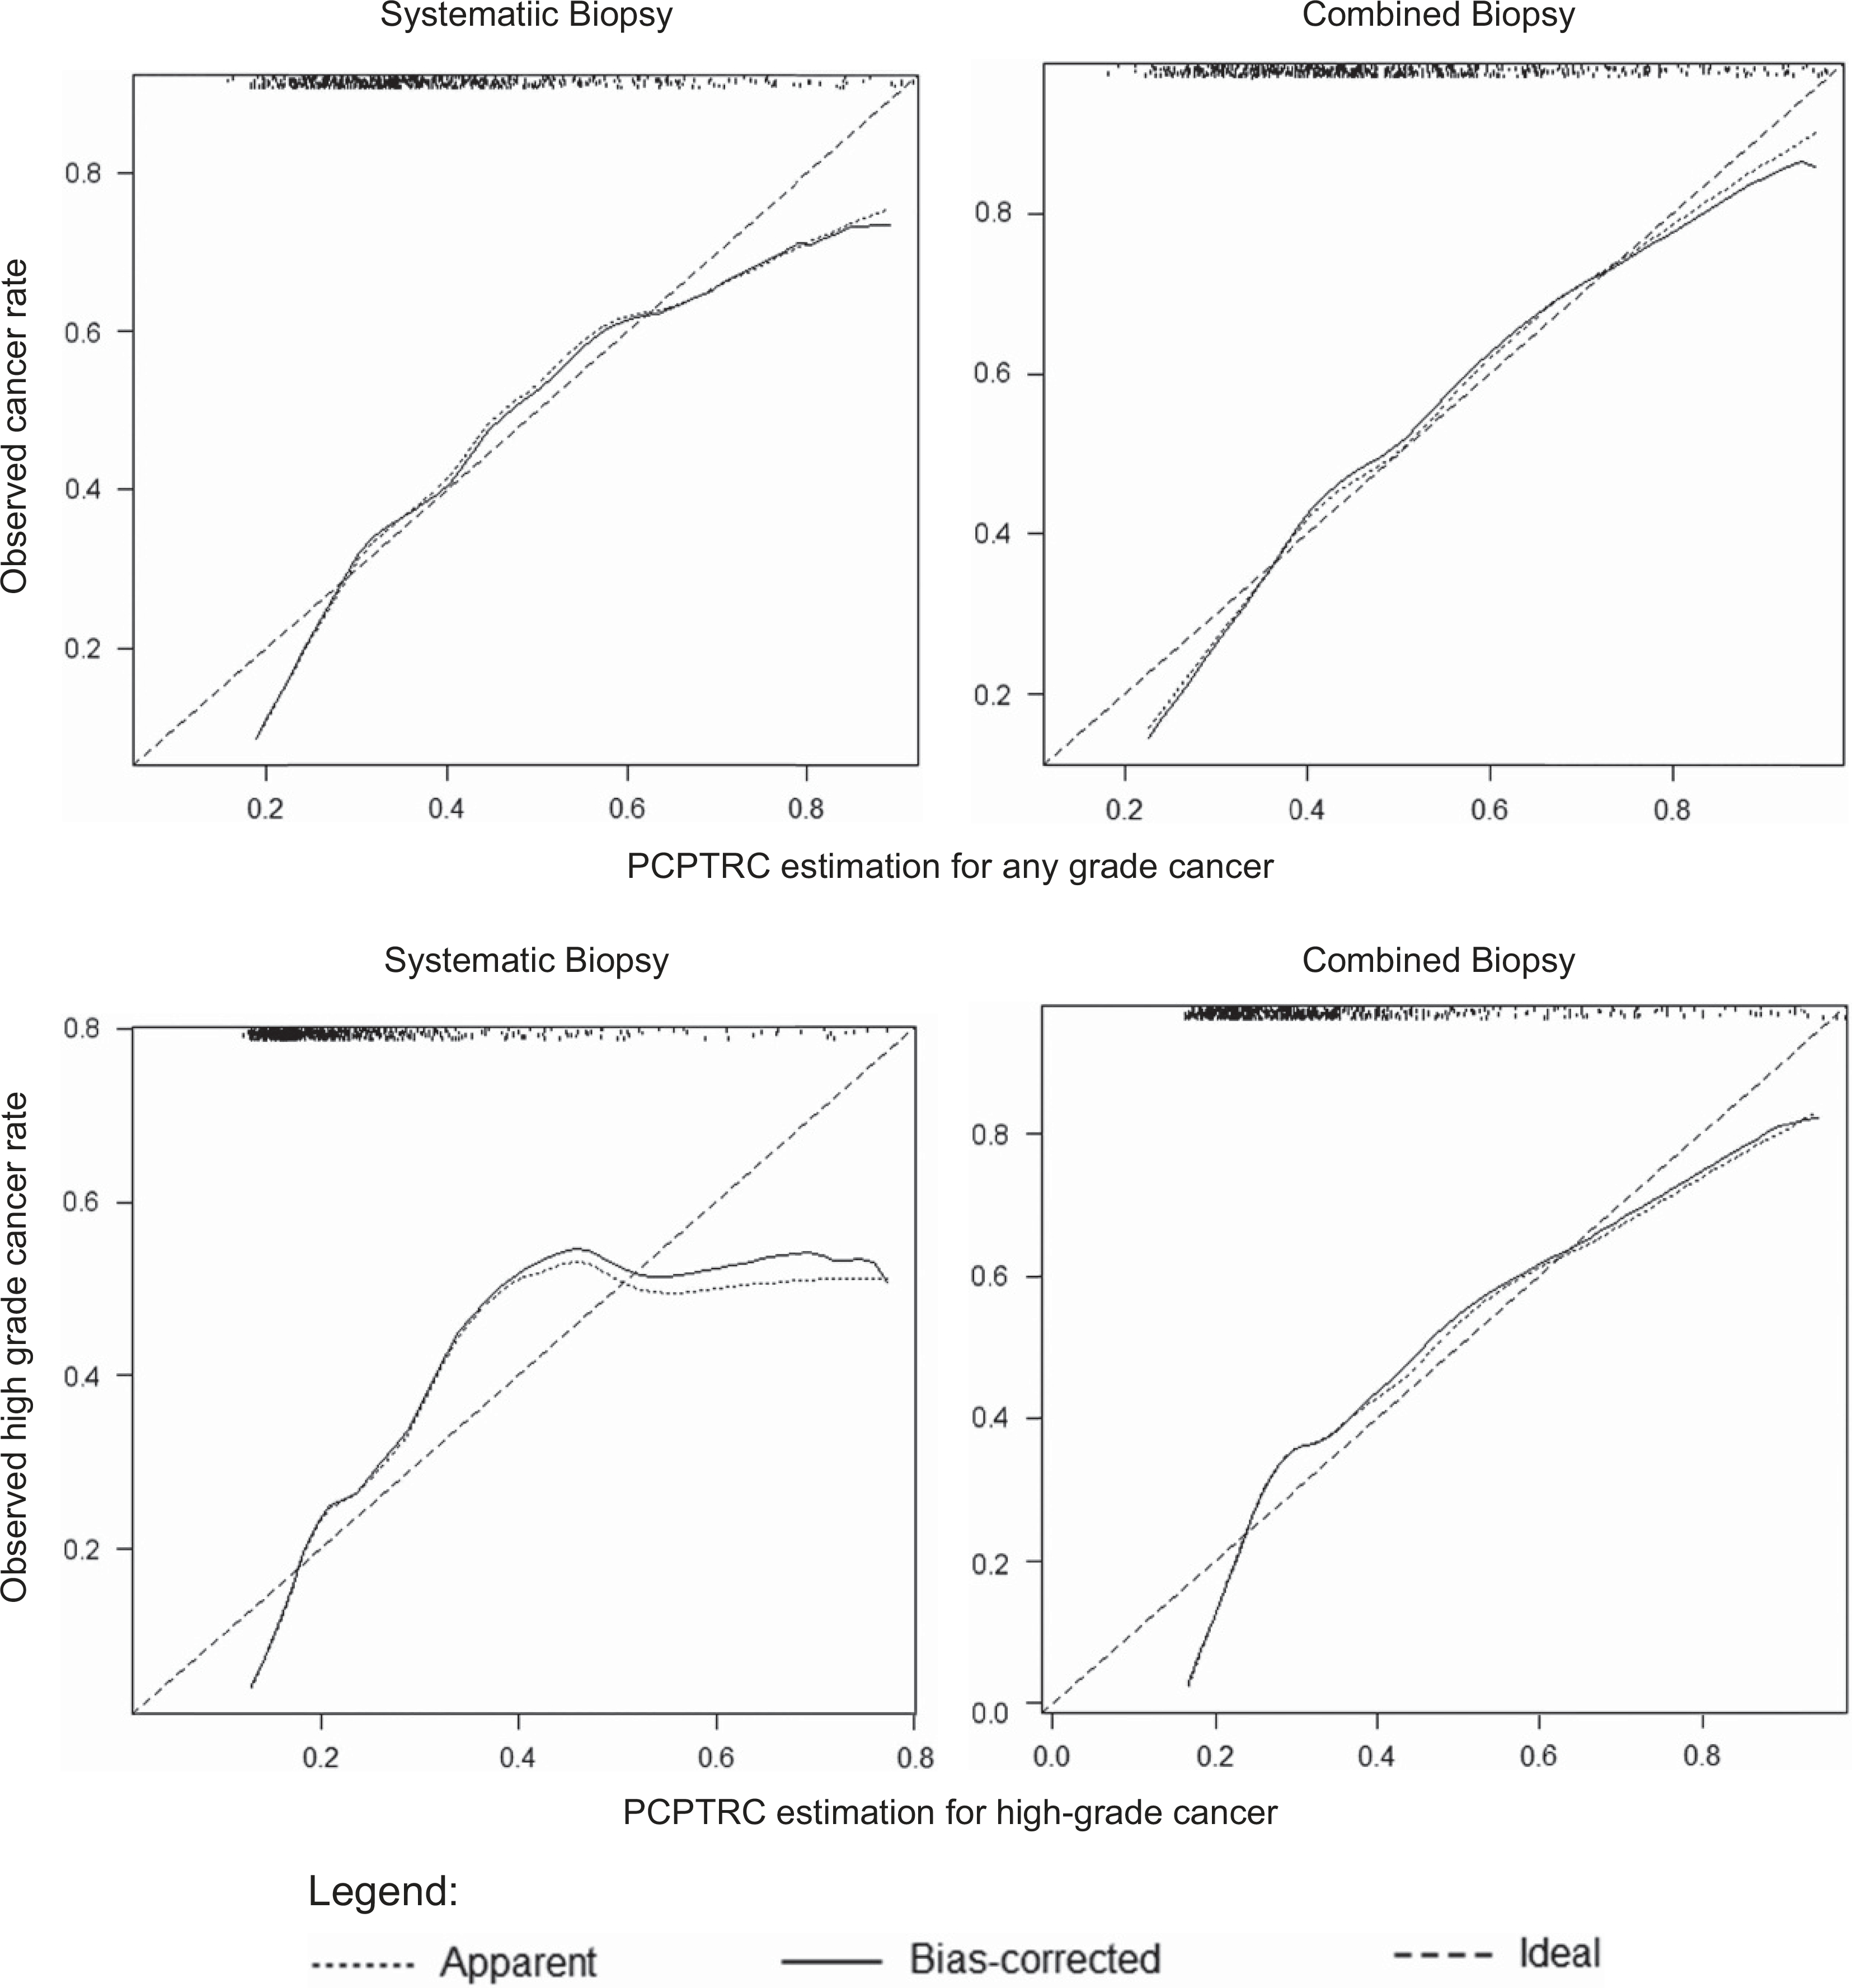
Background: The Prostate Cancer Prevention Trial Risk Calculator 2.0 (PCPTRC) is a widely used risk-based calculator used to assess a man's risk of prostate cancer (PCa) before biopsy. This risk calculator was created from data of a patient cohort undergoing a 6-core sextant biopsy, and subsequently validated in men undergoing 12-core systematic biopsy (SBx). The accuracy of the PCPTRC has not been studied in patients undergoing magnetic resonance imaging/ultrasound (MRI/US) fusion-guided biopsy (FBx). We sought to assess the performance of the PCPTRC for straitifying PCa risk in a FBx cohort.
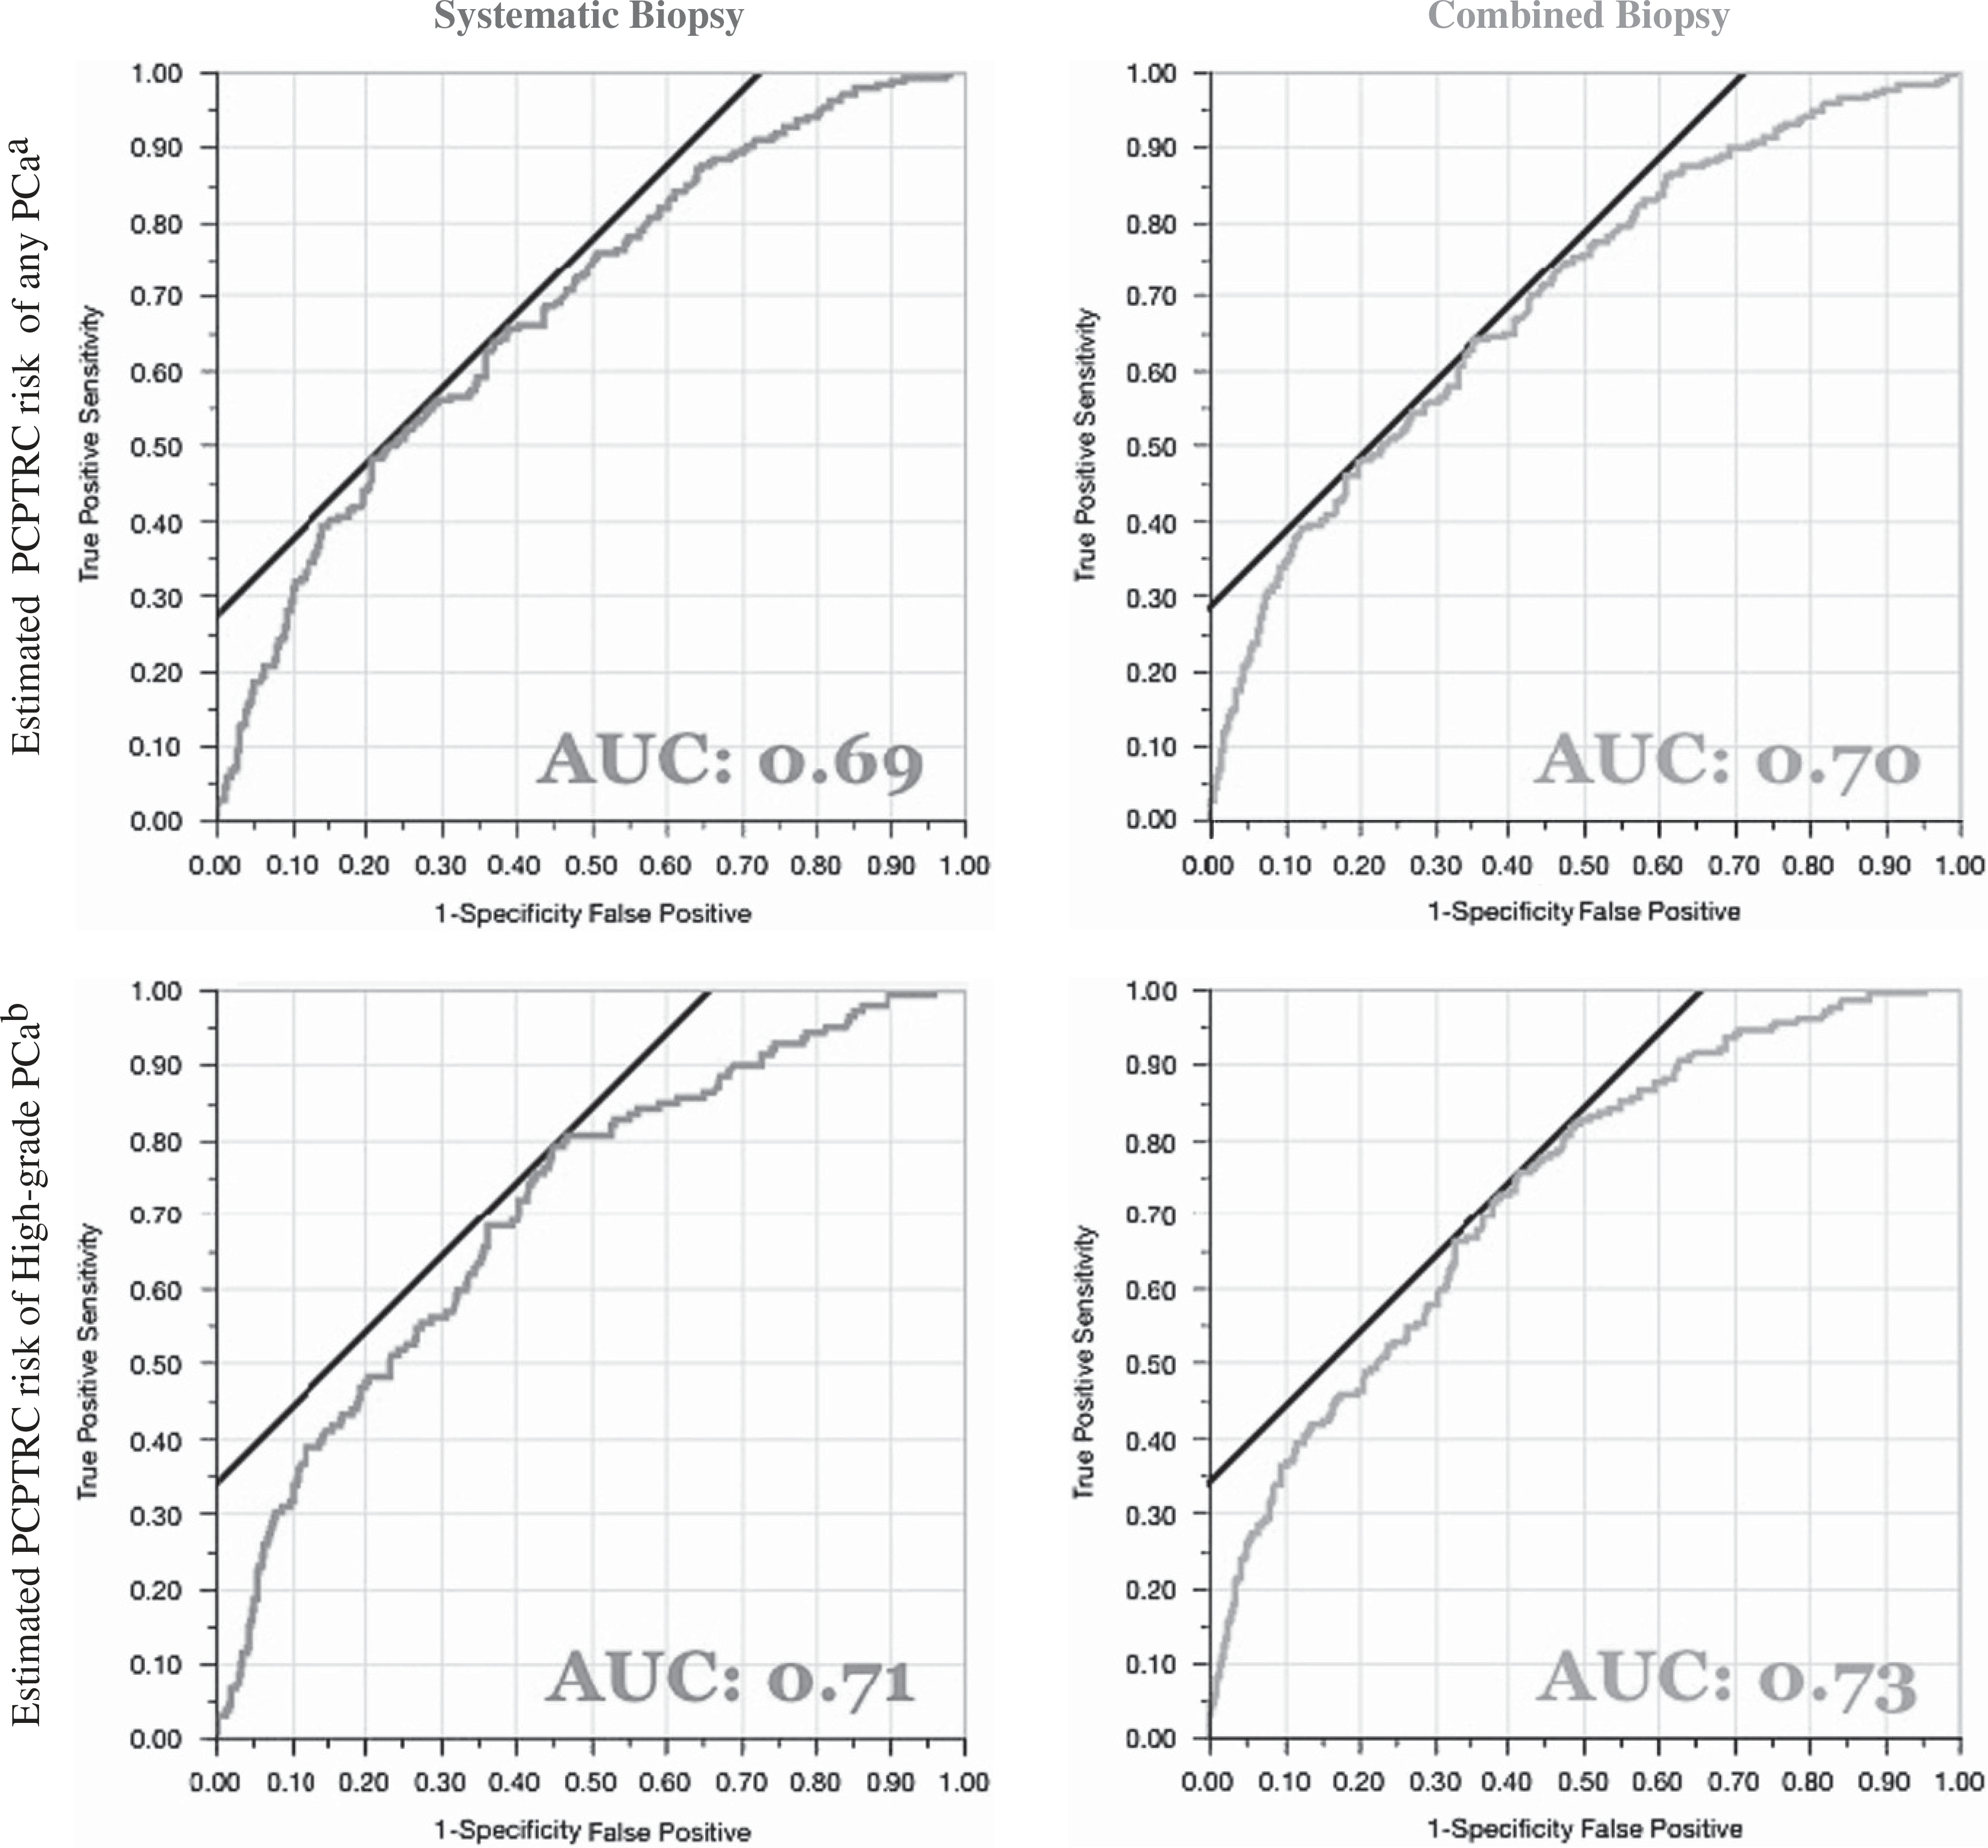
Methods: A review of a prospective cohort undergoing MRI and FBx/SBx was conducted. Data from consecutive FBx/SBx were collected between August 2007 and February 2014, and PCPTRC scores using the PCPTRC2.0R-code were calculated. The risk of positive biopsy and high-grade cancer (Gleason ⩾7) on biopsy was calculated and compared with overall and high-grade cancer detection rates (CDRs). Receiver operating characteristic curves were generated and the areas under the curves (AUCs) were compared using DeLong's test.
Results: Of 595 men included in the study, PCa was detected in 39% (232) by SBx compared with 48% (287) on combined FBx/SBx biopsy. The PCPTRC AUCs for the CDR were similar (P=0.70) for SBx (0.69) and combined biopsy (0.70). For high-grade disease, AUCs for SBx (0.71) and combined biopsy (0.70) were slightly higher, but were not statistically different (P=0.55).
Conclusions: In an MRI-screened population of men undergoing FBx, PCPTRC continues to represent a practical method of accurately stratifying PCa risk.
Conflict of interest statement
CONFLICT OF INTEREST
The authors declare no conflict of interest.
Figures
Similar articles
-
Changes in prostate cancer detection rate of MRI-TRUS fusion vs systematic biopsy over time: evidence of a learning curve.Prostate Cancer Prostatic Dis. 2017 Dec;20(4):436-441. doi: 10.1038/pcan.2017.34. Epub 2017 Aug 1. Prostate Cancer Prostatic Dis. 2017. PMID: 28762373 Free PMC article.
-
Multiparametric MRI/ultrasound fusion-guided biopsy decreases detection of indolent cancer in African-American men.Prostate Cancer Prostatic Dis. 2017 Sep;20(3):348-351. doi: 10.1038/pcan.2017.21. Epub 2017 Apr 25. Prostate Cancer Prostatic Dis. 2017. PMID: 28440325 Free PMC article.
-
Patient Experience of Systematic Versus Fusion Prostate Biopsies.Eur Urol Oncol. 2018 Aug;1(3):202-207. doi: 10.1016/j.euo.2018.02.005. Epub 2018 May 15. Eur Urol Oncol. 2018. PMID: 31102622 Clinical Trial.
-
Fusion prostate biopsy outperforms 12-core systematic prostate biopsy in patients with prior negative systematic biopsy: A multi-institutional analysis.Urol Oncol. 2018 Jul;36(7):341.e1-341.e7. doi: 10.1016/j.urolonc.2018.04.002. Epub 2018 May 10. Urol Oncol. 2018. PMID: 29753548 Free PMC article.
-
Techniques and Outcomes of MRI-TRUS Fusion Prostate Biopsy.Curr Urol Rep. 2021 Mar 22;22(4):27. doi: 10.1007/s11934-021-01037-x. Curr Urol Rep. 2021. PMID: 33748877 Free PMC article. Review.
Cited by
-
Usefulness of urinary biomarker-based risk score and multiparametric MRI for clinically significant prostate cancer detection in biopsy-naïve patients.Abdom Radiol (NY). 2025 Aug;50(8):3816-3826. doi: 10.1007/s00261-024-04727-5. Epub 2025 Jan 25. Abdom Radiol (NY). 2025. PMID: 39862284 Free PMC article.
References
-
- Meigs JB, Barry MJ, Oesterling JE, Jacobsen SJ. Interpreting results of prostate-specific antigen testing for early detection of prostate cancer. J Gen Intern Med 1996; 11: 505–512. - PubMed
-
- Barry MJ. Clinical practice. Prostate-specific-antigen testing for early diagnosis of prostate cancer. N Engl J Med 2001; 344: 1373–1377. - PubMed
Publication types
MeSH terms
Grants and funding
LinkOut - more resources
Full Text Sources
Other Literature Sources
Medical
