. 2017 Feb 21:7:43068.
doi: 10.1038/srep43068.

A Frailty Index Based On Deficit Accumulation Quantifies Mortality Risk in Humans and in Mice

Affiliations

A Frailty Index Based On Deficit Accumulation Quantifies Mortality Risk in Humans and in Mice

K Rockwood et al. Sci Rep. .

Abstract

Although many common diseases occur mostly in old age, the impact of ageing itself on disease risk and expression often goes unevaluated. To consider the impact of ageing requires some useful means of measuring variability in health in animals of the same age. In humans, this variability has been quantified by counting age-related health deficits in a frailty index. Here we show the results of extending that approach to mice. Across the life course, many important features of deficit accumulation are present in both species. These include gradual rates of deficit accumulation (slope = 0.029 in humans; 0.036 in mice), a submaximal limit (0.54 in humans; 0.44 in mice), and a strong relationship to mortality (1.05 [1.04-1.05] in humans; 1.15 [1.12-1.18] in mice). Quantifying deficit accumulation in individual mice provides a powerful new tool that can facilitate translation of research on ageing, including in relation to disease.


Conflict of interest statement

The authors declare no competing financial interests.

Figures

Figure 1
Figure 1. Individual deficits accumulate at varying rates in people and in mice.
(A) Mean scores from pooled data from men and women show examples of individual deficits that exhibit different patterns of accumulation with age (n = 9169 people). Difficulty dressing (panel 1), high blood pressure (panel 2) and cataract surgery (panel 3) accumulated at different rates over time. (B, panels 1, 2, 3) Rates of deficit accumulation were similar for men only when compared to the sample shown in A (n = 4383 men). Data were binned and averaged each year for A and B. (C, panels 1, 2, 3) Tumours (panel 1), gait (panel 2) and tremor (panel 3) are shown as examples of deficits that demonstrate different progressions with age in male mice. Longitudinal data for each deficit were obtained from the entire cohort of mice and binned in 100 day increments (n = 251 mice).
Figure 2
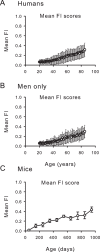
Figure 2. Mean ± SD frailty index (FI) scores increase at similar rates in people and in mice.
(A) Data from 46 individual deficits were used to calculate a FI score for each person. FI scores increased with age in the pooled sample of men and women (n = 9169). Data were binned in one year increments and FI scores were averaged at each age. (B) Similar results were seen in men only, using the same increments, averages and binning (n = 4383). (C) An FI score was calculated from 31 individual mouse deficits for all 251 mice. Data were binned in 100 day increments and FI scores were averaged for each age group (±SD). In each panel, the essential idea of frailty – unmeasured heterogeneity in the health status of organisms of the same age – is evident in the standard deviations. Even so, the fits to a linear model for the mean values were r2 = 0.97 for humans, 0.96 for men only and 0.93 for mice. The fits to an exponential model were r2 = 0.98 for humans, 0.96 for men only and 0.87 for mice. All the fits were significant for p < 0.0001.
Figure 3
Figure 3. Mean frailty index (FI) scores increased and their distribution broadened with age in humans and in mice.
(A) Frequency distributions of FI scores for younger (20–44 years; panel 1), middle-aged (45–64 years; panel 2) and older people (65 + years; panel 3) are illustrated. The frailty distribution moved right and broadened with age. (B, panels 1, 2, 3) Results were similar in men only when compared to the pooled sample shown in A. (C, panels 1, 2, 3) Frequency distributions of the FI scores for male mice also shifted to the right and broadened with increasing age. Data were stratified by age into three groups; younger (30–299 days old, panel 1), middle-aged (300–599 days old, panel 2) and old mice (600+ days old, panel 3).
Figure 4
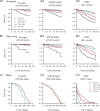
Figure 4. High frailty index (FI) scores predict mortality at all ages both in humans and in mice.
(A) Kaplan Meier survival curves stratified by 0.1 increments of the FI for younger (20–44 years; panel A1, n = 4083), middle-aged (45–64 years; panel A2, n = 2642) and older people (65+ years; panel A3, n = 2444) are illustrated. At any age, higher frailty scores were associated with reduced survival. (B) Results were similar for men, (younger, Panel B1, n = 1867, middle-aged, Panel B2, n = 1292, older, Panel B3, n = 1242) although mortality was higher in men than in the whole human sample. (C) Kaplan Meier survival curves were also constructed for younger (30–299 days; panel C1, n = 251), middle-aged (300–599 days; panel C2, n = 229) and older (600+ days; panel C3, n = 158) mice. Each mouse is represented only once in each age stratum. In general, as FI scores increased survival declined in all three age groups of mice. Mortality was high in one FI stratum in the older group (e.g. FI = 0.1–0.2). This reflected a small number of very old mice with low FI scores and severe deficits that required immediate euthanasia.

Similar articles

Cited by

References

    1. Vaupel J. W. et al.. Biodemographic trajectories of longevity. Science 280, 855–860 (1998). - PubMed
    1. Vaupel J. W., Mantron K. G. & Stallard E. The impact of heterogeneity in individual frailty on the dynamics of mortality. Demography 16, 439–454 (1979). - PubMed
    1. Clegg A., Young J., Iliffe S., Rikkert M. O. & Rockwood K. Frailty in elderly people. Lancet 381, 752–762 (2013). - PMC - PubMed
    1. Saunderson et al.. Acute coronary syndrome management in older adults: guidelines, temporal changes and challenges. Age Ageing 43, 450–455 (2014). - PubMed
    1. Kennedy et al.. Geroscience: linking aging to chronic disease. Cell 159, 709–713 (2014). - PMC - PubMed

Publication types