. 2017 Feb 21:8:14505.
doi: 10.1038/ncomms14505.

Membrane cholesterol access into a G-protein-coupled receptor

Affiliations

Membrane cholesterol access into a G-protein-coupled receptor

Ramon Guixà-González et al. Nat Commun. .

Abstract

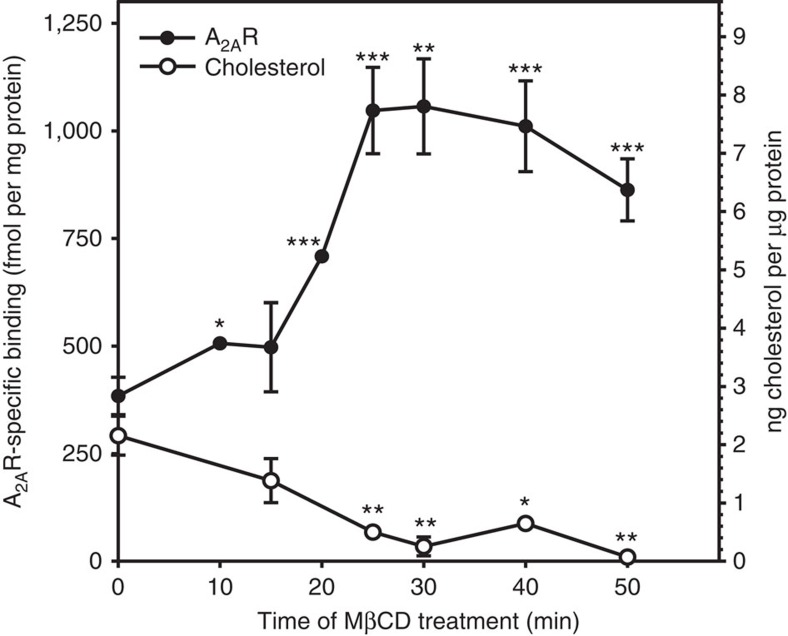
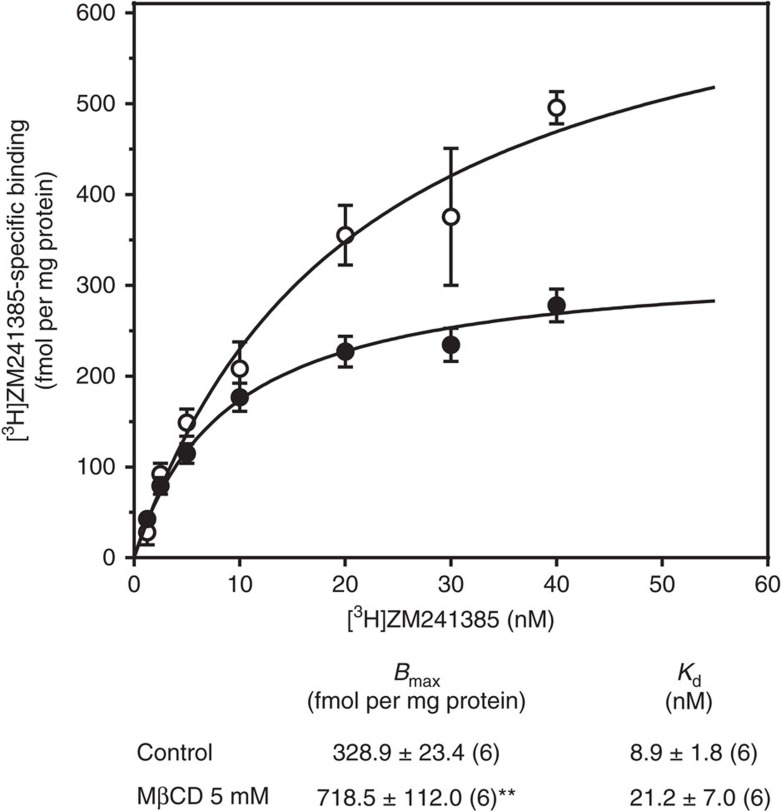
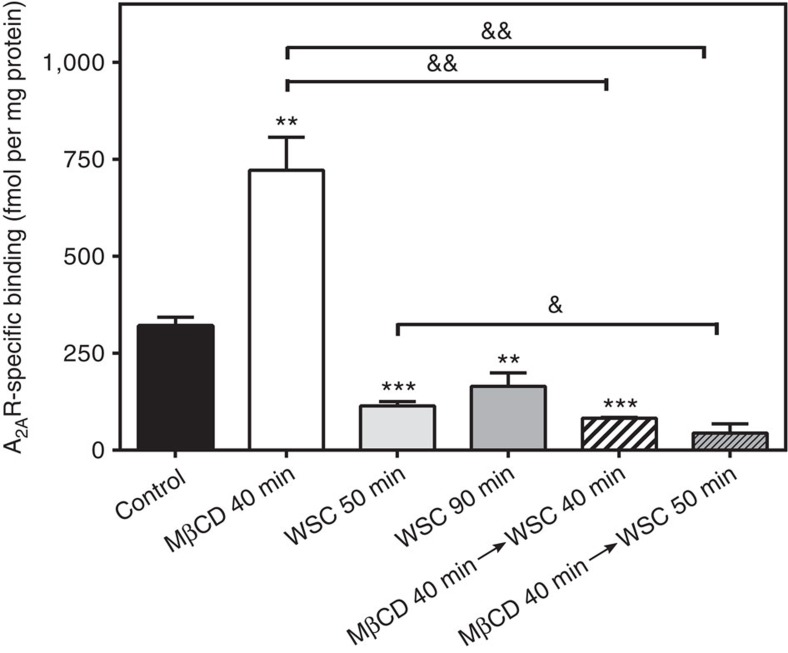
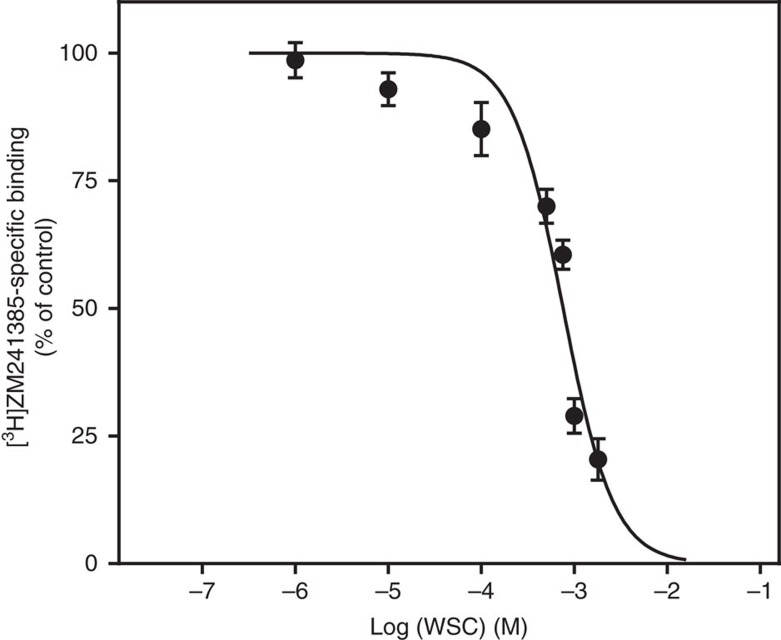
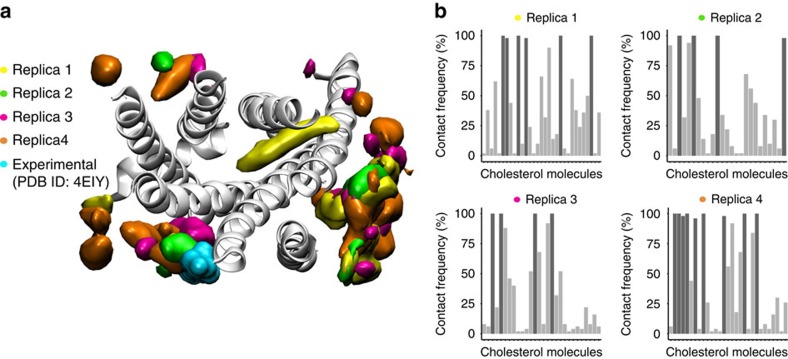
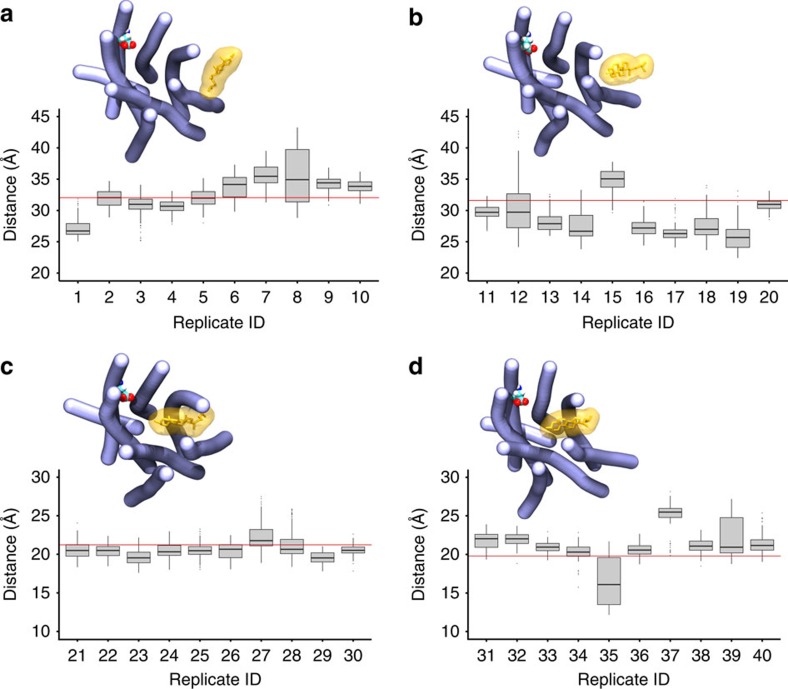
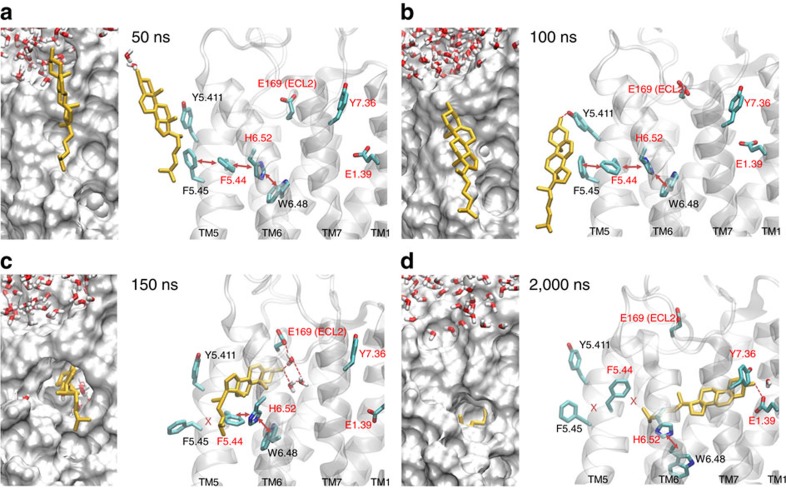
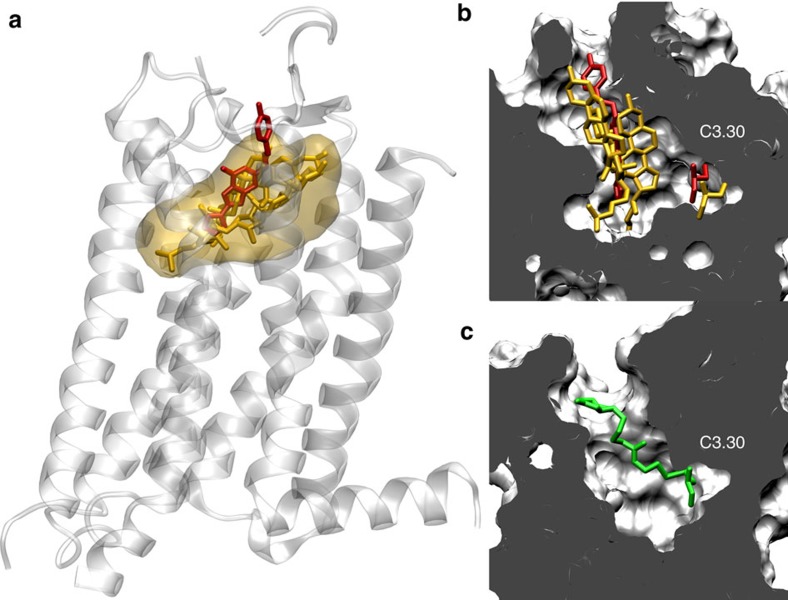
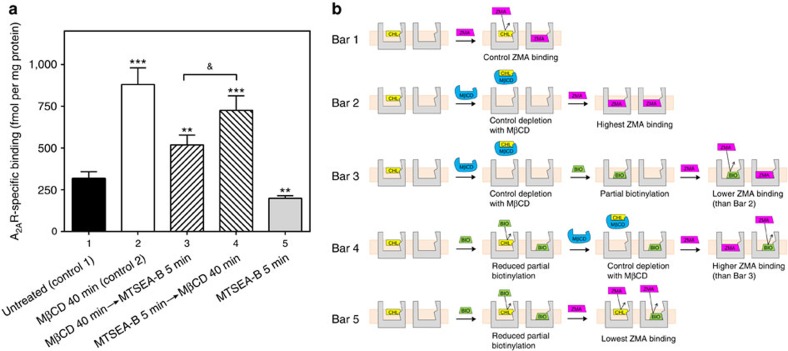
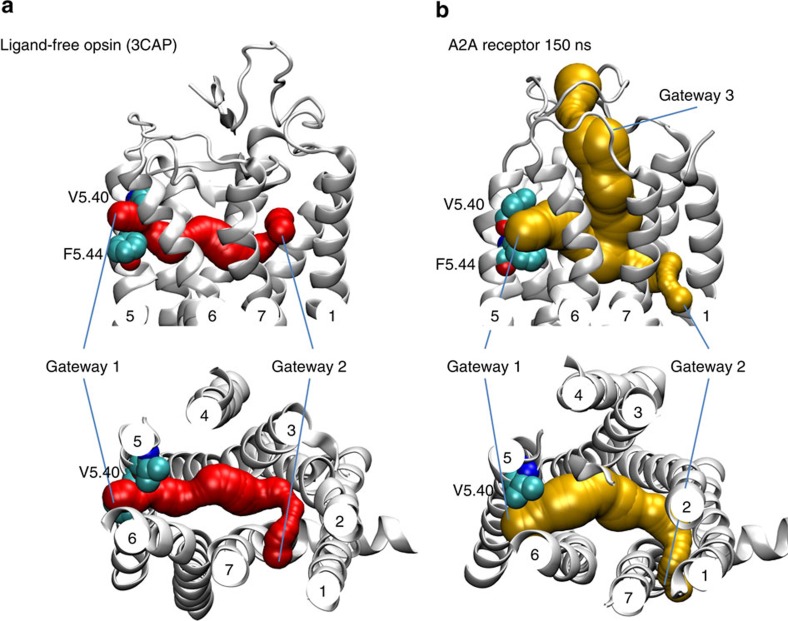
Cholesterol is a key component of cell membranes with a proven modulatory role on the function and ligand-binding properties of G-protein-coupled receptors (GPCRs). Crystal structures of prototypical GPCRs such as the adenosine A2A receptor (A2AR) have confirmed that cholesterol finds stable binding sites at the receptor surface suggesting an allosteric role of this lipid. Here we combine experimental and computational approaches to show that cholesterol can spontaneously enter the A2AR-binding pocket from the membrane milieu using the same portal gate previously suggested for opsin ligands. We confirm the presence of cholesterol inside the receptor by chemical modification of the A2AR interior in a biotinylation assay. Overall, we show that cholesterol's impact on A2AR-binding affinity goes beyond pure allosteric modulation and unveils a new interaction mode between cholesterol and the A2AR that could potentially apply to other GPCRs.


Conflict of interest statement

The authors declare no competing financial interests.

Figures

Figure 1
Figure 1. A2AR-specific binding and cholesterol content.
Time course of 5 mM MβCD addition on [3H]ZM241385-specific binding to A2AR in intact cells and membrane cholesterol content. This experiment was carried out using a saturating radioligand concentration of 40 nM. Mean±s.e.m. values obtained from n=3 separate experiments carried out in triplicate. *P<0.05, **P<0.01 and ***P<0.001 significantly different from control value (time 0, n=5) according to a Student's t-test.
Figure 2
Figure 2. Effect of MβCD on specific A2AR binding in C6 intact cells.
Control (closed circles) and 5 mM MβCD (40 min) (open circles) treated cells were incubated with different concentrations of [3H]ZM241385 as described in the Methods. These results are mean±s.e.m. values obtained from six separate experiments carried out in duplicate. Kinetic parameters (Bmax and Kd) of the corresponding saturation binding curves are indicated at the bottom the figure. **P<0.01 significantly different from control value according to a Student's t-test.
Figure 3
Figure 3. A2AR-specific binding in intact cells.
A2AR [3H]ZM241385 radioligand binding was determined after treatment with 5 mM methyl-β-cyclodextrin (MβCD), and/or 1 mM water soluble cholesterol (WSC) for 40, 50 or 90 min. Bars 5 and 6 represent a sequential treatment (that is, first MβCD is added, then a washing step, and finally WSC for 40 or 50 min). These experiments were carried out under saturating radioligand concentration (that is, 40 nM). Mean±s.e.m. values obtained from n=3 (columns 2, and 4–6), n=4 (column 3), and n=5 (column 1) separate experiments carried out in triplicate. *P<0.05, **P<0.01 and ***P<0.001 significantly different from control value &P<0.05 and &&P<0.01 significantly different from MβCD value according to a Student's t-test.
Figure 4
Figure 4. WSC competition binding curve in C6 plasma membranes.
Plasma membranes isolated from control cells were incubated with 20 nM [3H]ZM241385 and different WSC concentrations (1 μM to 3 mM) as described in the Methods section. These results are mean±s.e.m. values obtained from three different samples analysed in duplicate.
Figure 5
Figure 5. Cholesterol volumetric maps and contact frequency.
(a) Volumetric maps of cholesterol density around the aligned structure of the A2AR (white cartoon) for replica 1 (yellow), 2 (green), 3 (red) and 4 (orange). Density maps for individual replicas 1–4 can be also seen in Supplementary Fig. 10. Experimentally observed cholesterol molecule in the recently published high-resolution structure of Liu et al. (PDB:4EIY) is shown in cyan surface. Protein is viewed from the extracellular side, helices are labelled and loops are not depicted for clarity. (b) Normalized contact frequency (%) (y axis) of cholesterol molecules (x axis) interacting with the A2AR (that is, below 2.9 Å) during each 1 μs trajectory (replicas 1, 2, 3 and 4). Here we consider cholesterol–A2AR binding interactions to be stable or transient when the normalized contact frequency is above (dark grey bars) or below (light grey bars) 95%, respectively.
Figure 6
Figure 6. Short simulation replicas of cholesterol entrance.
Boxplots display the distance between the centre of mass of cholesterol and residue E1.39 for a set of 40 replicate simulations of 100 ns. Four different starting positions (ad) re-spawned from the original cholesterol entrance trajectory were used to run each 10 replicates (that is, 1–10, 11–20, 21–30, 31–40). The distance at the beginning of the simulation as measured from the snapshot used to re-spawn each set of 10 trajectories (that is, ad) is represented as one single red horizontal line in each of the graphs. Average distance for each set of replicates is reported in Supplementary Table 4. Inset figures show the initial structure of the A2AR (in blue) and cholesterol residue (in orange) used to start each set of simulations. E1.39 residue is displayed as van der Waals spheres. The BENDIX plugin for VMD was used to depict protein helices. Protein loops were omitted for clarity.
Figure 7
Figure 7. Cholesterol entrance.
(ad) Four snapshots from a 2 μs MD trajectory showing cholesterol entrance through helices TM5–6 of the A2AR. Left panel: view from the membrane side towards the receptor surface (grey surface), right panel: detailed structural representation of relevant residues that interact with cholesterol during its penetration into the receptor.
Figure 8
Figure 8. Cholesterol behaviour inside A2AR in long-scale MD simulations.
(a) Average position of cholesterol in the orthosteric binding site calculated over the accumulated 3 × 10 μs (yellow transparent map) superimposed onto the crystallized A2AR in complex with the ZM241385 antagonist (red sticks, PDB:3EML). A single snapshot of cholesterol position at the end of each 10 μs simulation is depicted in yellow sticks. (b) Position of C3.30 in the binding site crevice with respect to ZM241385 and cholesterol molecules (position at 10 μs of three individual MD trajectories). (c) Model of the C3.30 chemically modified with MTSEA-B in the A2AR binding site crevice.
Figure 9
Figure 9. Biotinylation experiments.
(a) Effect of the MTSEA-B reagent and cholesterol depletion on [3H]ZM241385-specific binding (mean±s.e.m.) at a saturating radioligand concentration of 40 nM. (b) Scheme of cholesterol influence on receptor biotinylation according to the experimental results presented in a. Bar 1 (control, n=11): ZMA binding in untreated (cholesterol-containing) control cells yields low ZMA binding due to cholesterol shielding effect. Bar 2 (n=5): ZMA binding in MβCD-treated cell membranes (cholesterol-depleted) results in highest ZMA binding due to an empty binding pocket. Bar 3 (n=4): biotinylation of a cholesterol-depleted binding pocket results in a high degree of biotinylation in the orthosteric binding pocket. As the binding pocket is occupied by the biotinylated side chain of C3.30, ZMA binding is reduced. Bar 4 (n=4): low biotinylation degree due to the shielding effect of cholesterol in the binding pocket. Subsequent removal of the shielding agent cholesterol with MβCD results in an empty binding pocket that allows for high ZMA binding. Bar 5 (n=4): lowest ZMA binding due to the accumulated hindering effect of biotinylation and cholesterol. CHL, cholesterol (yellow); BIO, biotinylation (green); MβCD, methyl-β-cyclodextrin (blue); ZMA, ZM241385 ligand (red). In a **P<0.01 and ***P<0.001 significantly different from control 1, &P<0.05 significantly different between them (bars 3 and 4) according to a Student's t-test.
Figure 10
Figure 10. Tunnel pathway comparison between opsin and A2AR.
Gateways and tunnel pathways for (a) the high-resolution structure opsin (3CAP)—red surface and (b) the simulated A2AR (150 ns)—yellow surface computed using the Caver software. Top: view from the membrane side, bottom: view from the extracellular side showing omitting gateway 3 for clarity in the A2AR.

Similar articles

Cited by

References

    1. Dawaliby R. et al.. Allosteric regulation of G protein-coupled receptor activity by phospholipids. Nat. Chem. Biol. 12, 35–39 (2015). - PMC - PubMed
    1. Guixà-González R. et al.. Membrane omega-3 fatty acids modulate the oligomerisation kinetics of adenosine A2A and dopamine D2 receptors. Sci. Rep. 6, 19839 (2016). - PMC - PubMed
    1. Paila Y. D. & Chattopadhyay A. The function of G-protein coupled receptors and membrane cholesterol: specific or general interaction? Glycoconj. J. 26, 711–720 (2009). - PubMed
    1. Paila Y. D. & Chattopadhyay A. Membrane cholesterol in the function and organization of G-protein coupled receptors. Subcell. Biochem 51, 381–398 (2010). - PubMed
    1. Oates J. & Watts A. Uncovering the intimate relationship between lipids, cholesterol and GPCR activation. Curr. Opin. Struct. Biol. 21, 802–807 (2011). - PubMed

Publication types