. 2017 Mar 20;56(13):3531-3535.
doi: 10.1002/anie.201611347. Epub 2017 Feb 21.

Positional Enrichment by Proton Analysis (PEPA): A One-Dimensional 1 H-NMR Approach for 13 C Stable Isotope Tracer Studies in Metabolomics

Affiliations

Positional Enrichment by Proton Analysis (PEPA): A One-Dimensional 1 H-NMR Approach for 13 C Stable Isotope Tracer Studies in Metabolomics

Maria Vinaixa et al. Angew Chem Int Ed Engl. .

Abstract

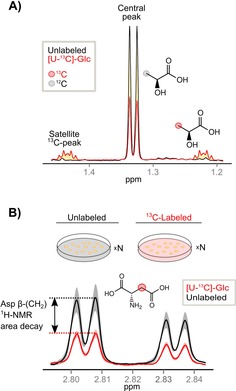
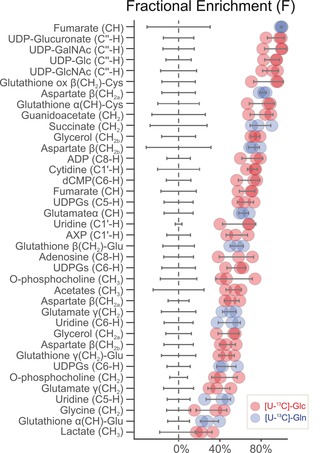
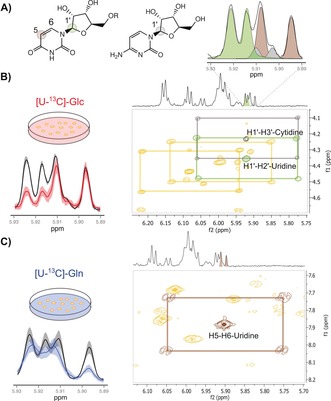
A novel metabolomics approach for NMR-based stable isotope tracer studies called PEPA is presented, and its performance validated using human cancer cells. PEPA detects the position of carbon label in isotopically enriched metabolites and quantifies fractional enrichment by indirect determination of 13 C-satellite peaks using 1D-1 H-NMR spectra. In comparison with 13 C-NMR, TOCSY and HSQC, PEPA improves sensitivity, accelerates the elucidation of 13 C positions in labeled metabolites and the quantification of the percentage of stable isotope enrichment. Altogether, PEPA provides a novel framework for extending the high-throughput of 1 H-NMR metabolic profiling to stable isotope tracing in metabolomics, facilitating and complementing the information derived from 2D-NMR experiments and expanding the range of isotopically enriched metabolites detected in cellular extracts.

Keywords: NMR spectroscopy; metabolism; metabolomics; stable isotopes.


Figures

Scheme 1
Scheme 1
A) PEPA's conceptual framework: 1D‐1H‐NMR spectral resonance of methyl protons in lactate at δ(1.33 ppm) obtained from cell extracts of two identical U2OS osteosarcoma cell cultures grown in either unlabeled glucose (black solid line) or [U‐13C]‐glucose (Glc) (red solid line). The latter shows evenly spaced 13C‐satellite peaks located at ±1 J(C–H)/2 from the central peak. These 13C‐satellite peaks result from heteronuclear (13C–1H) scalar couplings due to the replacement of 12C‐atoms in the methyl group of lactate by 13C‐atoms from [U‐13C]‐Glc. The area of 13C‐satellite peaks (yellow‐shaded) indicates the amount of 13C‐labeled methyl group in lactate while the area of the central peak (red line) represents the amount of unlabeled methyl group left. As the labeled substrate [U‐13C]‐Glc is metabolized into lactate, the area of 13C‐satellite peaks increases proportionally with the decay of the central peak (red line). The decayed area of this central peak can be quantified from the total pool of lactate in unlabeled equivalent samples (black line). B) PEPA's workflow: metabolites are extracted from replicates (n≥3) of unlabeled and 13C‐labeled (e.g., [U‐13C]‐Glc) biologically equivalent samples and these measured by 1D‐1H‐NMR. Next, 1D‐1H‐NMR spectra are profiled and resonances quantified. Significant decayed areas of central peaks in [U‐13C]‐Glc spectra by comparison with non‐labeled controls are determined via statistical testing. As an example, aspartate β(CH2) resonance at 2.82 ppm in three replicates of unlabeled (black) and labeled (red) samples provides the mean value of the area (solid line) and standard deviations (color shaded). Significant central peak decay proves 13C‐enrichment in this position indicating metabolic transformation of glucose into aspartate in U2OS osteosarcoma cell lines.
Figure 1
Figure 1
PEPA predicted significant fractional enrichments (F) calculated following Equation (2). Red and blue dots represent individual F values calculated for each of the three replicate samples using [U‐13C‐Glc] or [U‐13C Gln], respectively. Gray lines indicate F standard deviation.
Figure 2
Figure 2
Validation of PEPA using TOCSY (A) 1D‐1H‐NMR spectral region at δ[5.89–5.93 ppm] shows the deconvolution of overlapping proton resonances in C1′‐H position of uridine (d,J=4.4 Hz, green) and cytidine (d,J=4.1 Hz, gray), and C5‐H position of uracil in the uridine structure (d,J=8.5 Hz, brown). B) Left panel: mean area (solid line) and standard deviation (color‐shaded) of 1D‐1H‐NMR spectra acquired on unlabeled (black) and [U‐13C]‐Glc (red) cell extracts showing a significant decayed area of C1′‐H uridine and cytidine doublets. Right panel: TOCSY spectrum shows 13C cross‐peaks traced around their corresponding central unlabeled signals in green (H1′–H2′ correlation of uridine) and gray (H1′–H3′ correlation of cytidine). Additional 13C cross‐peaks for H1′–H3′ correlation of adenosine and H1′–H2′ of UDPG‐derived compounds are also indicated. C) Left panel: mean area (solid line) and standard deviation (color‐shaded) of 1D‐1H‐NMR spectra acquired on unlabeled (black) and [U‐13C]‐Gln (blue) cell extracts showing a significant decayed area for C5‐H position of uracil in the uridine structure. Right panel: TOCSY spectrum shows 13C cross‐peaks traced around the corresponding central unlabeled signal in brown (H5–H6 correlation of uridine).

References

    1. Patti G. J., Yanes O., Siuzdak G., Nat. Rev. Mol. Cell Biol. 2012, 13, 263–269. - PMC - PubMed
    1. Zamboni N., Saghatelian A., Patti G. J., Mol. Cell 2015, 58, 699–706. - PMC - PubMed
    1. Stothers J. B., Carbon-13 NMR Spectroscopy, Academic Press, New York, 1972.
    1. DeBerardinis R. J., Mancuso A., Daikhin E., Nissim I., Yudkoff M., Wehrli S., Thompson C. B., Proc. Natl. Acad. Sci. USA 2007, 104, 19345–19350. - PMC - PubMed
    1. Cohen S. M., Glynn P., Shulman R. G., Proc. Natl. Acad. Sci. USA 1981, 78, 60–64. - PMC - PubMed

Publication types