. 2017 Mar;23(3):415-422.
doi: 10.3201/eid2303.160101.

Spatiotemporal Fluctuations and Triggers of Ebola Virus Spillover

Spatiotemporal Fluctuations and Triggers of Ebola Virus Spillover

John Paul Schmidt et al. Emerg Infect Dis. 2017 Mar.

Abstract

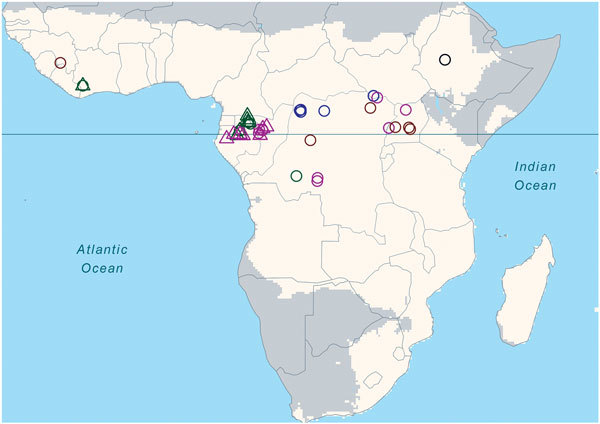
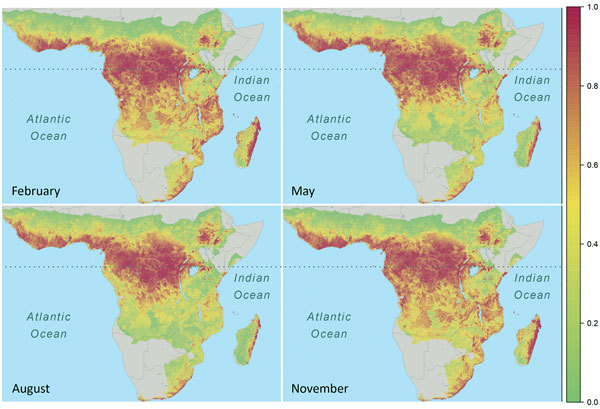
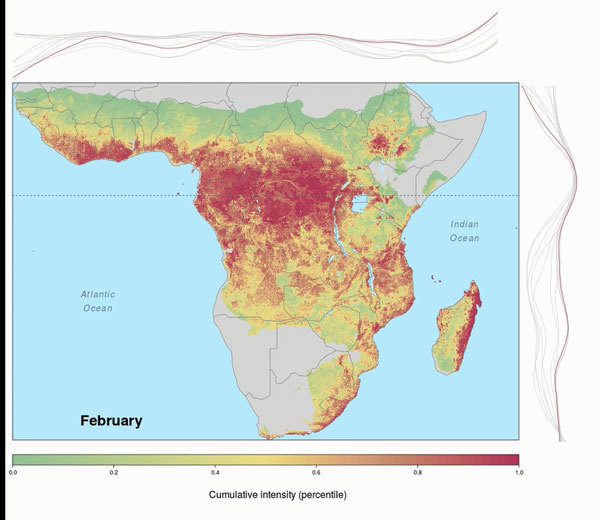
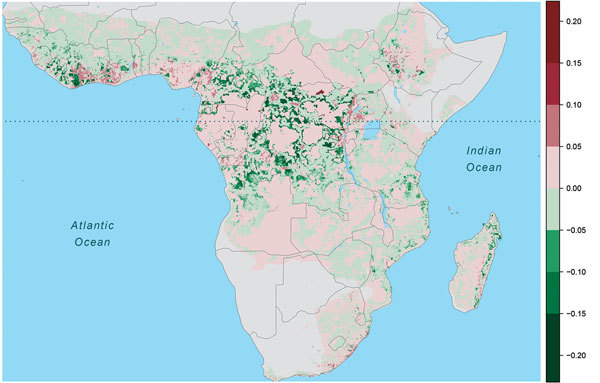
Because the natural reservoir of Ebola virus remains unclear and disease outbreaks in humans have occurred only sporadically over a large region, forecasting when and where Ebola spillovers are most likely to occur constitutes a continuing and urgent public health challenge. We developed a statistical modeling approach that associates 37 human or great ape Ebola spillovers since 1982 with spatiotemporally dynamic covariates including vegetative cover, human population size, and absolute and relative rainfall over 3 decades across sub-Saharan Africa. Our model (area under the curve 0.80 on test data) shows that spillover intensity is highest during transitions between wet and dry seasons; overall, high seasonal intensity occurs over much of tropical Africa; and spillover intensity is greatest at high (>1,000/km2) and very low (<100/km2) human population densities compared with intermediate levels. These results suggest strong seasonality in Ebola spillover from wild reservoirs and indicate particular times and regions for targeted surveillance.

Keywords: Ebola virus; disease outbreaks; early warning system; infectious diseases; modeling; seasonality; spatiotemporal forecasting; spillovers; viruses.


Figures

Figure 1
Figure 1
Locations of known Ebola virus spillover events, Africa, 1960–2010. Light-shaded area indicates the focal region in Africa of annual rainfall >500 mm. Open circles indicate human spillovers, open triangles infection/mortality in nonhuman primates or in other mammals. Yellow, blue, green, magenta, and black indicate the 5 respective decades during 1960–2010. Solid horizontal line marks the equator. No known Ebola spillovers occurred in the 1980s.
Figure 2
Figure 2
Seasonal spatiotemporal dynamics of Ebola virus spillover intensity (i.e., average density or expected number of points per unit area and month) as percentile values ranking predicted intensities at all grid cell locations within the region of Africa where annual rainfall was >500 mm for all months from January 1983 through December 2014. Panels capture shifts in the geographic pattern of spillover intensity seasonally. Dotted horizontal line marks the equator.
Video
Video
Seasonal spatiotemporal dynamics of Ebola virus spillover intensity (i.e., average density or expected number of points per unit area and month) as percentile values ranking predicted intensities at all grid cell locations within the region of Africa where annual rainfall was >500 mm for all months from January 1983 through December 2014. Lines at top and right depict the marginal intensity by month to indicate where (latitudinally and longitudinally) intensity is most dynamic. Dotted horizontal line marks the equator.
Figure 3
Figure 3
Phase graph showing the relationship between mean monthly rainfall and raw Ebola spillover intensity (defined as average density or expected number of points per unit area and/or time) for known Ebola virus disease locations in West and Central Africa (closed circles) and locations in northeastern or southern Africa where model results indicate moderate to high Ebola spillover intensity seasonally (open squares). Points are ordered by least to greatest monthly rainfall at each site. Dotted horizontal line marks the equator. DRC, Democratic Republic of the Congo.
Figure 4
Figure 4
Change in annual Ebola spillover intensity (defined as average density or expected number of points per unit area and time), Africa, 1975–2015. Warm colors indicate increased spillover intensity; cool colors indicate decreased spillover intensity. Dotted horizontal line marks the equator.
Figure 5
Figure 5
Change in human population size (log10/25 km2 grid cell), Africa, 1975–2015. Warm colors indicate increased population size, cool colors population declines. Dotted horizontal line marks the equator.

References

    1. Smith KF, Guégan JF. Changing geographic distributions of human pathogens. Annu Rev Ecol Evol Syst. 2010;41:231–50. 10.1146/annurev-ecolsys-102209-144634 - DOI
    1. Daszak P, Cunningham AA, Hyatt AD. Emerging infectious diseases of wildlife—threats to biodiversity and human health. Science. 2000;287:443–9. 10.1126/science.287.5452.443 - DOI - PubMed
    1. Heeney JL. Ebola: Hidden reservoirs. Nature. 2015;527:453–5. 10.1038/527453a - DOI - PubMed
    1. Pigott DM, Golding N, Mylne A, Huang Z, Henry AJ, Weiss DJ, et al. Mapping the zoonotic niche of Ebola virus disease in Africa. eLife. 2014;3:e04395. 10.7554/eLife.04395 - DOI - PMC - PubMed
    1. Kuhn JH. Filoviruses: a compendium of 40 years of epidemiological, clinical, and laboratory studies. New York: Springer; 2008. - PubMed

Publication types