. 2017 Mar;23(3):366-378.
doi: 10.1097/MIB.0000000000001027.

Early Transcriptomic Changes in the Ileal Pouch Provide Insight into the Molecular Pathogenesis of Pouchitis and Ulcerative Colitis

Affiliations

Early Transcriptomic Changes in the Ileal Pouch Provide Insight into the Molecular Pathogenesis of Pouchitis and Ulcerative Colitis

Yong Huang et al. Inflamm Bowel Dis. 2017 Mar.

Abstract

Background: Ulcerative colitis (UC) only involves the colonic mucosa. Yet, nearly 50% of patients with UC who undergo total proctocolectomy with ileal pouch anal anastomosis develop UC-like inflammation of the ileal pouch (pouchitis). By contrast, patients with familial adenomatous polyposis (FAP) with ileal pouch anal anastomosis develop pouchitis far less frequently. We hypothesized that pathogenic events associated with the development of UC are recapitulated by colonic-metaplastic transcriptomic reprogramming of the UC pouch.

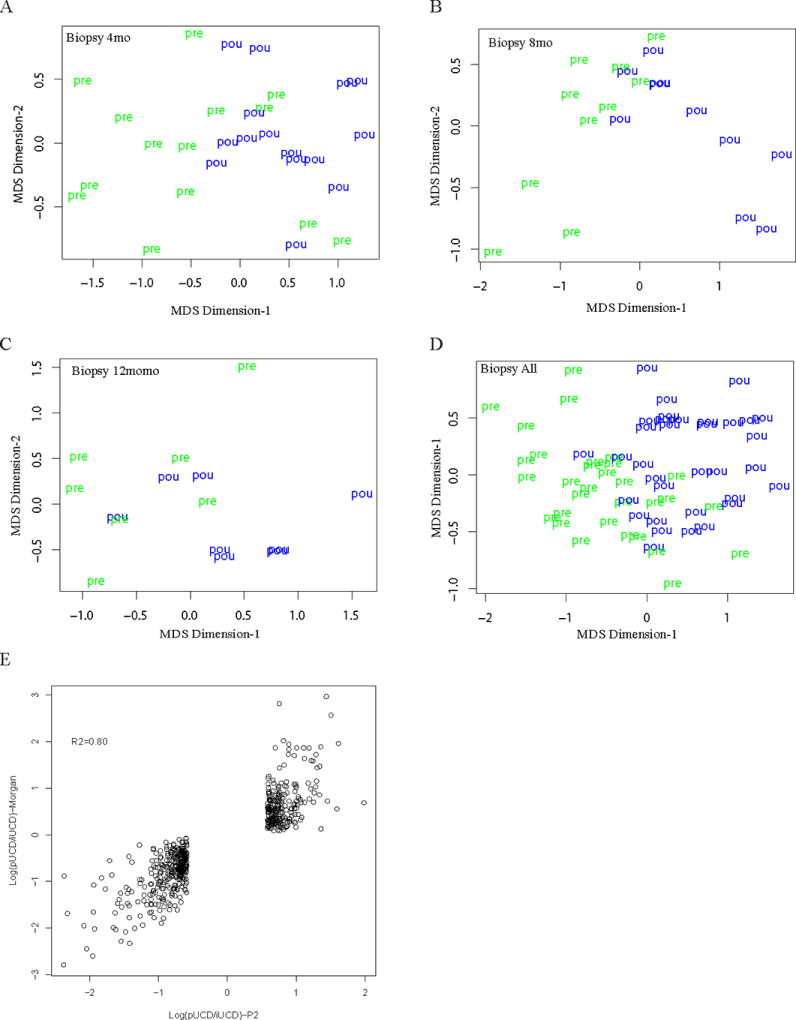
Methods: We prospectively sampled pouch and prepouch ileum mucosal biopsies in patients with UC with ileal pouch anal anastomosis 4, 8, and 12 months after their pouch was in continuity. Mucosal samples were also obtained from patients with FAP. Transcriptional profiles of the UC and FAP pouch and prepouch ileum were investigated via RNA sequencing and compared with data from a previously published microarray study.

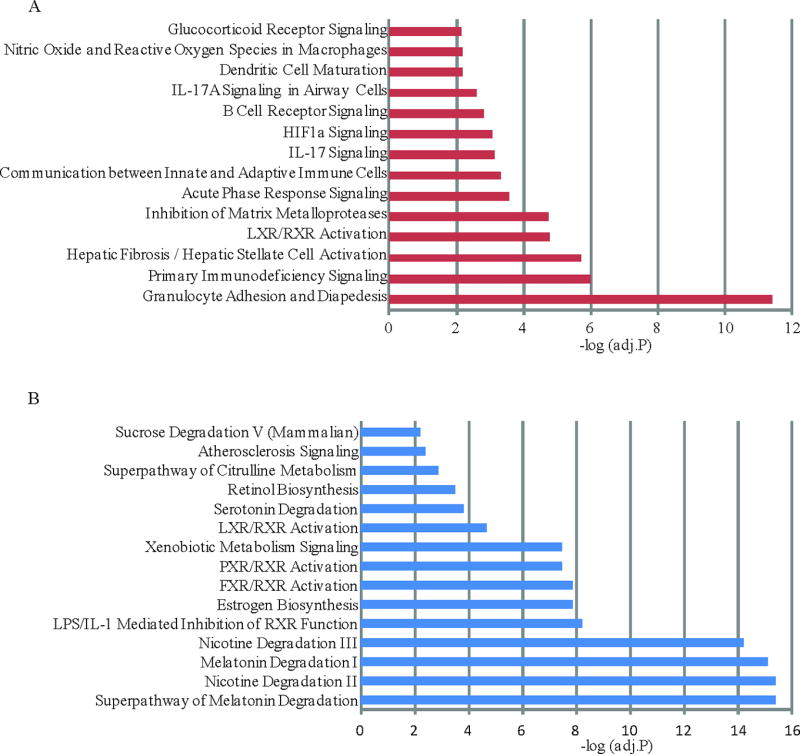
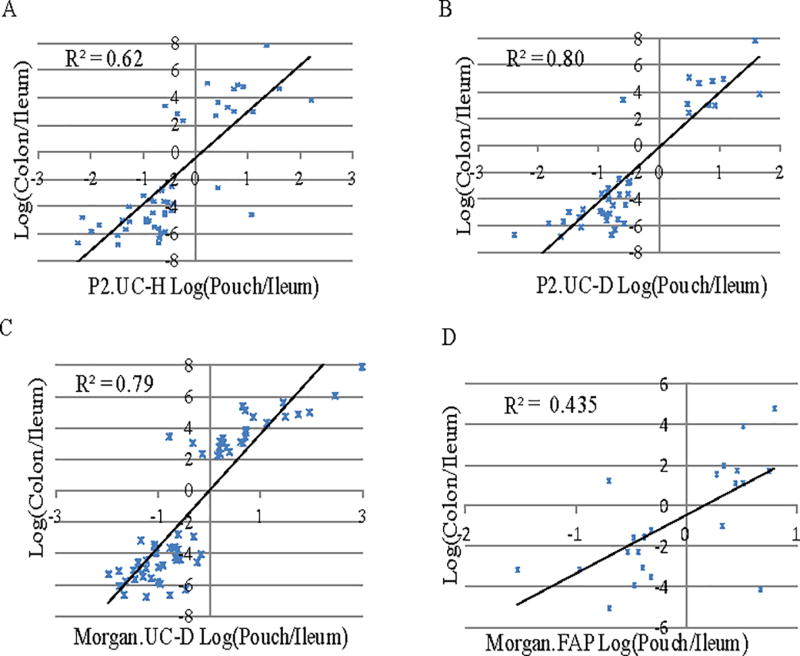
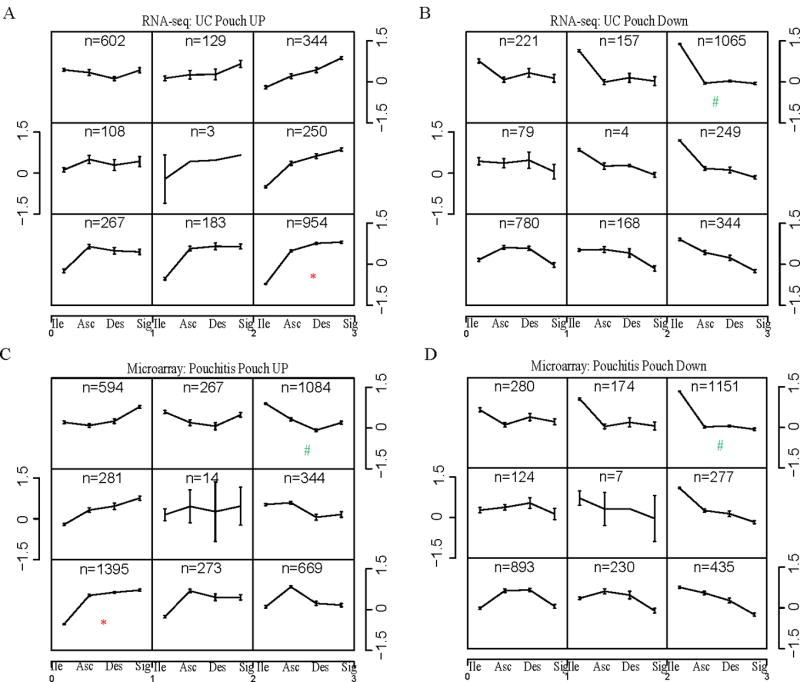
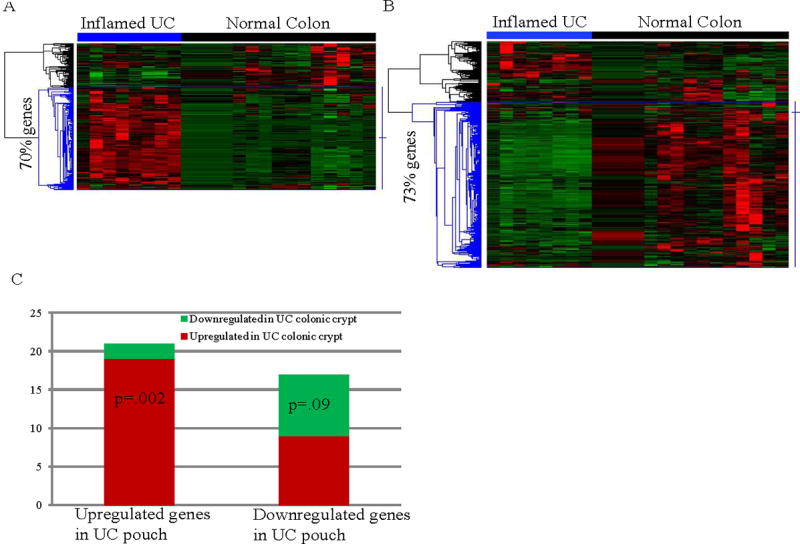
Results: Unlike patients with FAP, subjects with UC exhibited a large set of differentially expressed genes between the pouch and prepouch ileum as early as 4 months after pouch functionalization. Functional pathway analysis of differentially expressed genes in the UC pouch revealed an enhanced state of immune/inflammatory response and extracellular matrix remodeling. Moreover, >70% of differentially expressed genes mapped to published inflammatory bowel diseases microarray data sets displayed directional changes consistent with active UC but not with Crohn's disease.

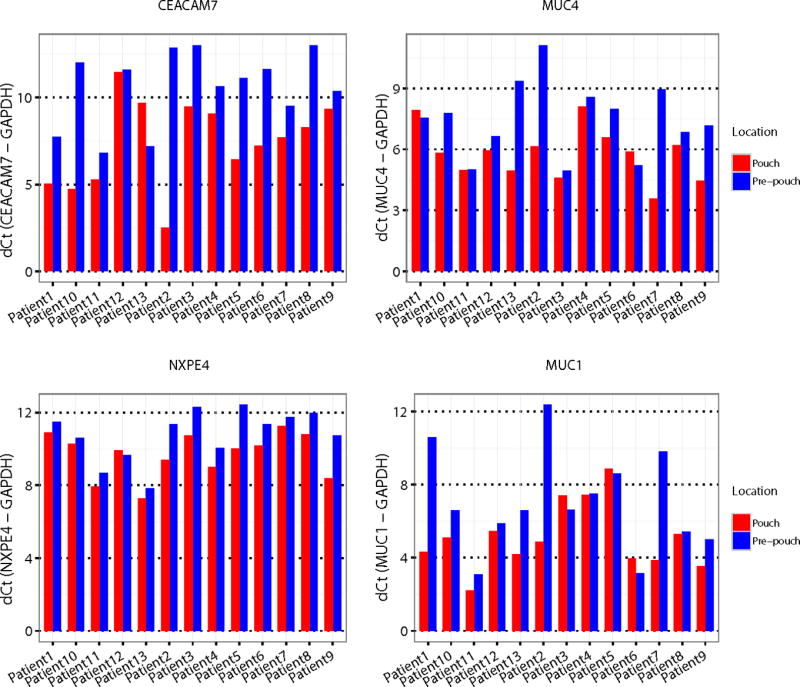
Conclusions: The UC pouch, well before histologic inflammation, already displays a systems-level gain of colon-associated genes and loss of ileum-associated genes. Patients with UC exhibit a unique transcriptomic response to ileal pouch creation that can be observed well before disease and may in part explain their susceptibility to the development of pouchitis.


Figures

Figure 1
Figure 1. UC pouch and pre-pouch ileum have distinct gene expression profiles
Multidimensional scaling (MDS) analysis was performed using RNA-seq data from pouch ("pou") and pre-pouch ileum ("pre") biopsies in UC patients at 4mo (A), 8mo (B), or 12mo (C) after ileostomy closure, or all time points combined (D). The MDS plots are shown with samples identified by location. (E). Concordance of gene expression changes in the UC pouch over short (<12mo) and long (>12mo) time scales. Each circle on the scatter plot represents a transcript whose expression significantly changes in the UC pouch after ileostomy closure, with distance along the x- and y-axes reflecting the log2-transformed magnitude of expression ratio between pouch and pre-pouch ileum. Values along the x-axis were computed from RNA-seq data in the present study, with criteria of fold-change > 1.5. and adjusted p<0.1. Values along the y-axis were calculated from published microarray data of pouchitis patients with biopsies collected >1 year after ileostomy closure (12).
Figure 2
Figure 2. Canonical pathways associated with up- or down-regulated genes in the UC pouch
Differentially expressed genes (fold change >1.5) in pouch vs pre-pouch ileum were submitted to Ingenuity Pathway Analysis software to identify significant pathways using one-tailed Fisher’s exact test. The criterion of significance is Benjamini-Hochberg adjusted p<0.01, i.e. -log(adjusted P) > 2.0. (A) Pathways associated with up-regulated genes in pouch. (B) Pathways associated with down-regulated genes in pouch. The genes in these pathways can be found in Supplemental Table S2 or S3, respectively.
Figure 3
Figure 3. The UC pouch transcriptome acquires colon-like features
A–C, Concordance of transcript ratios between pouch/pre-pouch ileum with normal colon/ileum. Expression data for healthy human colon and ileum transcriptomes were retrieved from Comelli et al. (29). Each dot represents a single gene. (A) Correlation plot of log2-transformed (colon/ileum) expression ratio with (pouch/pre-pouch ileum) ratio in UC patients who did not develop pouchitis (UC-H). (B) Correlation plot of log2-transformed (colon/ileum) expression ratio with (pouch/pre-pouch ileum) ratio in UC patients who went on to develop pouchitis (UC-D). (C) Correlation plot of log2-transformed (colon/ileum) expression ratio with (pouch/pre-pouch ileum) ratio in pouchitis patients with active disease >1 year after ileostomy closure from re-analysis of previously published microarray dataset of Morgan, et al. (12). (D) Correlation plot of log2-transformed (colon/ileum) expression ratio with (pouch/pre-pouch ileum) ratio in FAP patients from re-analysis of previously published microarray dataset of Morgan, et al. (12). Coefficients of determination are shown in each graph.
Figure 4
Figure 4. RT qPCR validation of selected biomarkers on paired pouch and pre-pouch samples from an independent UC cohort
We validated four colonic biomarkers by RT qPCR on paired pouch and pre-pouch samples derived from an independent cohort of 13 UC patients. The expression of each candidate gene was calculated relative to GAPDH. The p value based on paired t-test is shown for corresponding gene. Note that lower dCt value indicates higher expression value.
Figure 5
Figure 5. Self-organizing map (SOM) clustering of pouch DEGs along the proximal-distal axis of normal intestine
DEGs between pouch and pre-pouch ileum in our UC cohort (A–B) and from Morgan et al. (2015) (C–D) were mapped to published microarray expression data for normal human ileum and ascending, descending and sigmoid colon (30). The mapped up- or down-regulated genes in pouch were partitioned into 3×3 SOM clusters. Location within the intestine (as defined in ref. 30) is shown on the x-axis. Gene expression levels were standardized with mean of 0 and variance of 1, and shown on the y-axis. The number of up- or down-regulated genes in pouch whose expression pattern along the normal intestine matches the given pattern is shown at the top of each box. * or # indicates the largest incline or decline gene cluster in the corresponding SOM, and thus represents the major pattern of gene expression levels along the normal intestine.
Figure 6
Figure 6. Concordant transcriptome alterations in the UC pouch and UC colon
Up-regulated (A) and down-regulated genes (B) in UC pouch were mapped to the published UC colon microarray dataset GSE10191 (33), which contains 8 inflamed UC and 15 normal colon biopsy samples. Hierarchical clustering of the mapped genes was based on their correlation across all samples in GSE10191, as shown on the left dendrogram of the heatmap. Note that 70% of the up-regulated genes or 79% of the down-regulated genes in pouches were also increased or decreased in inflamed UC colons in (A) or (B) (blue highlighted dendrogram), respectively. Relative expression levels for each gene are indicated by color (black, mean level across all samples; green, below the mean; red, above the mean). (C) 49 up- and 28 down-regulated genes in UC colonic crypts compared to normal colonic crypts were retrieved from the microarray study by Kim et al. (33). The 77 genes were mapped to the up- or down-regulated genes in the UC pouch. Red or green bar color denotes up- or down-regulated genes in the UC colonic crypt, respectively. Significant overlap of up-regulated (or down-regulated) genes between UC colonic crypts and UC pouches was determined using hypergeometric distribution, p-value shown in the corresponding section of each bar.

References

    1. Bernstein CN, Ng SC, Lakatos PL, Moum B, Loftus EVJ. A review of mortality and surgery in ulcerative colitis: milestones of the seriousness of the disease. Inflamm Bowel Dis. 2013;19(9):2001–2010. doi: 10.1097/MIB.0b013e318281f3bb. - DOI - PubMed
    1. Hoda KM, Collins JF, Knigge KL, Deveney KE. Predictors of pouchitis after ileal pouch-anal anastomosis: a retrospective review. Dis Colon Rectum. 2008;51(5):554–560. doi: 10.1007/s10350-008-9194-7. - DOI - PubMed
    1. Simchuk EJ, Thirlby RC. Risk Factors and True Incidence of Pouchitis in Patients after Ileal Pouch-Anal Anastomoses. World J Surg. 2000;24(7):851–856. doi: 10.1007/s002680010136. - DOI - PubMed
    1. Hurst RD, Molinari M, Chung TP, Rubin M, Michelassi F. Prospective study of the incidence, timing and treatment of pouchitis in 104 consecutive patients after restorative proctocolectomy. Arch Surg. 1996;131(5):492–497. - PubMed
    1. Kartheuser A, Stangherlin P, Brandt D, Remue C, Sempoux C. Restorative proctocolectomy and ileal pouch-anal anastomosis for familial adenomatous polyposis revisited. Fam Cancer. 2006;5(3):241–260. doi: 10.1007/s10689-005-5672-4. - DOI - PubMed

Publication types