. 2017 Feb 22;15(1):39.
doi: 10.1186/s12916-017-0792-x.

Abnormal epigenetic changes during differentiation of human skeletal muscle stem cells from obese subjects

Affiliations

Abnormal epigenetic changes during differentiation of human skeletal muscle stem cells from obese subjects

Cajsa Davegårdh et al. BMC Med. .

Abstract

Background: Human skeletal muscle stem cells are important for muscle regeneration. However, the combined genome-wide DNA methylation and expression changes taking place during adult myogenesis have not been described in detail and novel myogenic factors may be discovered. Additionally, obesity is associated with low relative muscle mass and diminished metabolism. Epigenetic alterations taking place during myogenesis might contribute to these defects.

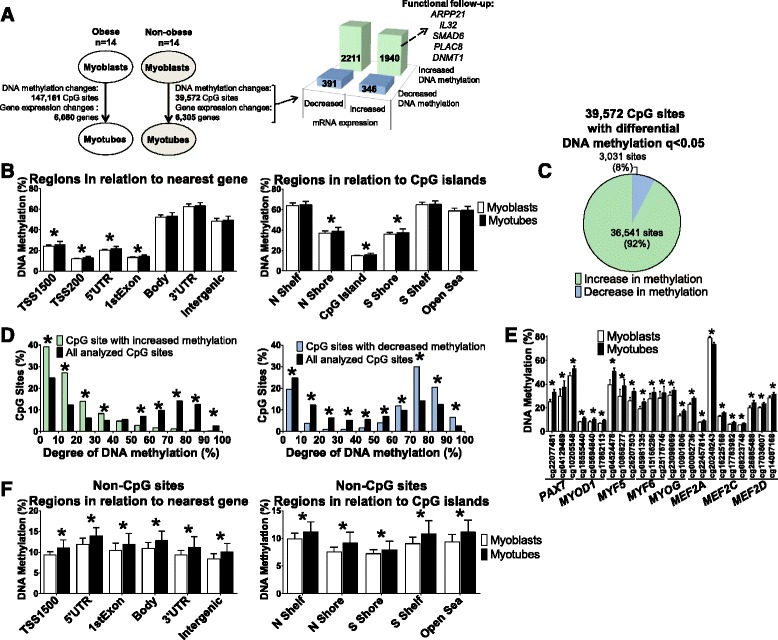
Methods: We used Infinium HumanMethylation450 BeadChip Kit (Illumina) and HumanHT-12 Expression BeadChip (Illumina) to analyze genome-wide DNA methylation and transcription before versus after differentiation of primary human myoblasts from 14 non-obese and 14 obese individuals. Functional follow-up experiments were performed using siRNA mediated gene silencing in primary human myoblasts and a transgenic mouse model.

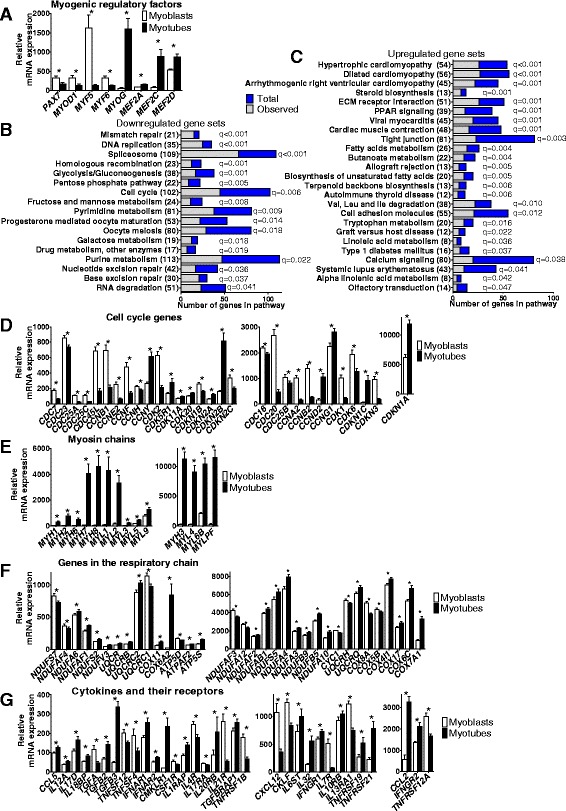
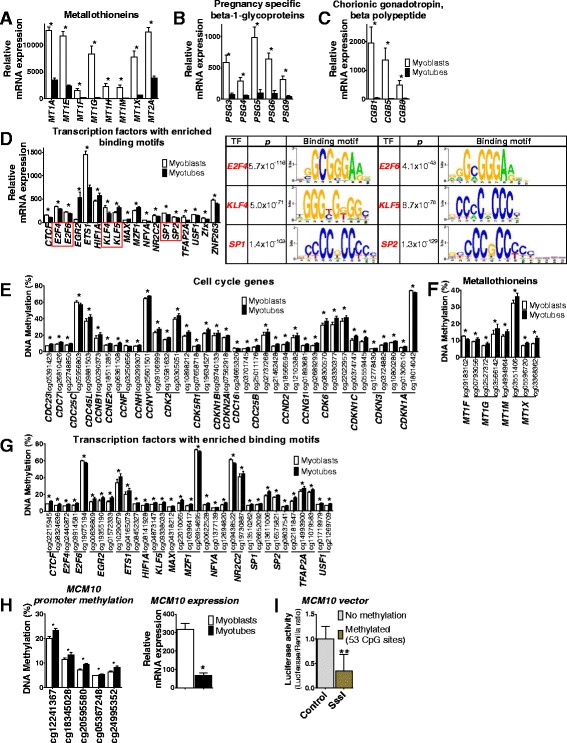
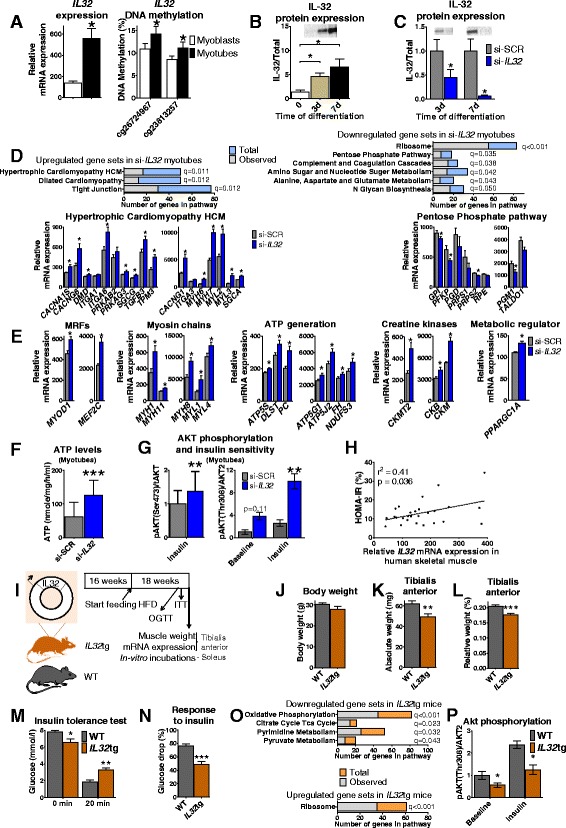
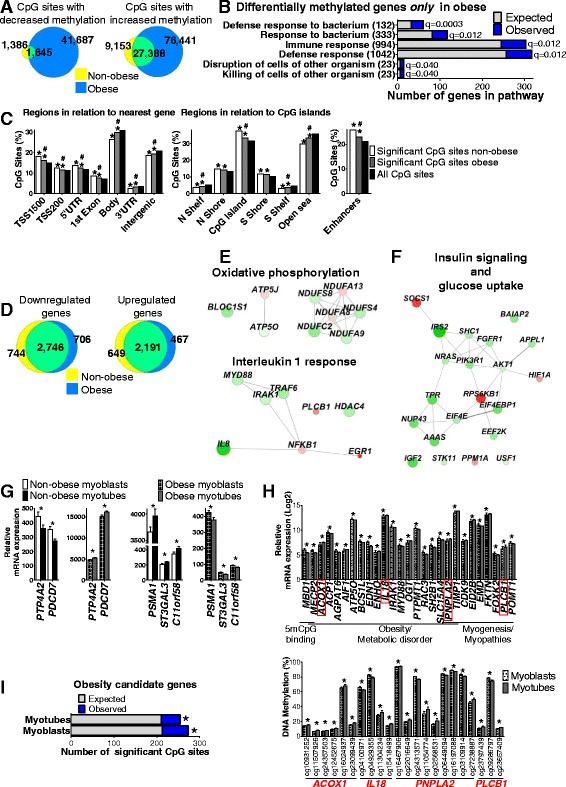
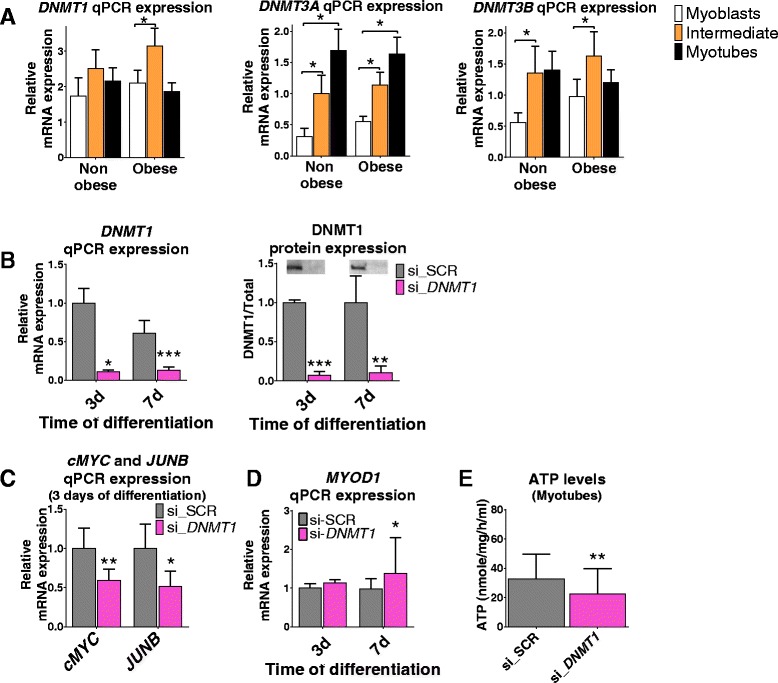
Results: We observed genome-wide changes in DNA methylation and expression patterns during differentiation of primary human muscle stem cells (myoblasts). We identified epigenetic and transcriptional changes of myogenic transcription factors (MYOD1, MYOG, MYF5, MYF6, PAX7, MEF2A, MEF2C, and MEF2D), cell cycle regulators, metabolic enzymes and genes previously not linked to myogenesis, including IL32, metallothioneins, and pregnancy-specific beta-1-glycoproteins. Functional studies demonstrated IL-32 as a novel target that regulates human myogenesis, insulin sensitivity and ATP levels in muscle cells. Furthermore, IL32 transgenic mice had reduced insulin response and muscle weight. Remarkably, approximately 3.7 times more methylation changes (147,161 versus 39,572) were observed during differentiation of myoblasts from obese versus non-obese subjects. In accordance, DNMT1 expression increased during myogenesis only in obese subjects. Interestingly, numerous genes implicated in metabolic diseases and epigenetic regulation showed differential methylation and expression during differentiation only in obese subjects.

Conclusions: Our study identifies IL-32 as a novel myogenic regulator, provides a comprehensive map of the dynamic epigenome during differentiation of human muscle stem cells and reveals abnormal epigenetic changes in obesity.

Keywords: ARPP21; CGB; DNA methylation; Epigenetics; IL-32; Insulin resistance; MT; Myogenesis; Obesity; PSG; TGF-β3.


Figures

Fig. 1
Fig. 1
The human methylome before versus after differentiation of human primary myoblasts. a An illustrative description of the study design and comparisons performed in cells of both non-obese and obese subjects. b Global DNA methylation was calculated as the average degree of methylation for all analyzed CpG sites before (n = 14) and after (n = 14) differentiation of myoblasts of non-obese subjects based on Illumina’s annotations to different gene regions and CpG island regions. Data are presented as mean ± SEM. Total number of sites per region: TSS1500, 83,650; TSS200, 62,369; 5’UTR, 64,909; 1st Exon, 39,236; Body, 172,275; 3’UTR, 19,349; Intergenic, 116,209. c A pie chart showing the number and proportions of individual CpG sites with significantly increased and decreased methylation, respectively, in human myoblasts compared with myotubes (q < 0.05) of non-obese subjects (n = 14). d Proportions of significant CpG sites with a certain degree of methylation before differentiation compared with the proportions of all analyzed sites. e DNA methylation of the three most significant CpG sites annotated to key myogenic transcription factors in human myoblasts versus myotubes of non-obese subjects. f Global DNA methylation was calculated as the average degree of methylation for all analyzed non-CpG sites before and after differentiation in non-obese subjects based on Illumina’s annotations to different gene region and CpG island regions. Data are presented as mean ± SEM. TSS, proximal promoter, defined as 200 bp (base pairs) or 1500 bp upstream of transcription start site; UTR, untranslated region; CpG island, 200 bp (or more) stretch of DNA with a C + G content greater than 50% and an observed CpG/expected CpG in excess of 0.6; Shore, the flanking region of CpG islands, 0–2000 bp; Shelf, regions flanking island shores, i.e., covering 2000–4000 bp distant from the CpG island. * q < 0.05
Fig. 2
Fig. 2
Transcriptional changes before versus after differentiation of human primary myoblasts of non-obese subjects. a Significant changes in mRNA expression of key myogenic transcription factors in human myoblasts (n = 13) versus myotubes (n = 13) of non-obese subjects. Significantly enriched downregulated (b) and upregulated (c) gene sets in Gene Set Enrichment Analysis with FDR < 5% (q < 0.05) based on differential gene expression in human myoblasts versus myotubes of non-obese subjects. Significant changes in mRNA expression of genes encoding cell cycle proteins (d), myosin heavy and light chains (e), proteins in the respiratory chain (f), and cytokines and their receptors (g) in human myoblasts versus myotubes of non-obese subjects (n = 13). Data are presented as mean ± SEM. ECM, Extracellular matrix; Val, Valine; Leu, Leucine; Ile, Isoleucine. * q < 0.05
Fig. 3
Fig. 3
Newly identified gene families, transcription factor binding motifs, and overlapping changes in gene expression and DNA methylation before versus after differentiation of human primary myoblasts of non-obese subjects. Significant changes in mRNA expression of genes encoding metallothioneins (a), pregnancy-specific beta-1 glycoproteins (b), and chorionic gonadotropin beta polypeptides (c) in human myoblasts versus myotubes of non-obese subjects (n = 13). d To the left is mRNA expression of identified transcription factors with significant enrichment of binding motifs in promoter regions of all differentially expressed genes in human myoblasts versus myotubes of non-obese subjects (n = 13). Those with a red box are further emphasized to the right in the figure. This figure shows Bonferroni adjusted P values and binding motifs for enriched transcription factors in the SP/KLF family and E2F transcription factor family. DNA methylation of the three most significant CpG sites in myoblasts versus myotubes annotated to genes that also showed differential mRNA expression among cell cycle genes (e), metallothioneins (f), and transcription factors with enriched binding motifs among all differentially expressed genes (g) in non-obese subjects (n = 14). (See also Figs. 2d, 3a and d). h Increased promoter methylation and reduced expression of MCM10 during differentiation. i In vitro methylation of the MCM10 promoter resulted in decreased transcriptional activity, measured as luciferase activity (n = 4, **P < 0.01). Data are presented as mean ± SEM. TF, Transcription factor. * q < 0.05
Fig. 4
Fig. 4
Silencing of IL32 influences differentiation capacity and insulin signaling whereas IL32 overexpression in mice impairs insulin sensitivity. a Array data of mRNA expression and DNA methylation (only significant sites) of IL32 before versus after differentiation of primary human myoblasts from non-obese subjects (n = 13, *q < 0.05). b Protein expression of IL-32 in primary human myoblasts (0 h) and after 3 and 7 days of differentiation. Stain-free total protein staining was used for normalization. A representative blot is shown above the bars (n = 7). c Increased protein level of IL-32 found during differentiation was significantly blocked with siRNA after 3 and 7 days of differentiation of myoblasts. The average of Si-SCR is set to 1 at both time points. Stain-free total protein staining was used for normalization. Representative blots are shown above the bars. d Significantly enriched gene sets in Gene Set Enrichment Analysis (GSEA) based on differential gene expression in IL-32 deficient myotubes (day 7) versus control (si-SCR). Lower panels show expression of genes contributing to the gene sets Hypertrophic Cardiomyopathy HCM and Pentose Phosphate Pathway (n = 5, *q < 0.05). e A number of genes involved in myogenesis and metabolism with significantly different expression between IL-32 deficient myotubes (day 7) and control (n = 5, *q < 0.05). Silencing of IL32 was associated with increased levels of ATP (f) and increased insulin-stimulated AKT phosphorylation at Ser473 and Thr308 (n = 3) (g) in differentiated myotubes (day 7). h The expression of IL32 in skeletal muscle biopsies obtained from 27 adult men correlated positively with HOMA-IR (Pearson correlation). i Experimental set-up of the mouse study with IL32tg mice showing the duration of HFD, including time points for different analyses. j There was no difference in body weight between IL32tg and WT mice after 18 weeks on a HFD. IL32tg mice had significantly lighter tibialis anterior in absolute value (k) and in relation to body weight (l) compared to WT after 18 weeks on a HFD. IL32tg mice had lower glucose levels in the fasted state and higher levels 20 minutes after intravenous insulin administration compared with WT (m), resulting in a decreased insulin response (n). o Significantly enriched gene sets in GSEA based on differential gene expression in tibialis anterior from IL32tg versus WT mice after 18 weeks on a HFD (n = 6). p Soleus from IL32tg mice have decreased Akt phosphorylation at Thr308 after 30 minutes in vitro incubation with or without insulin (WT n = 4, IL32tg n = 5). Data are presented as mean ± SEM, n = 4 for cell experiments, n = 10 for WT mice, and n = 9 for IL32tg mice if nothing else stated. WT, Wild type mice (control); IL32tg, IL32 transgenic mice; HFD, High fat diet; * P < 0.05, ** P < 0.01, *** P < 0.001 for figure b and eo. Statistics were calculated with paired t-test for cell experiments and Mann–Whitney U test for mice data
Fig. 5
Fig. 5
Differences in DNA methylation and gene expression before versus after differentiation of human primary myoblasts of obese and non-obese subjects. a Overlap of significant CpG sites with decreased and increased DNA methylation, respectively, after differentiation of human primary myoblasts of non-obese (n = 14) and obese (n = 14) subjects. b Significantly enriched gene ontology (GO)-terms (q < 0.05) of genes that exhibit differential DNA methylation only in obese. c Distribution of significant CpG sites that showed differential DNA methylation during myogenesis in non-obese and obese subjects compared with all analyzed CpG sites on the array and also between non-obese and obese in relation to gene regions, CpG island regions, and enhancer-regions. * P χ2 < 0.05 compared with all analyzed, # P χ2 < 0.05 between non-obese and obese subjects. d Overlap of downregulated and upregulated genes during myogenesis between non-obese (n = 13) and obese subjects (n = 13). Networks of certain genes only differentially expressed during myogenesis in obese (e) and non-obese (f) subjects, respectively, and related GO-terms to these genes. Green, downregulated; red, upregulated. Node size is based on expression fold change. g Genes (different probes) regulated in opposite directions during myogenesis in non-obese and obese subjects (* q < 0.05). h The top graph shows mRNA expression of genes only differentially expressed and methylated in obese subjects during myogenesis that are associated with DNA methylation, obesity, and/or metabolic disorders as well as myogenesis and/or myopathies. Values are presented as log2 to reduce magnitude and better visualize expression of all genes grouped in each category in one graph. The lower graph shows DNA methylation of significant CpG sites annotated to genes with a red box in the top graph (* q < 0.05). i Significant enrichment of the number of CpG sites within obesity candidate genes with differential DNA methylation at P < 0.05 between non-obese and obese subjects in myoblasts and myotubes, respectively (* P χ2 < 0.05). Data are presented as mean ± SEM
Fig. 6
Fig. 6
DNMT1, DNMT3A, and DNMT3B during differentiation of primary human myoblasts. a mRNA expression of DNMT1, DNMT3A, and DNMT3B in myoblasts, after 2 days of differentiation (intermediate) and in differentiated myotubes from six non-obese and six obese subjects. b siRNA silencing of DNMT1 in the myoblasts was confirmed after 3 and 7 days of differentiation at mRNA and protein levels. The average of Si-SCR is set to 1 at both time points for protein expression. Stain-free total protein staining was used for normalization. Representative blots are shown above the bars. Silencing of DNMT1 resulted in reduced expression of cMYC and JUNB after 3 days of differentiation (c) as well as increased expression of MYOD1 (n = 7) (d) and reduced levels of ATP (n = 3) in myotubes (day 7) (e). Data are presented as mean ± SEM, n = 4 for (be) if nothing else stated, except protein levels in (b) at day 3, where n = 3. *P < 0.05, **P < 0.01, ***P < 0.001

Similar articles

Cited by

References

    1. Serrano AL, Baeza-Raja B, Perdiguero E, Jardi M, Munoz-Cinoves P. Interleukin-6 is an essential regulator of satellite cell-mediated skeletal muscle hypertrophy. Cell Metab. 2008;7(1):33–44. doi: 10.1016/j.cmet.2007.11.011. - DOI - PubMed
    1. Petrella JK, Kim JS, Mayhew DL, Cross JM, Bamman MM. Potent myofiber hypertrophy during resistance training in humans is associated with satellite cell-mediated myonuclear addition: a cluster analysis. J Appl Physiol. 2008;104(6):1736–42. doi: 10.1152/japplphysiol.01215.2007. - DOI - PubMed
    1. Relaix F, Zammit PS. Satellite cells are essential for skeletal muscle regeneration: the cell on the edge returns centre stage. Development. 2012;139(16):2845–56. doi: 10.1242/dev.069088. - DOI - PubMed
    1. Ciciliot S, Schiaffino S. Regeneration of mammalian skeletal muscle. Basic mechanisms and clinical implications. Curr Pharm Des. 2010;16(8):906–14. doi: 10.2174/138161210790883453. - DOI - PubMed
    1. Liu N, Nelson BR, Bezprozvannaya S, Shelton JM, Richardson JA, Bassel-Duby R, Olson EN. Requirement of MEF2A, C, and D for skeletal muscle regeneration. Proc Natl Acad Sci U S A. 2014;111(11):4109–14. doi: 10.1073/pnas.1401732111. - DOI - PMC - PubMed