. 2017 Sep;15(9):1444-1452.e6.
doi: 10.1016/j.cgh.2017.02.007. Epub 2017 Feb 20.

Increases in IgE, Eosinophils, and Mast Cells Can be Used in Diagnosis and to Predict Relapse of IgG4-Related Disease

Affiliations

Increases in IgE, Eosinophils, and Mast Cells Can be Used in Diagnosis and to Predict Relapse of IgG4-Related Disease

Emma L Culver et al. Clin Gastroenterol Hepatol. 2017 Sep.

Abstract

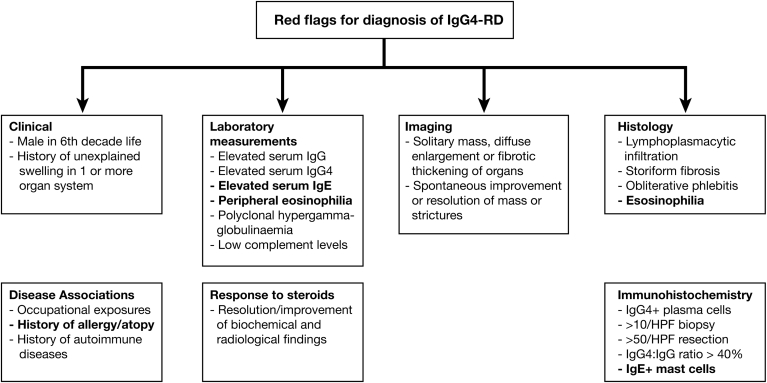
Background & aims: IgG subclass 4-related disease (IgG4-RD) is characterized by increased serum levels of IgG4 and infiltration of biliary, pancreatic, and other tissues by IgG4-positive plasma cells. We assessed the prevalence of allergy and/or atopy, serum, and tissue IgE antibodies, and blood and tissue eosinophils in patients with IgG4-RD. We investigated the association between serum IgE and diagnosis and relapse of this disease.

Methods: We performed a prospective study of 48 patients with IgG4-RD, 42 patients with an increased serum level of IgG4 with other inflammatory and autoimmune conditions (disease control subjects), and 51 healthy individuals (healthy control subjects) recruited from Oxford, United Kingdom from March 2010 through March 2014, and followed for a median of 41 months (range, 3-73 months). Serum levels of immunoglobulin were measured at diagnosis, during steroid treatment, and at disease relapse for patients with IgG4-RD; levels at diagnosis were compared with baseline levels of control subjects. Allergen-specific IgEs were measured using the IgE ImmunoCAP. Levels and distribution of IgG4 and IgE antibodies in lymphoid, biliary, and pancreatic tissues from patients with IgG4-RD and disease control subjects were measured by immunohistochemistry. We analyzed data using the Spearman rank correlation and receiver operating characteristic curves.

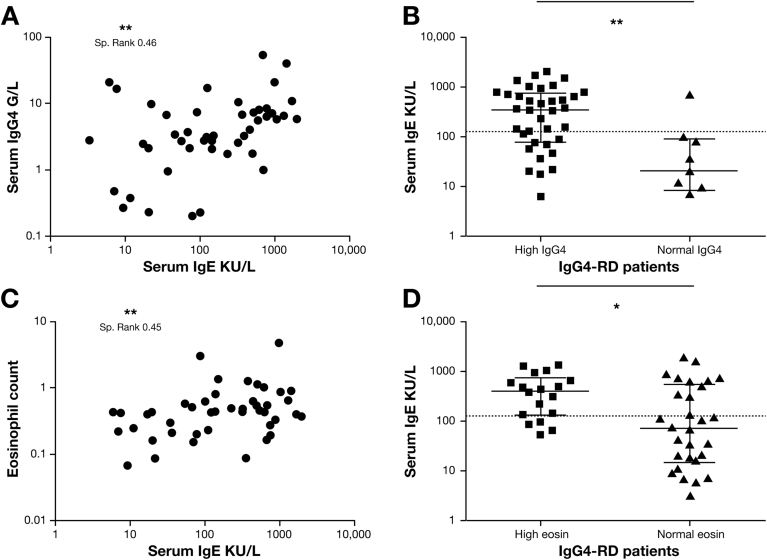
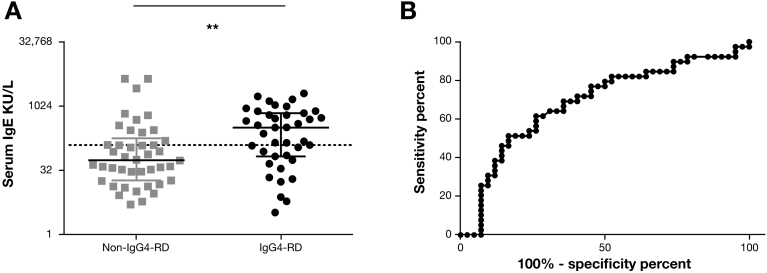
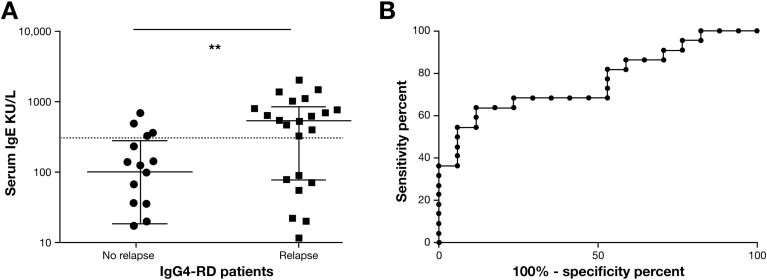
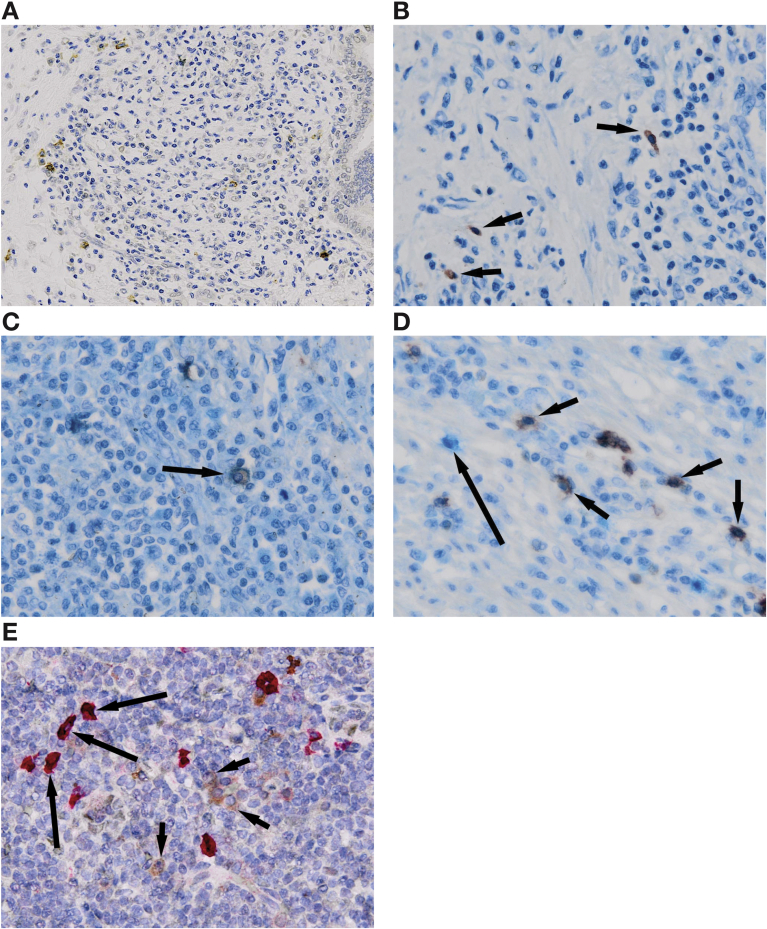
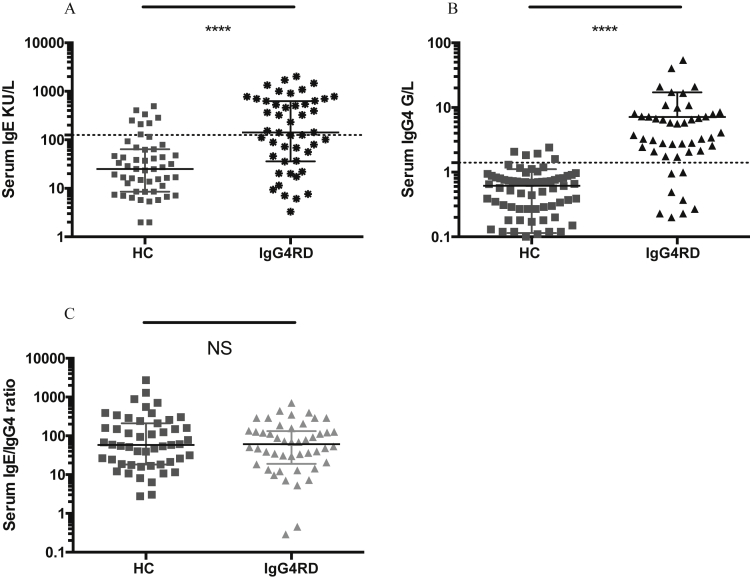
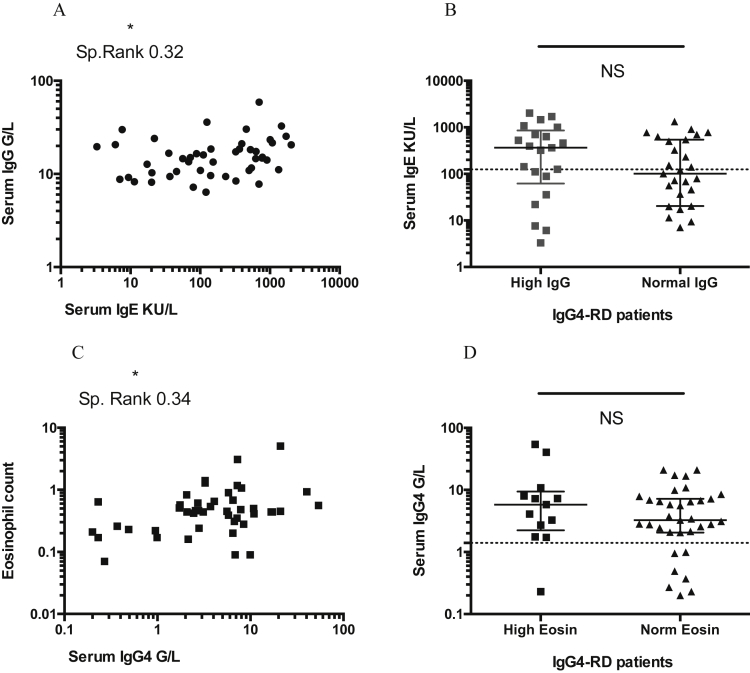
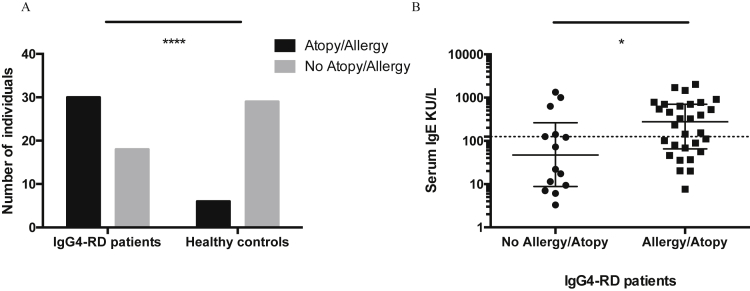
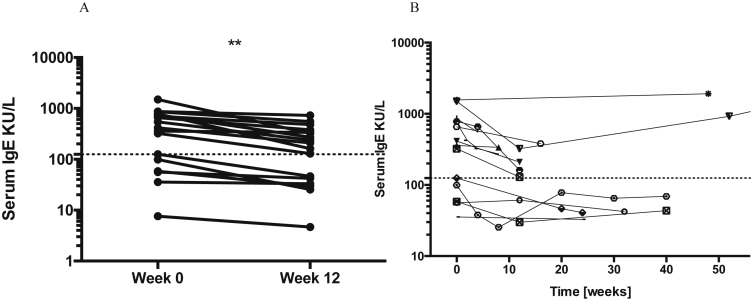
Results: Serum levels of IgG4 increased to 1.4 g/L or more, and IgE increased to 125 kIU/L or more, in 81% and 54% of patients with IgG4-RD, respectively, compared with 6% and 16% of healthy control subjects (P < .0001). Peripheral blood eosinophilia was detected in 38% of patients with IgG4-RD versus 9% of healthy control subjects (P = .004). Of patients with IgG4-RD, 63% had a history of allergy and 40% had a history of atopy with an IgE-specific response; these values were 60% and 53% in patients with increased serum levels of IgE (P < .05). Level of IgE at diagnosis >480 kIU/L distinguished patients with IgG4-RD from disease control subjects with 86% specificity, 36% sensitivity, and a likelihood ratio of 3.2. Level of IgE at diagnosis >380 kIU/L identified patients with disease relapse with 88% specificity, 64% sensitivity, and a likelihood ratio of 5.4. IgE-positive mast cells and eosinophilia were observed in lymphoid, biliary, and pancreatic tissue samples from 50% and 86% of patients with IgG4-RD, respectively.

Conclusions: In a prospective study, we associated IgG4-RD with allergy, atopy, eosinophilia, increased serum levels of IgE, and IgE-positive mast cells in lymphoid, biliary, and pancreatic tissue. An IgE-mediated allergic response therefore seems to develop in most patients with IgG4-RD; levels of IgE might be used in diagnosis and predicting relapse.

Keywords: Detection; Immune Response; Inflammation; Pancreas.


Figures

Figure 1
Figure 1
The relationship of serum IgE with serum IgG4 and peripheral blood eosinophil counts in IgG4-RD. (A) Correlation plots showing serum IgE (kIU/L) plotted against serum IgG4 (g/L) in IgG4-RD. (B) Dot plots of serum IgE in IgG4-RD patients with a high (≥1.4 g/L) or normal serum IgG4. Dashed line is the serum IgE upper limit of normal (≥125 kIU/L). (C) Correlation plots showing blood eosinophil count (cells/μL) plotted against serum IgE (kIU/L) in IgG4-RD. (D) Dot plots of serum IgE in IgG4-RD patients with a high (≥500 cells/μL) or normal eosinophil count. Dashed line is the serum IgE upper limit of normal (≥125 kIU/L). Spearman rank correlation and P values are expressed as NS ≥0.05, *P < .05, **P < .01. Mann-Whitney P values, where NS P ≥ .05, *P < .05.
Figure 2
Figure 2
Serum IgE levels and receiver operating characteristic curve to differentiate IgG4-RD patients and non-IgG4-RD disease control subjects with an elevated serum IgG4. (A) Dot plot showing serum IgE in IgG4-RD patients and non-IgG4-RD disease control subjects with an elevated serum IgG4. The y-axis shows the serum IgE concentration (kIU/L). Dashed line is the serum IgE upper limit of normal (≥125 kIU/L). Mann-Whitney P values *P < .05. (B) Receiver operating characteristic curve shows the sensitivity and specificity of IgE in distinguishing IgG4-RD from non-IgG4-RD conditions, with an elevated serum IgG4.
Figure 3
Figure 3
Serum IgE levels and receiver operating characteristic curve for disease relapse in IgG4-RD patients. (A) Dot plot showing serum IgE in IgG4-RD patients with and without evidence of biochemical and radiologic disease relapse. The y-axis shows the serum IgE concentration (kIU/L). Dashed line indicates a serum IgE of 380 kIU/L). Mann-Whitney P values NS P ≥ .05, **P < .01. (B) Receiver operating characteristic curve shows the sensitivity and specificity of IgE at diagnosis in determining disease relapse in IgG4-RD patients.
Figure 4
Figure 4
Immunohistochemical staining for inflammatory cell subsets and IgE in IgG4-RD. (A) Type 1 autoimmune pancreatitis, showing IgE-positive cells (brown) within the inflammatory cell infiltrate (IgE immunohistochemistry, original magnification ×200). (B) IgG4-related sialadenitis, showing mast cells (red; arrows) within the inflammatory cell infiltrate (mast cell tryptase immunohistochemistry, original magnification ×400). (C) Type 1 autoimmune pancreatitis, showing a mast cell (red cytoplasm) expressing surface IgE (pale blue, in contrast to dark blue hematoxylin counterstain; arrow) within the inflammatory infiltrate (mast cell tryptase [red] and IgE [pale blue] double immunohistochemistry, original magnification ×400). (D) Type 1 autoimmune pancreatitis, showing CD20-positive B-cells (red; short arrows) not expressing IgE; and a separate inflammatory cell (not CD20-positive) expressing IgE (pale blue, in contrast to dark blue hematoxylin counterstain; long arrow) within the inflammatory cell infiltrate (CD20 [red] and IgE [pale blue] double immunohistochemistry, original magnification ×400). (E) Nasal polyp, showing CD138-positive plasma cells (bright red; long arrows) and a separate population of CD138-negative and IgE-positive cells (brown; short arrows) within the inflammatory cell infiltrate (CD138 [bright red] and IgE [brown] double immunohistochemistry, original magnification ×400).
Figure 5
Figure 5
Red flags in the diagnosis of IgG4-RD. A set of red flags to raise suspicion of a diagnosis of IgG4-RD.
Supplementary Figure 1
Serum IgG4 and IgE levels and IgE/IgG4 ratio in IgG4-RD and HC. Dot plots showing (A) serum IgG4 concentrations, (B) serum IgE concentrations, (C) IgE/IgG4 ratio (kIU/g), in IgG4-RD patients and HC. The y-axis shows the serum IgE concentration (KU/L), serum IgG4 (g/L), or IgE/IgG4 ratio. Dashed line is the serum IgE upper limit of normal (≥125 kIU/L) and serum IgG4 upper limit of normal (≥1.4 g/L). Mann-Whitney P values; NS P < .05, ****P < .0001.
Supplementary Figure 2
The relationship of serum IgE with serum IgG, and serum IgG4 with peripheral blood eosinophil count, in IgG4-RD. (A) Correlation plots showing serum IgE (kIU/L) concentration plotted against serum IgG (g/L) concentrations in IgG4-RD. (B) Dot plots of serum IgE concentrations in IgG4-RD patients with a high (≥16.0 g/L) or normal serum IgG. Dashed line is the serum IgE upper limit of normal (≥125 kIU/L). (C) Correlation plots showing blood eosinophil count (cells/μL) plotted against serum IgG4 (g/L) concentrations in IgG4-RD. (D) Dot plots of serum IgG4 concentrations in IgG4-RD patients with a high (≥500 cells/μL) or normal eosinophil count. Dashed line is the serum IgE upper limit of normal (≥125 kIU/L). Spearman rank correlation coefficient and P values are expressed as NS ≥0.05, *P < .05, Mann-Whitney P values, where NS P ≥ .05, *P < .05. Sp., Spearman.
Supplementary Figure 3
Allergy and/or atopy and serum IgE levels in IgG4-RD patients and healthy control subjects. (A) Bar chart showing the number of IgG4-RD patients and healthy control subjects with (black) or without (grey) a history of allergy and/or atopy. (B) Dot plot showing serum IgE concentration (kIU/L) in IgG4-RD patients with and without a history of allergy and/or atopy. Dashed line is the serum IgE upper limit of normal (≥125 kIU/L). Mann-Whitney P values, where *P < .05, ****P < .0001.
Supplementary Figure 4
Serum IgE and relationship to corticosteroid therapy in IgG4-RD. (A) Serum IgE concentrations in IgG4-RD patients at diagnosis before corticosteroids (0 weeks) and after 12 weeks of corticosteroid therapy (n = 15). On the y-axis is serum IgE concentrations kIU/L. Dashed line is the upper limit of IgE (≥125 kIU/L). Two-tailed paired Student t test P values, where **P < .01. (B) Serum IgE concentrations in IgG4-RD patients during follow-up over 12 months of corticosteroid therapy. The dashed line is the same as in A.

Similar articles

Cited by

References

    1. Deshpande V., Zen Y., Chan J.K. Consensus statement on the pathology of IgG4-related disease. Mod Pathol. 2012;25:1181–1192. - PubMed
    1. Kamisawa T., Anjiki H., Egawa N. Allergic manifestations in autoimmune pancreatitis. Eur J Gastroenterol Hepatol. 2009;21:1136–1139. - PubMed
    1. Hirano K., Tada M., Isayama H. Clinical analysis of high serum IgE in autoimmune pancreatitis. World J Gastroenterol. 2010;16:5241–5246. - PMC - PubMed
    1. Sah R.P., Pannala R., Chari S.T. Prevalence, diagnosis, and profile of autoimmune pancreatitis presenting with features of acute or chronic pancreatitis. Clin Gastroenterol Hepatol. 2010;8:91–96. - PubMed
    1. Umemura T., Zen Y., Hamano H. Immunoglobin G4-hepatopathy: association of immunoglobin G4-bearing plasma cells in liver with autoimmune pancreatitis. Hepatology. 2007;46:463–471. - PubMed