. 2017 Mar 14;114(11):2848-2853.
doi: 10.1073/pnas.1611576114. Epub 2017 Feb 21.

Selenium deficiency risk predicted to increase under future climate change

Affiliations

Selenium deficiency risk predicted to increase under future climate change

Gerrad D Jones et al. Proc Natl Acad Sci U S A. .

Abstract

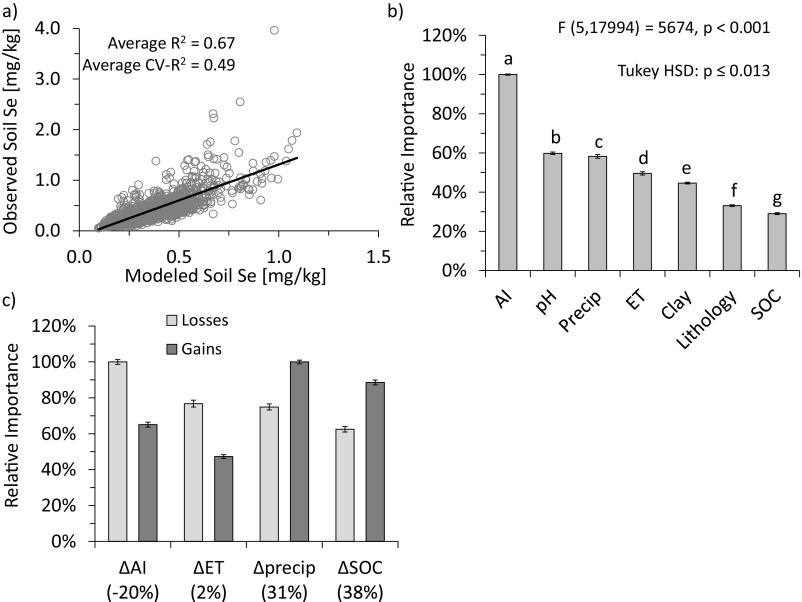
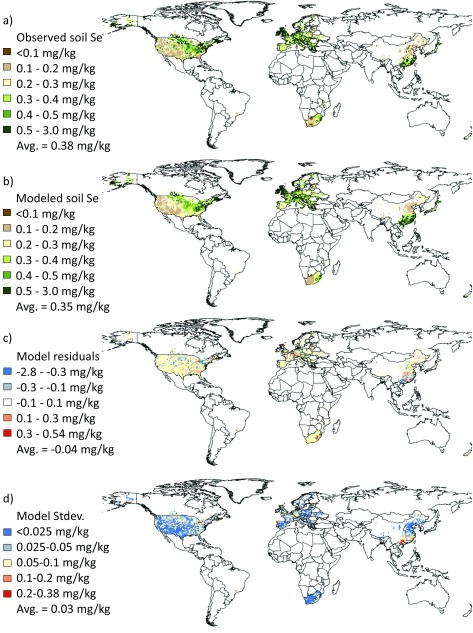
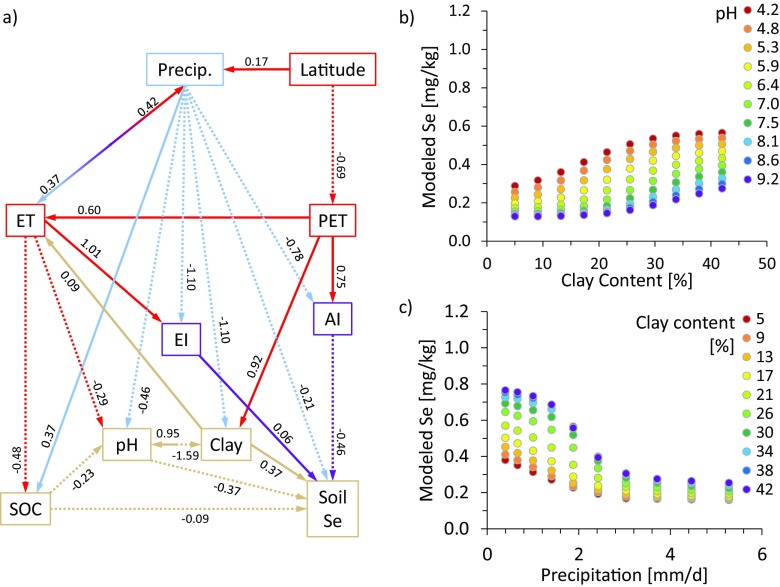
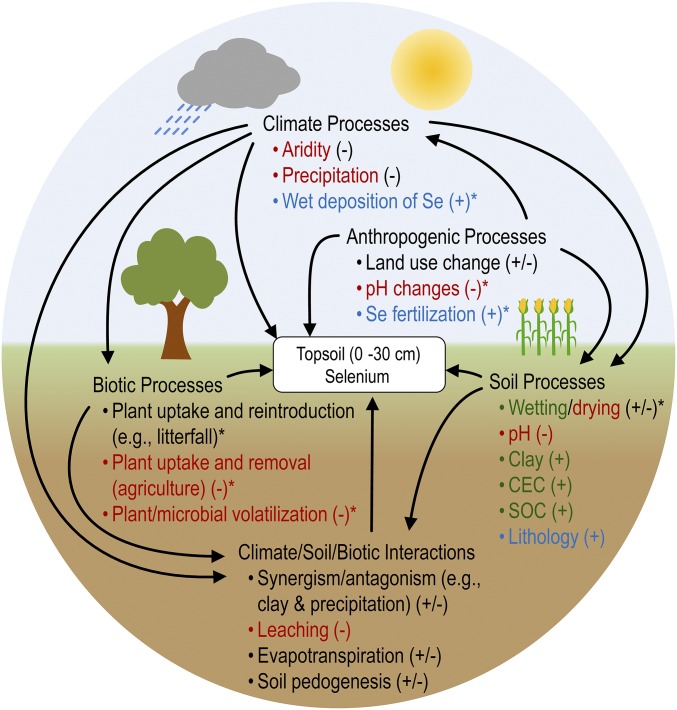
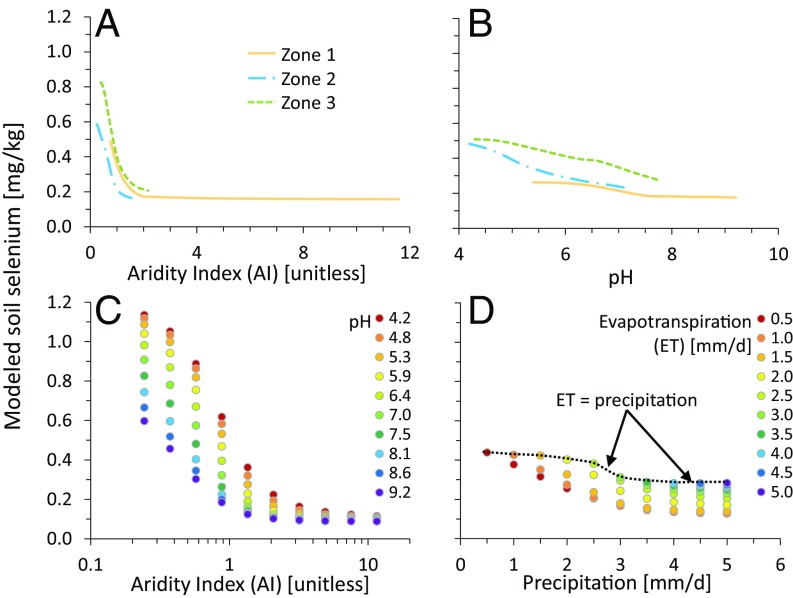
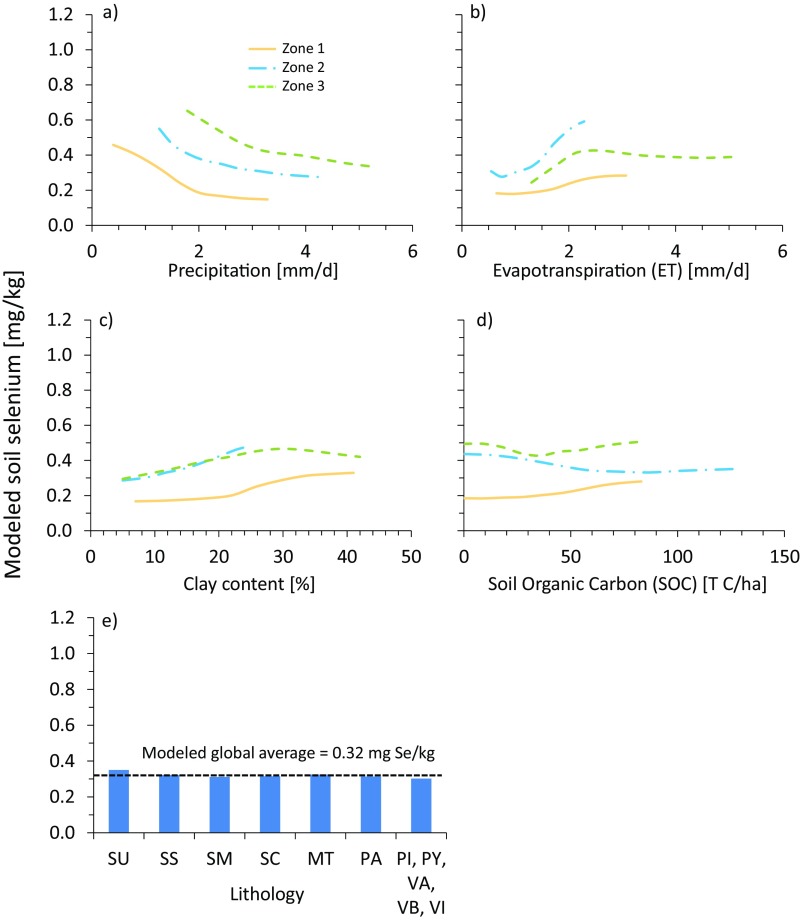
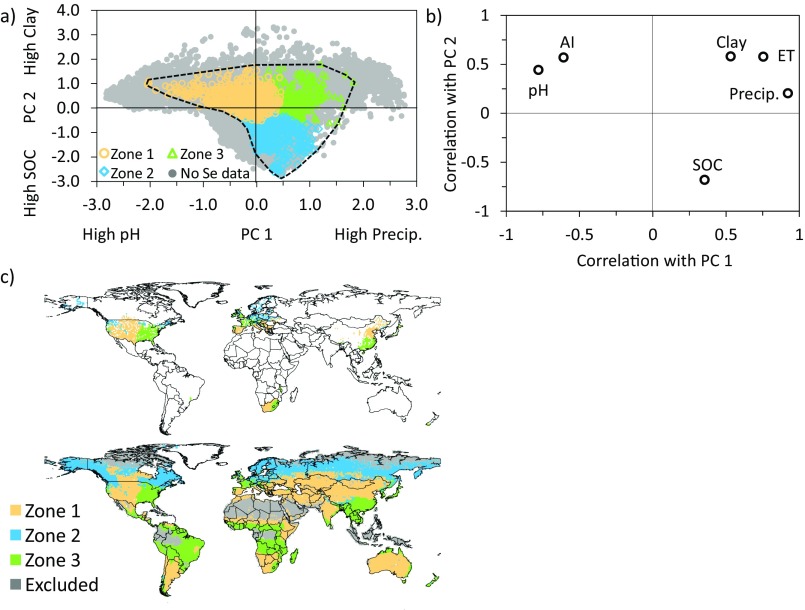
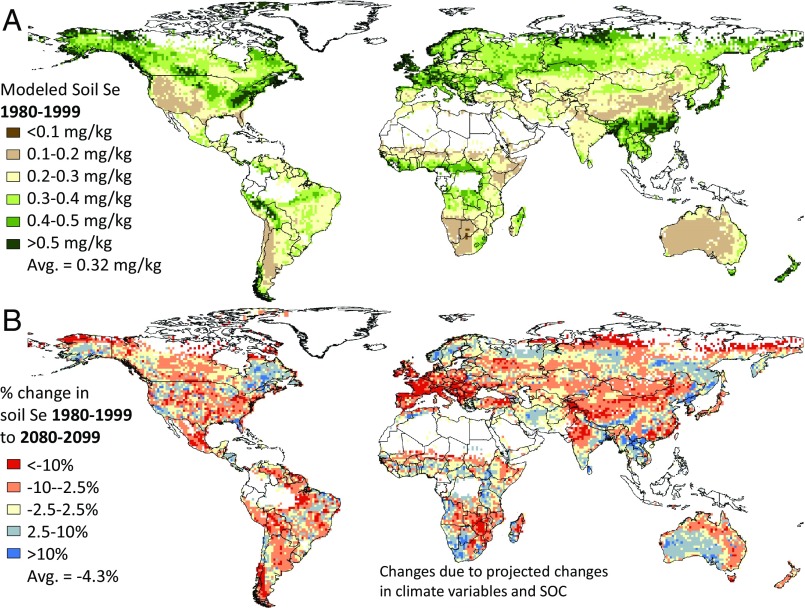
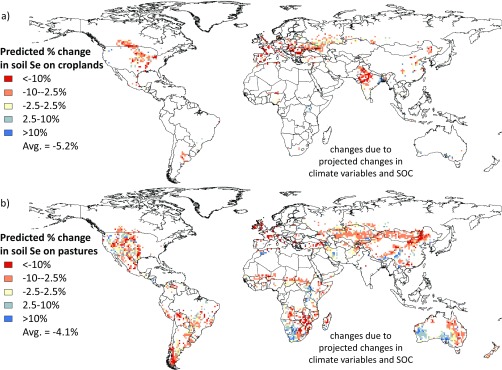
Deficiencies of micronutrients, including essential trace elements, affect up to 3 billion people worldwide. The dietary availability of trace elements is determined largely by their soil concentrations. Until now, the mechanisms governing soil concentrations have been evaluated in small-scale studies, which identify soil physicochemical properties as governing variables. However, global concentrations of trace elements and the factors controlling their distributions are virtually unknown. We used 33,241 soil data points to model recent (1980-1999) global distributions of Selenium (Se), an essential trace element that is required for humans. Worldwide, up to one in seven people have been estimated to have low dietary Se intake. Contrary to small-scale studies, soil Se concentrations were dominated by climate-soil interactions. Using moderate climate-change scenarios for 2080-2099, we predicted that changes in climate and soil organic carbon content will lead to overall decreased soil Se concentrations, particularly in agricultural areas; these decreases could increase the prevalence of Se deficiency. The importance of climate-soil interactions to Se distributions suggests that other trace elements with similar retention mechanisms will be similarly affected by climate change.

Keywords: climate change; global distribution; prediction; selenium; soils.


Conflict of interest statement

The authors declare no conflict of interest.

Figures

Fig. S1.
Fig. S1.
Performance and variable importance of the predictive models. (A) Scatter plot of the observed and predicted soil Se concentrations (n = 1,642) based on the predictive models including the average training and cross-validation (CV) performance (n = 1,000 iterations per model). (B) The average variable importance for the recent (1980–1999) predictions was calculated for each model iteration (n = 1,000) for all three predictive models. A one-way ANOVA was used to determine that the mean importance of the variables were statistically different (statistical values are given in the figure). The Tukey honestly significant difference (HSD) post hoc test was used to determine that all variables were statistically different from all others at α = 0.05 (differences are indicated by different letters; P ≤ 0.013 for all variables). (C) Predicted losses and gains in soil Se were modeled between 1980–1999 and 2080–2099 based on changes in climate variables and SOC. The percentages below the variables indicate the average percentage change in each variable for all modeled pixels. Error bars represent 95% confidence intervals.
Fig. S2.
Fig. S2.
Geographical representation of the predictive modeling. Maps illustrate the observed soil Se concentrations (A), modeled soil Se concentrations in known areas (B), averaged residuals (modeled − observed) of the predictive models (C), and SD of the global soil Se predictions (D). Pixels depict the average of the predictive models. The pixel resolution is 1° (n = 1,642).
Fig. S3.
Fig. S3.
Multivariate interactions between predictor variables and soil Se. (A) An hypothesized model of the variables controlling soil Se concentrations was tested using SEM. All aggregated soil Se data points (n = 1,642) were used in the model. The solid lines indicate positive direct relationships and dotted lines indicate negative direct relationships between variables. Variables and lines colored red, blue, purple, and tan correspond to energy, precipitation, energy:precipitation ratios, and soil parameters, respectively. Standardized indirect effects and total effects can be found in Table S2. (B and C) Bivariate interactions between clay content and pH (B) and between precipitation and clay content (C) are illustrated. In bivariate analyses, parameters were allowed to vary between the minimum and maximum observed value with all other variables held constant at the observed mean value of the entire dataset (n = 1,642).
Fig. 1.
Fig. 1.
Summary of the processes governing soil Se concentrations. Dominant processes (and bulleted examples) governing soil Se concentrations are indicated. Text colored in red, green, and blue indicates processes affecting soil Se losses, retention, and sources/supplies, respectively. Factors responsible for increases (+) and/or decreases (−) in soil Se as well as processes not explicitly examined in our analysis (*) are indicated.
Fig. 2.
Fig. 2.
Univariate and bivariate sensitivity analyses of the predictive models. (A and B) The independent effects of AI (A) and precipitation (B) were modeled by holding all other variables constant at the zonal averages as defined by the two-step clustering. (C and D) Similarly, bivariate interactions between AI and clay (C) and between precipitation and ET (D) are illustrated. These parameters were allowed to vary between the minimum and maximum observed value while all other variables were held constant at the mean value of the entire dataset (n = 1,642). The dotted line in D indicates the conditions in which ET = precipitation. Other bivariate interactions are presented in Fig. S3.
Fig. S4.
Fig. S4.
Univariate sensitivity analyses of predictive models for (A) precipitation, (B) evapotranspiration, (C) clay content, (D) soil organic carbon, and (E) lithology. MT, metamorphic rocks; PA, acid plutonic rocks; PI, intermediate plutonic rocks; PY, pyroclastics; SC, carbonate sedimentary rocks; SM, mixed sedimentary rocks; SS, siliciclastic sedimentary rocks; SU, unconsolidated sediments; VA, acid volcanic rocks; VB, basic volcanic rocks; VI, intermediate volcanic rocks. Zones – correspond to those defined in Fig. S5.
Fig. S5.
Fig. S5.
Multivariate and geographic distributions of the three zones generalizing the soil and climate properties of the 1,642 aggregated data points following two-step clustering. (A) Scatter plot of PCs 1 and 2. Together PCs 1 and 2 account for 75.1% of the variability (46.8% and 28.3%, respectively) within the entire dataset. The variables with the greatest correlation are included along the axis. A polygon was drawn around this distribution, and if the points fell outside this polygon, the predictions were excluded. (B) Correlation matrix between both PCs and each continuous predictor variable. (C) The geographic distribution of each zone for known areas (Upper) and global areas (Lower) and the pixels that were excluded from the analysis (i.e., the pixels outside the polygon in A.
Fig. 3.
Fig. 3.
Geographical representation of the predictive modeling on a 1° scale. Maps illustrate the modeled soil Se concentrations (1980–1999) (A) and percentage change in soil Se concentrations between recent and future (2080–2099) conditions (B) as a function of projected changes in climate (RCP6.0 scenario) and SOC content (ECHAM5-A1B scenario). Predictions represent the average of the predictive models and were based on the AI, soil clay content, ET, lithology, pH, precipitation, and SOC.
Fig. S6.
Fig. S6.
Global predictive maps illustrating the percentage change in soil Se in agricultural lands resulting from changes in climate and SOC. Pixels indicate land use that is dominated (≥25% of land area) by croplands (A) and pastures (B) as defined in ref. .
Fig. S7.
Fig. S7.
Temporal trends of analytes in agricultural soils from the Rothamsted Broadbalk experiments. Total soil Se (A) and SOC (B) concentrations were measured in the control, woodland, and grassland plots. Samples were analyzed from soils that were originally collected from 1865–2010. In 1882 (vertical dashed line), part of the control plot was left uncultivated and maintained as grassland and forest (collectively referred to as the “wilderness”). Error bars represent SDs (n = 2–4).
Fig. S8.
Fig. S8.
Se concentrations for soil samples measured in 2016 vs. Se values extracted for the same location from a 1960s contour map. The data on the x axis were collected from a recent standardized soil geochemical survey (27); the data on the y axis were published as a contour map in the mid-1960s (the exact date is unknown) (59). The map from the 1960s was digitized in ArcGIS 10.2, and for each of the data points from the recent geochemical survey, the corresponding concentration was recorded from the digitized map. Because the data within the map were binned, each point was randomly assigned a concentration value that fell within the range of the bin.

References

    1. Stoltzfus RJ, Mullany L, Black RE. In: Iron Deficiency Anaemia. Comparative Quantification of Health Risks: Global and Regional Burden of Disease Attribution to Selected Major Risk Factors. Ezzati M, Lopez AD, Rodgers A, Murray CJL, editors. Vol 1. World Health Organization; Geneva: 2004. pp. 163–210.
    1. Adamson P. Vitamin and Mineral Deficiency: A Global Progress Report. Micronutrient Initiative; UNICEF, Ottawa: 2004.
    1. Fordyce FM. Selenium deficiency and toxicity in the environment. In: Selinus O, et al., editors. Essentials of Medical Geology. Springer; London: 2013. pp. 373–415.
    1. James L, et al. Selenium Poisoning in Livestock: A Review and Progress. Selenium in Agriculture and the Environment. Soil Science Society of America and American Society of Agronomy; Madison, WI: 1989. pp. 123–131.
    1. Chilimba ADC, et al. Maize grain and soil surveys reveal suboptimal dietary selenium intake is widespread in Malawi. Sci Rep. 2011;1(72):72. - PMC - PubMed

Publication types