. 2017 Jun;42(6):1713-1720.
doi: 10.1007/s00261-017-1077-8.

Assessment of liver iron overload by 3 T MRI

Affiliations
Free PMC article

Assessment of liver iron overload by 3 T MRI

A Paisant et al. Abdom Radiol (NY). 2017 Jun.
Free PMC article

Abstract

Purpose: To evaluate the performance and limitations of the signal intensity ratio method for quantifying liver iron overload at 3 T.

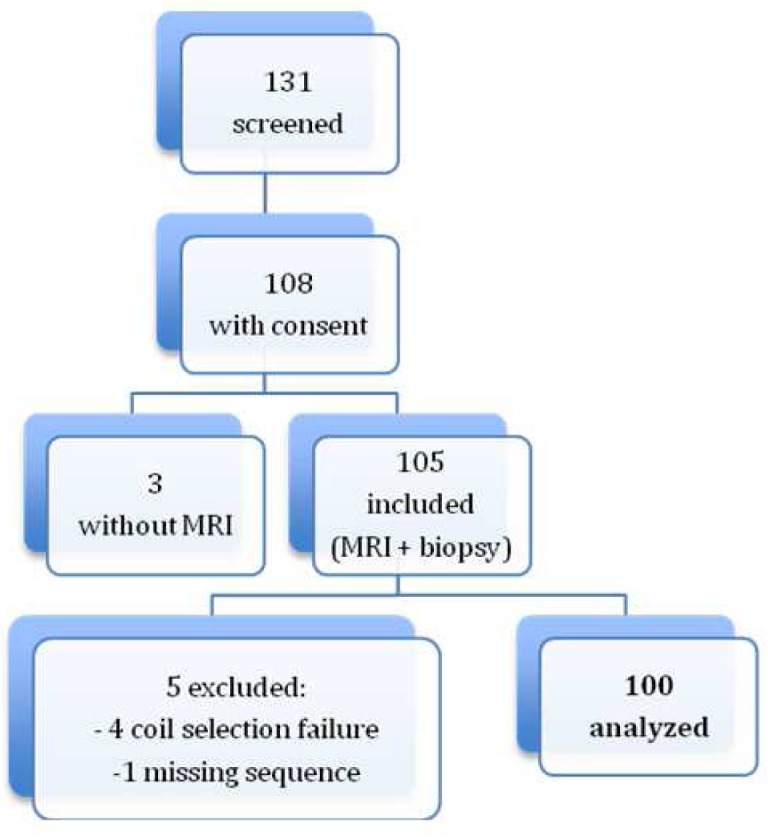
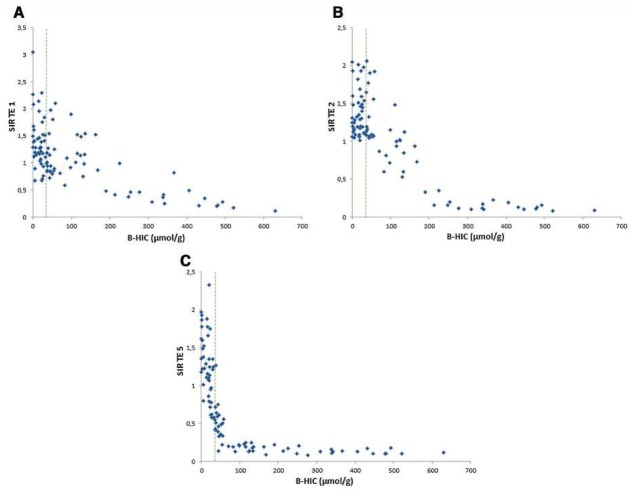
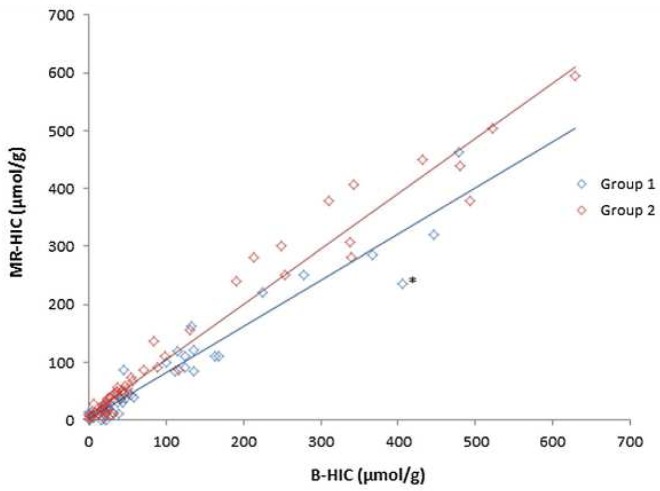
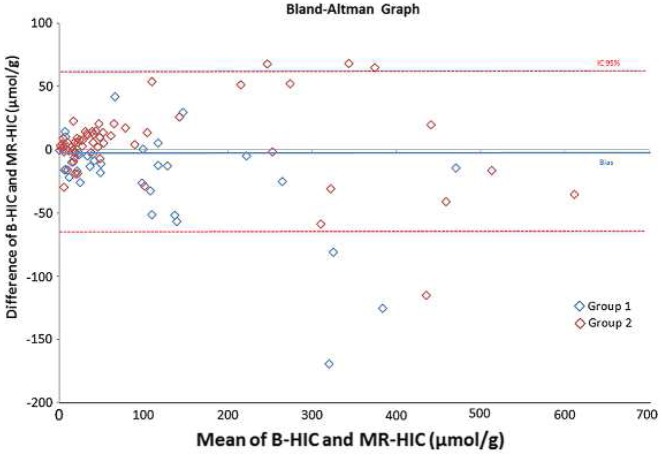
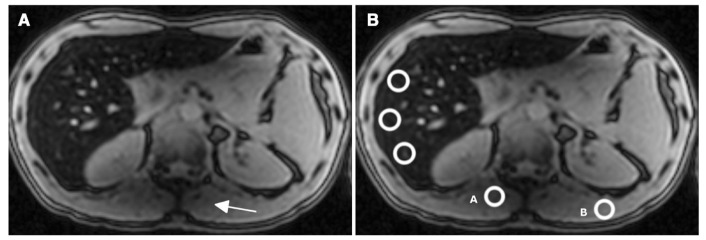
Methods: Institutional review board approval and written informed consent from all participants were obtained. One hundred and five patients were included prospectively. All patients underwent a liver biopsy with biochemical assessment of hepatic iron concentration and a 3 T MRI scan with 5 breath-hold single-echo gradient-echo sequences. Linear correlation between liver-to-muscle signal intensity ratio and liver iron concentration was calculated. The algorithm for calculating magnetic resonance hepatic iron concentration was adapted from the method described by Gandon et al. with echo times divided by 2. Sensitivity and specificity were calculated.

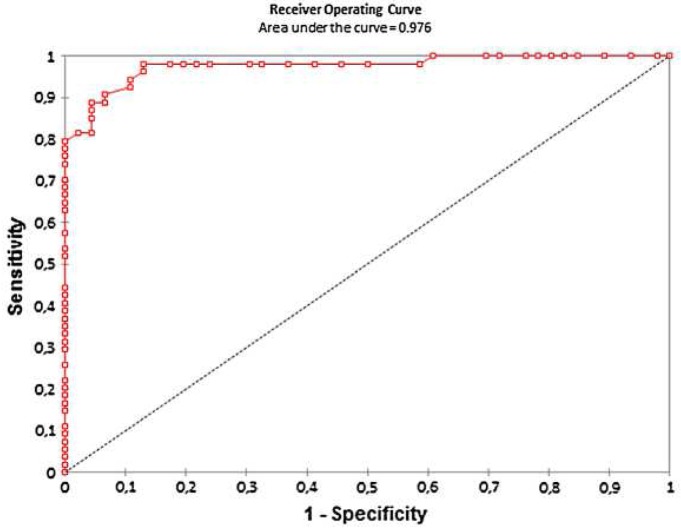
Results: Five patients were excluded (coil selection failure or missing sequence) and 100 patients were analyzed, 64 men and 36 women, 52 ± 13.3 years old, with a biochemical hepatic iron concentration range of 0-630 µmol/g. Linear correlation between biochemical hepatic iron concentration and MR-hepatic iron concentration was excellent with a correlation coefficient = 0.96, p < 0.0001. Sensitivity and specificity were, respectively, 83% (0.70-0.92) and 96% (0.85-0.99), with a pathological threshold of 36 µmol/g.

Conclusion: Signal intensity ratio method for quantifying liver iron overload can be used at 3 T with echo times divided by 2.

Keywords: 3 Tesla; Iron overload; Liver; MRI; Quantification.


Figures

Fig. 1
Fig. 1
Patient flow chart.
Fig. 2
Fig. 2
(a) Graphical representation of liver-to-muscle SIR as compared to B-HIC for the first echo. This TE enabled quantification in patients with severe overload, above 200 μmol/g, but led to dispersion and lack of correlation for mild overload cases. With this opposed-phase TE, a signal decrease can also be due to liver steatosis. (b) Graphical representation of liver-to-muscle SIR as compared to B-HIC for the second echo. This graph shows a progressive decrease in SIR between normal iron concentration and 200μmol/g. (c) Graphical representation of liver-to-muscle SIR as compared to B-HIC for the fourth echo. This graph shows a fast decrease in SIR as the iron concentration increases, achieving a more accurate evaluation of mild iron concentration, including in the normal range. The algorithm can be tuned to the appropriate echo according to the overload observed.
Fig. 3
Fig. 3
MR-HIC versus B-HIC correlation graph. Correlation between MR-HIC and B-HIC was very good (R2>0.95). When B-HIC is over 200 μmol/g, the correlation and R2 value are stable but a slight discordance can be noted for some values. The asterisk is a discordant point relates to a patient in Group 1 and detailed in fig 6.
Fig. 4
Fig. 4
Bland and Altman comparison between B-HIC and MR-HIC (μmol/g)
Fig. 5
Fig. 5
ROC curve performance of MRI with biopsy as the standard reference
Fig. 6
Fig. 6
This MRI corresponds to the forty-year old male patient marked by an asterisk in Figure 3 (B-HIC = 405 μmol/g and MR-HIC=236μmol/g). First echo (TE=1.15 msec) image. (a) The signal decreases in the left lobe of the liver and in the paraspinal muscles (arrowhead) due to a B1 heterogeneity artifact. (b) The MR-HIC estimation can vary between 190 and 390 μmol/g just by moving ROI A, in the artifact area, or B, outside the artifact area, to determine the muscle signal intensity reference.

References

    1. Blachier M, Leleu H, Peck-Radosavljevic M, Valla D-C, Roudot-Thoraval F. The burden of liver disease in Europe: a review of available epidemiological data. J Hepatol. 2013;58:593–608. doi: 10.1016/j.jhep.2012.12.005. - DOI - PubMed
    1. Deugnier Y, Turlin B. Iron and hepatocellular carcinoma. J Gastroenterol Hepatol. 2001;16:491–4. - PubMed
    1. Harrison SA, Bacon BR. Relation of hemochromatosis with hepatocellular carcinoma: epidemiology, natural history, pathophysiology, screening, treatment, and prevention. Med Clin North Am. 2005;89:391–409. doi: 10.1016/j.mcna.2004.08.005. - DOI - PubMed
    1. Niederau C, Fischer R, Sonnenberg A, Stremmel W, Trampisch HJ, Strohmeyer G. Survival and causes of death in cirrhotic and in noncirrhotic patients with primary hemochromatosis. N Engl J Med. 1985;313:1256–62. doi: 10.1056/NEJM198511143132004. - DOI - PubMed
    1. Brittenham GM, Badman DG National Institute of Diabetes and Digestive and Kidney Diseases (NIDDK)Workshop. Noninvasive measurement of iron: report of an NIDDK workshop. Blood. 2003;101:15–9. doi: 10.1182/blood-2002-06-1723. - DOI - PubMed

Publication types