

Modeling of free fatty acid dynamics: insulin and nicotinic acid resistance under acute and chronic treatments
- PMID: 28224315
- PMCID: PMC5424002
- DOI: 10.1007/s10928-017-9512-6
Modeling of free fatty acid dynamics: insulin and nicotinic acid resistance under acute and chronic treatments
Abstract
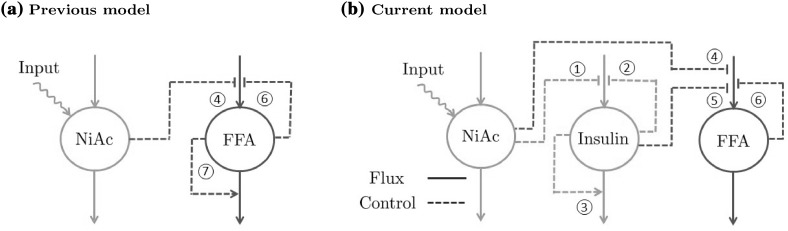
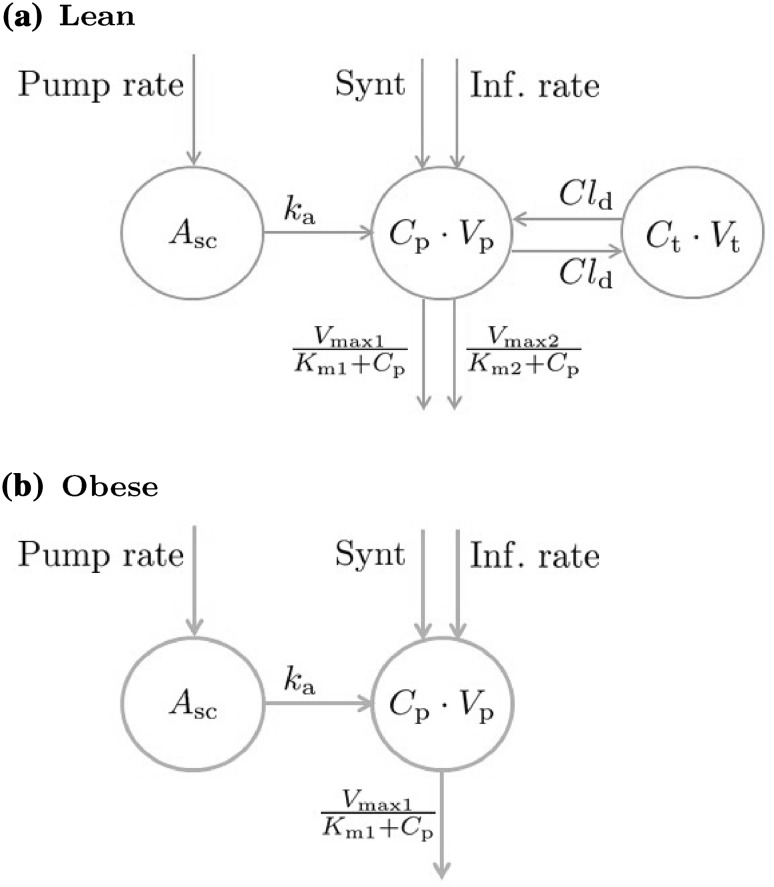
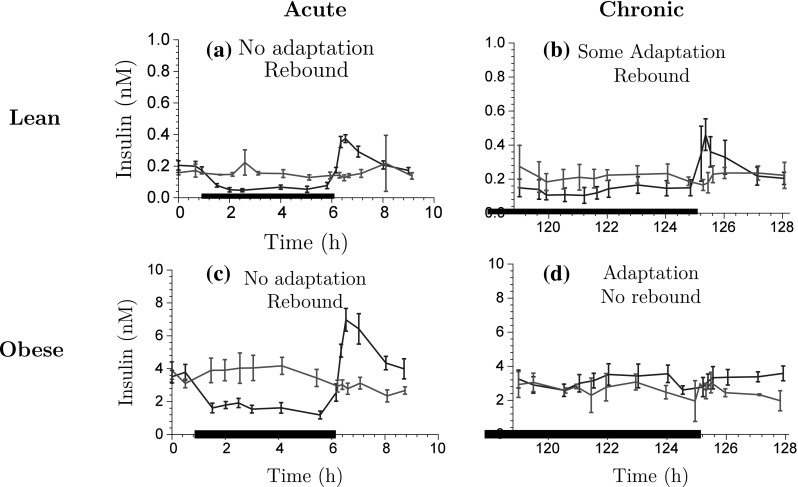
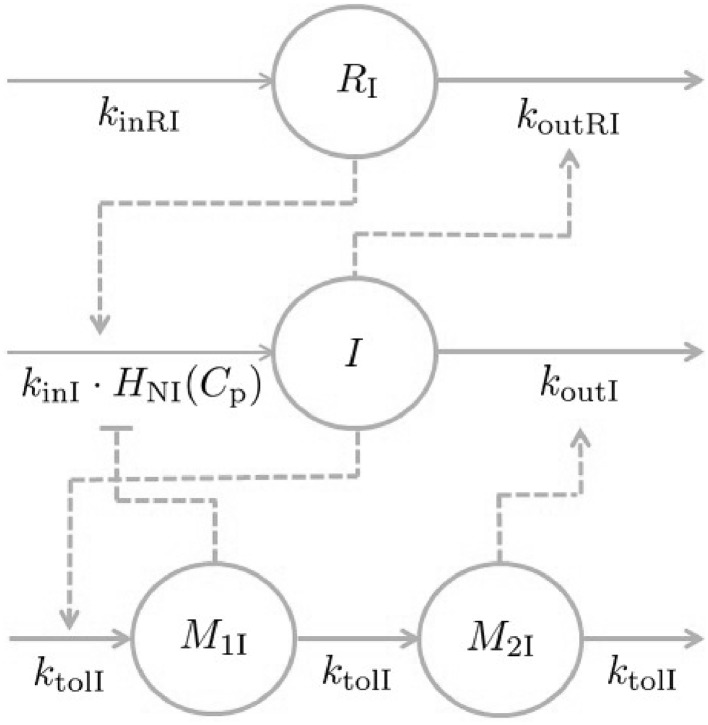
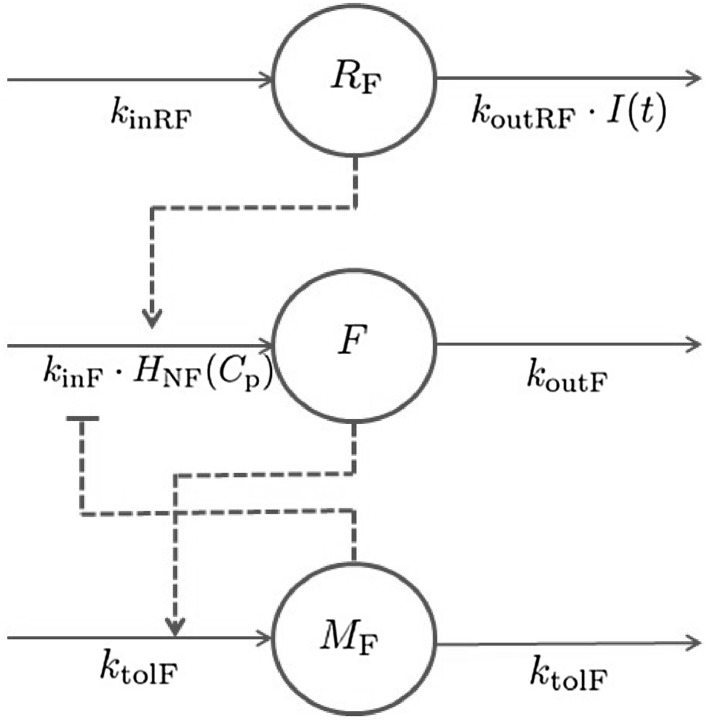
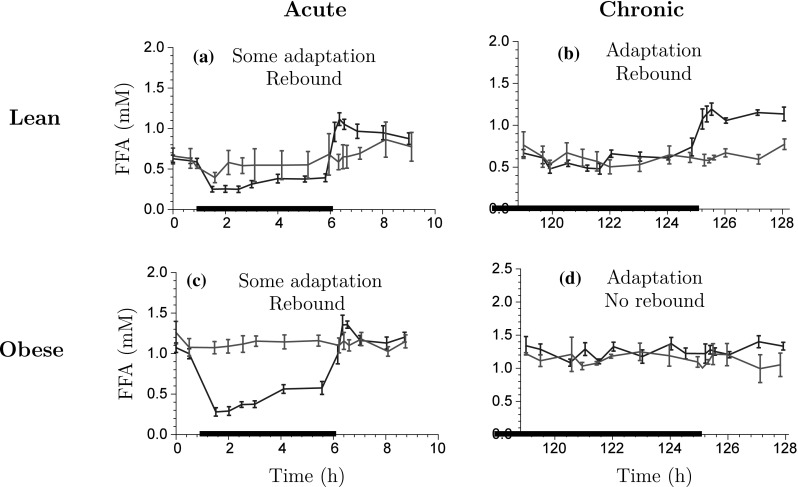
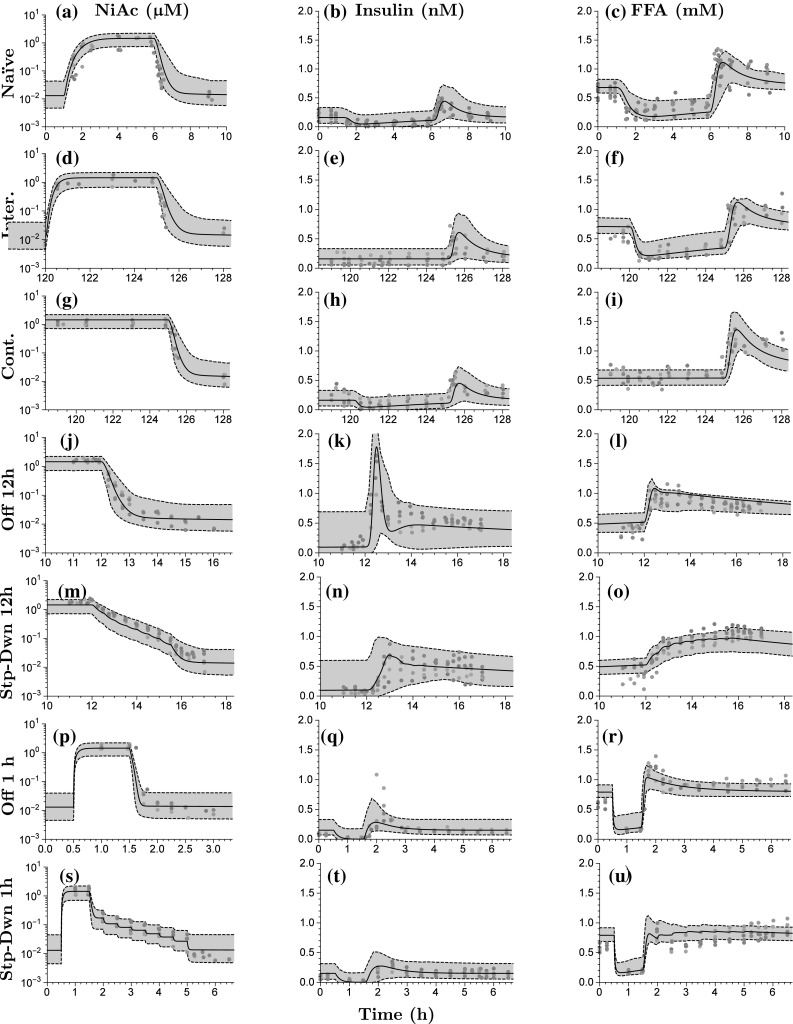
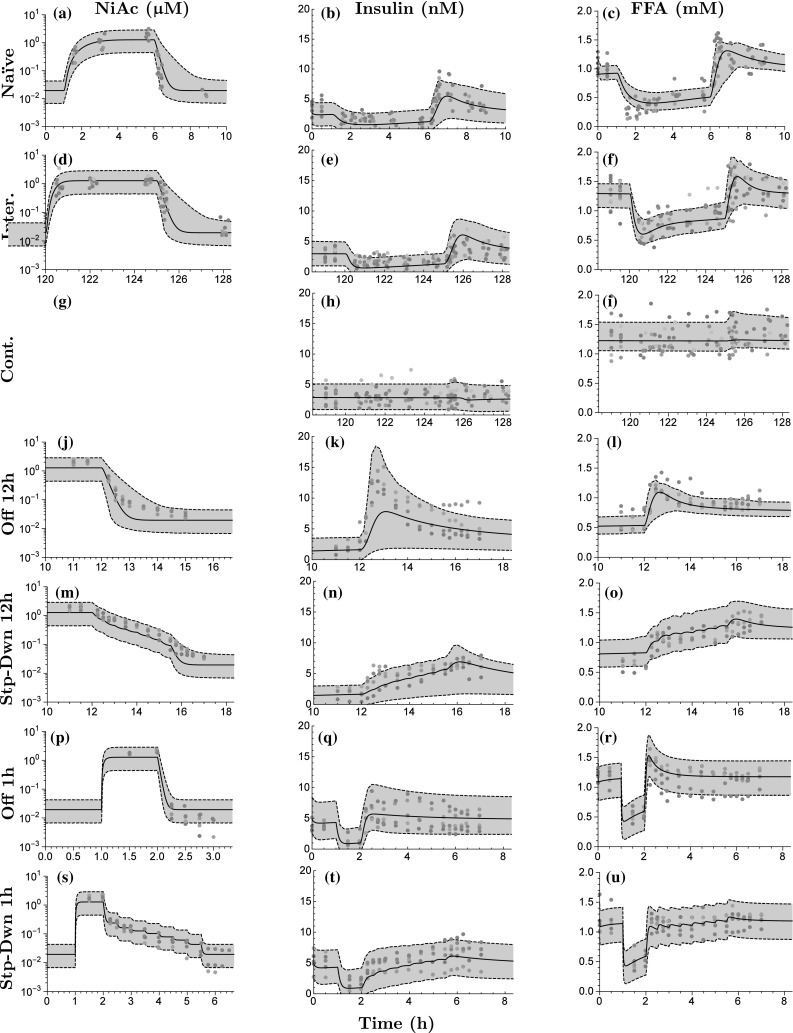
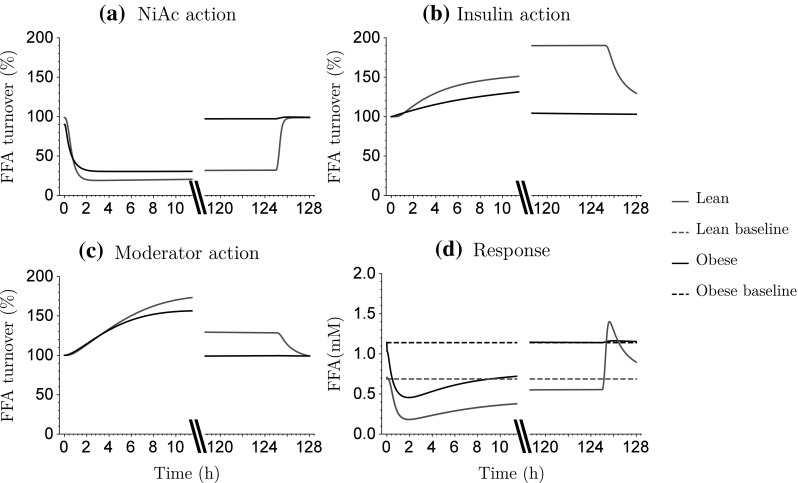
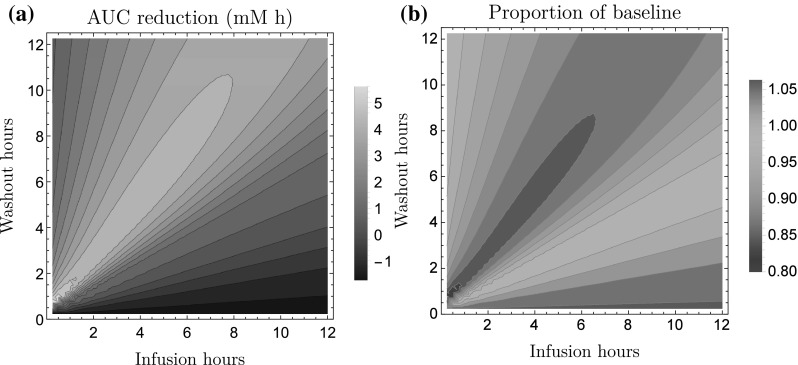
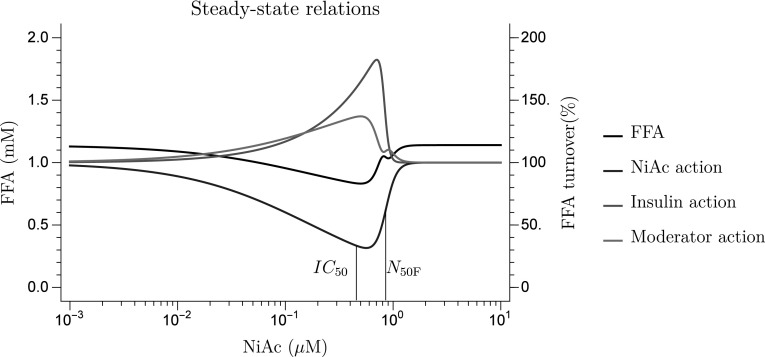
Nicotinic acid (NiAc) is a potent inhibitor of adipose tissue lipolysis. Acute administration results in a rapid reduction of plasma free fatty acid (FFA) concentrations. Sustained NiAc exposure is associated with tolerance development (drug resistance) and complete adaptation (FFA returning to pretreatment levels). We conducted a meta-analysis on a rich pre-clinical data set of the NiAc-FFA interaction to establish the acute and chronic exposure-response relations from a macro perspective. The data were analyzed using a nonlinear mixed-effects framework. We also developed a new turnover model that describes the adaptation seen in plasma FFA concentrations in lean Sprague-Dawley and obese Zucker rats following acute and chronic NiAc exposure. The adaptive mechanisms within the system were described using integral control systems and dynamic efficacies in the traditional [Formula: see text] model. Insulin was incorporated in parallel with NiAc as the main endogenous co-variate of FFA dynamics. The model captured profound insulin resistance and complete drug resistance in obese rats. The efficacy of NiAc as an inhibitor of FFA release went from 1 to approximately 0 during sustained exposure in obese rats. The potency of NiAc as an inhibitor of insulin and of FFA release was estimated to be 0.338 and 0.436 [Formula: see text], respectively, in obese rats. A range of dosing regimens was analyzed and predictions made for optimizing NiAc delivery to minimize FFA exposure. Given the exposure levels of the experiments, the importance of washout periods in-between NiAc infusions was illustrated. The washout periods should be [Formula: see text]2 h longer than the infusions in order to optimize 24 h lowering of FFA in rats. However, the predicted concentration-response relationships suggests that higher AUC reductions might be attained at lower NiAc exposures.
Keywords: Disease modeling; Dosing regimen; Meta-analysis; Nonlinear mixed-effects (NLME); Tolerance; Turnover models.
Figures
Similar articles
-
Dosing profile profoundly influences nicotinic acid's ability to improve metabolic control in rats.J Lipid Res. 2015 Sep;56(9):1679-90. doi: 10.1194/jlr.M058149. Epub 2015 Jul 13. J Lipid Res. 2015. PMID: 26168997 Free PMC article.
-
Nicotinic acid timed to feeding reverses tissue lipid accumulation and improves glucose control in obese Zucker rats[S].J Lipid Res. 2017 Jan;58(1):31-41. doi: 10.1194/jlr.M068395. Epub 2016 Nov 15. J Lipid Res. 2017. PMID: 27875257 Free PMC article.
-
Feedback modeling of non-esterified fatty acids in obese Zucker rats after nicotinic acid infusions.J Pharmacokinet Pharmacodyn. 2013 Dec;40(6):623-38. doi: 10.1007/s10928-013-9335-z. Epub 2013 Oct 10. J Pharmacokinet Pharmacodyn. 2013. PMID: 24114415
-
Influence of plasma free fatty acids on lipoprotein synthesis and diabetic dyslipidemia.Exp Clin Endocrinol Diabetes. 2003 Aug;111(5):246-50. doi: 10.1055/s-2003-41284. Exp Clin Endocrinol Diabetes. 2003. PMID: 12951628 Review.
-
Plasma Free Fatty Acid Concentration as a Modifiable Risk Factor for Metabolic Disease.Nutrients. 2021 Jul 28;13(8):2590. doi: 10.3390/nu13082590. Nutrients. 2021. PMID: 34444750 Free PMC article. Review.
Cited by
-
Challenge model of TNFα turnover at varying LPS and drug provocations.J Pharmacokinet Pharmacodyn. 2019 Jun;46(3):223-240. doi: 10.1007/s10928-019-09622-x. Epub 2019 Feb 18. J Pharmacokinet Pharmacodyn. 2019. PMID: 30778719 Free PMC article.
-
Exact Gradients Improve Parameter Estimation in Nonlinear Mixed Effects Models with Stochastic Dynamics.AAPS J. 2018 Aug 1;20(5):88. doi: 10.1208/s12248-018-0232-7. AAPS J. 2018. PMID: 30069613
-
Assessment of gut microbiota populations in lean and obese Zucker rats.PLoS One. 2017 Jul 13;12(7):e0181451. doi: 10.1371/journal.pone.0181451. eCollection 2017. PLoS One. 2017. PMID: 28704522 Free PMC article.
-
Model-based assessment of combination therapies - ranking of radiosensitizing agents in oncology.BMC Cancer. 2023 May 6;23(1):409. doi: 10.1186/s12885-023-10899-y. BMC Cancer. 2023. PMID: 37149596 Free PMC article.
References
Publication types
MeSH terms
Substances
LinkOut - more resources
Full Text Sources
Other Literature Sources
Medical
