. 2017 Feb 22:8:14508.
doi: 10.1038/ncomms14508.

Post-endocytic sorting of Plexin-D1 controls signal transduction and development of axonal and vascular circuits

Affiliations

Post-endocytic sorting of Plexin-D1 controls signal transduction and development of axonal and vascular circuits

Katja Burk et al. Nat Commun. .

Abstract

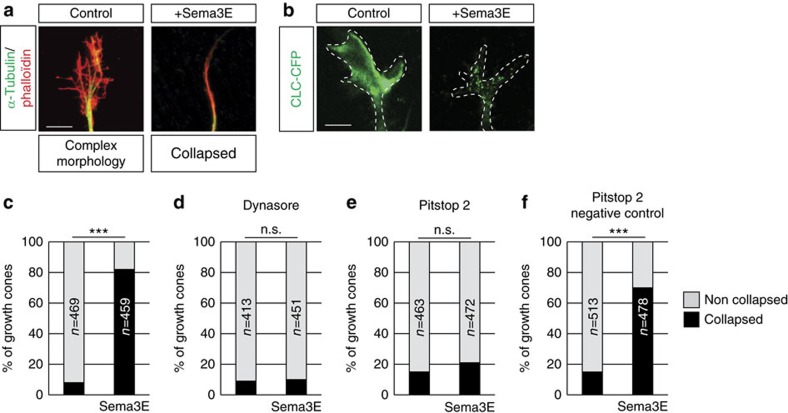
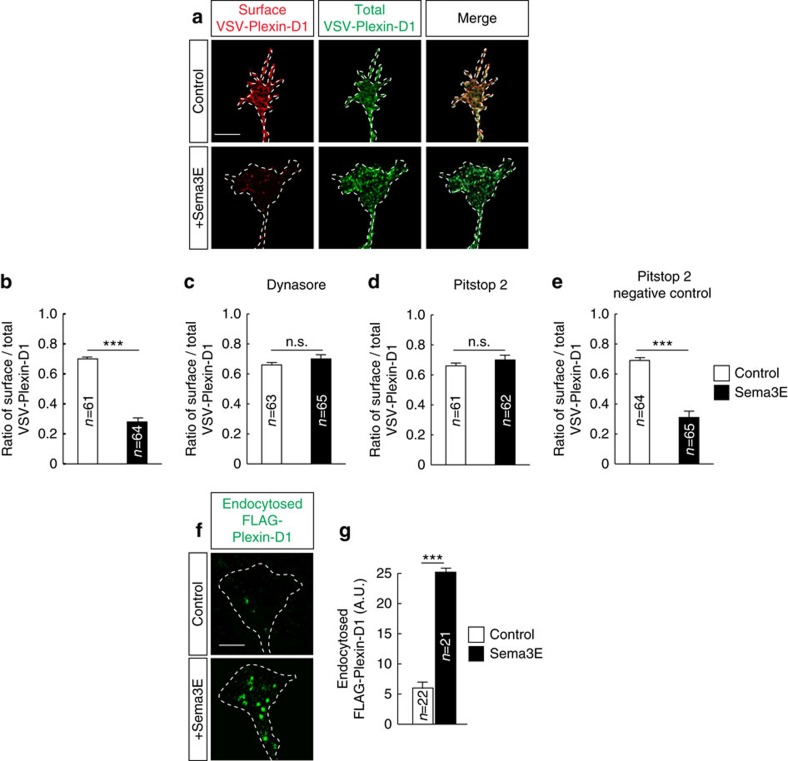
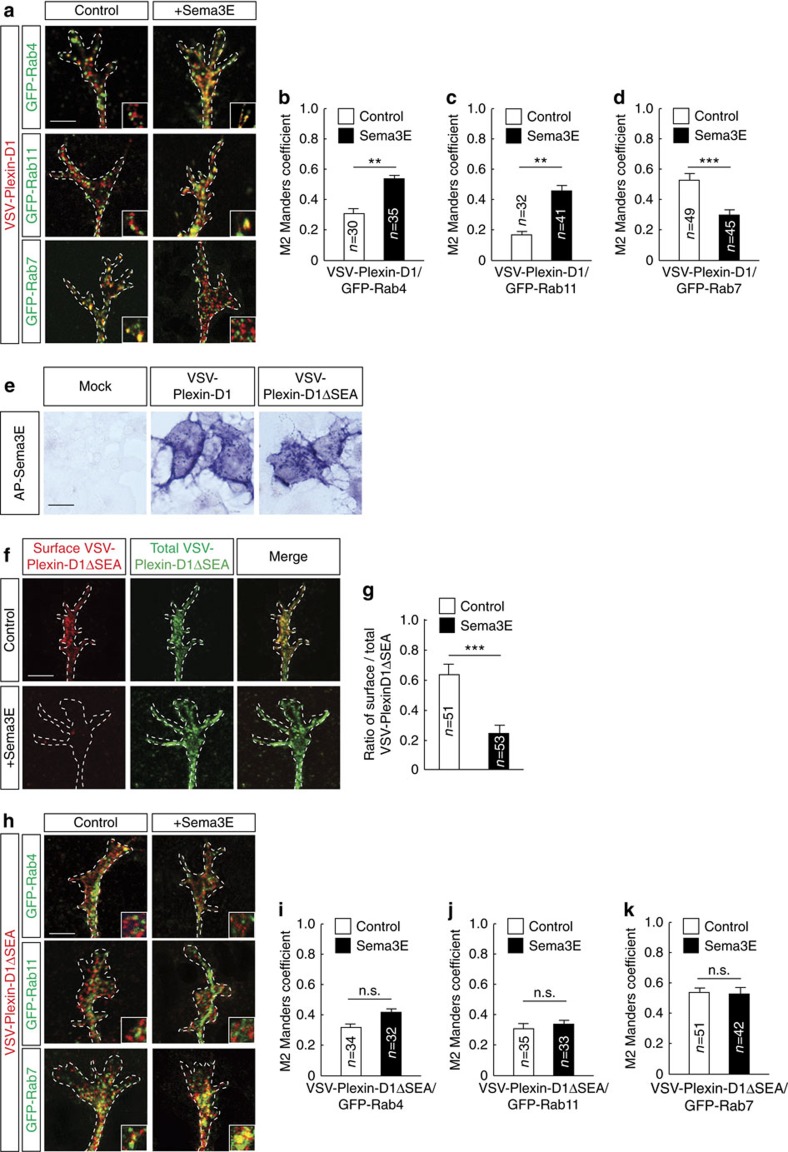
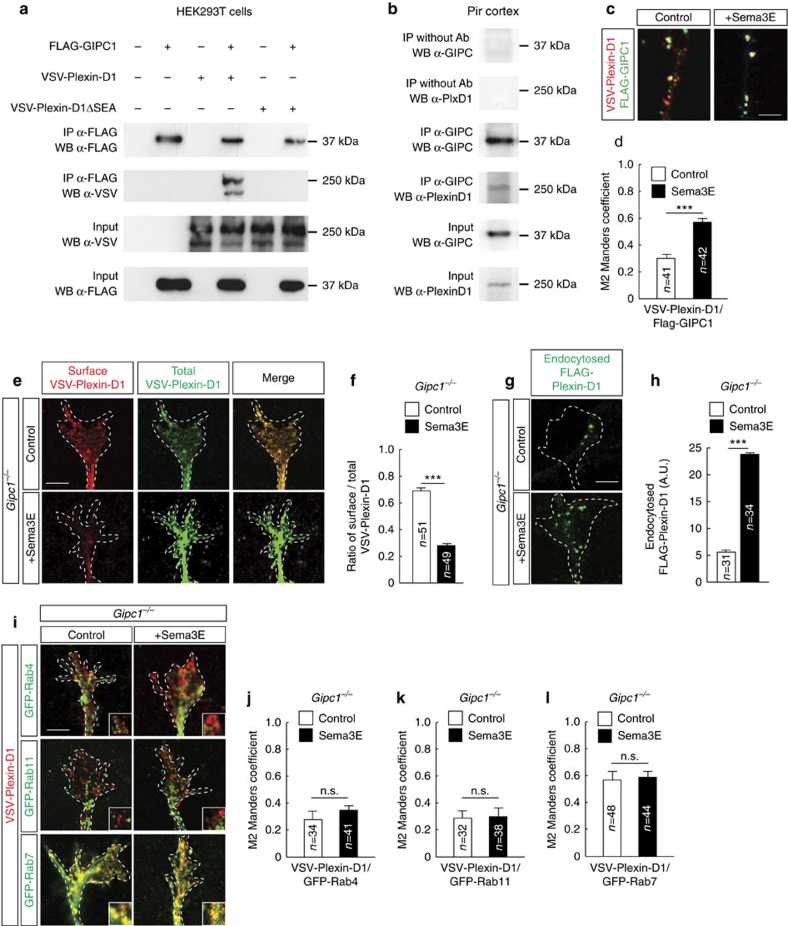
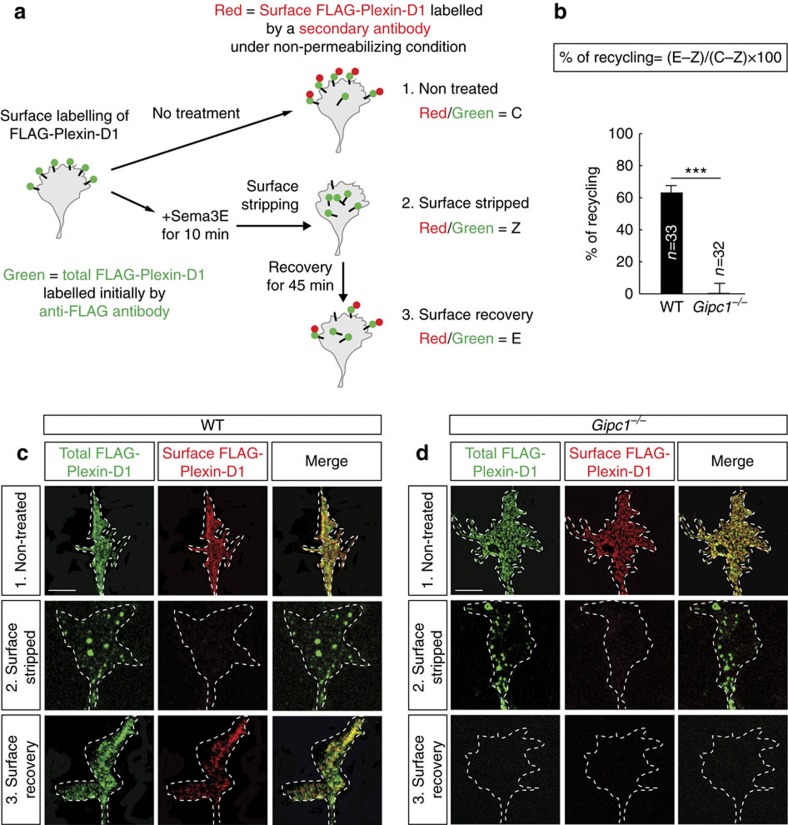
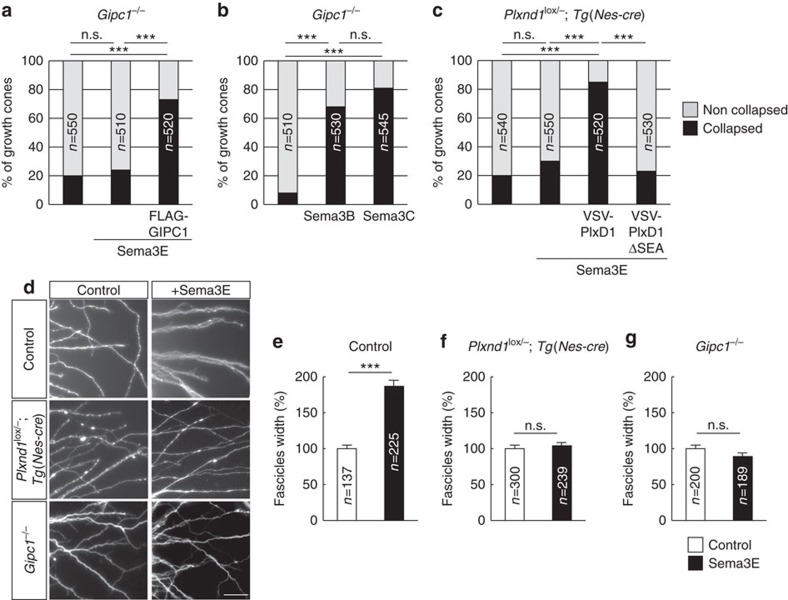
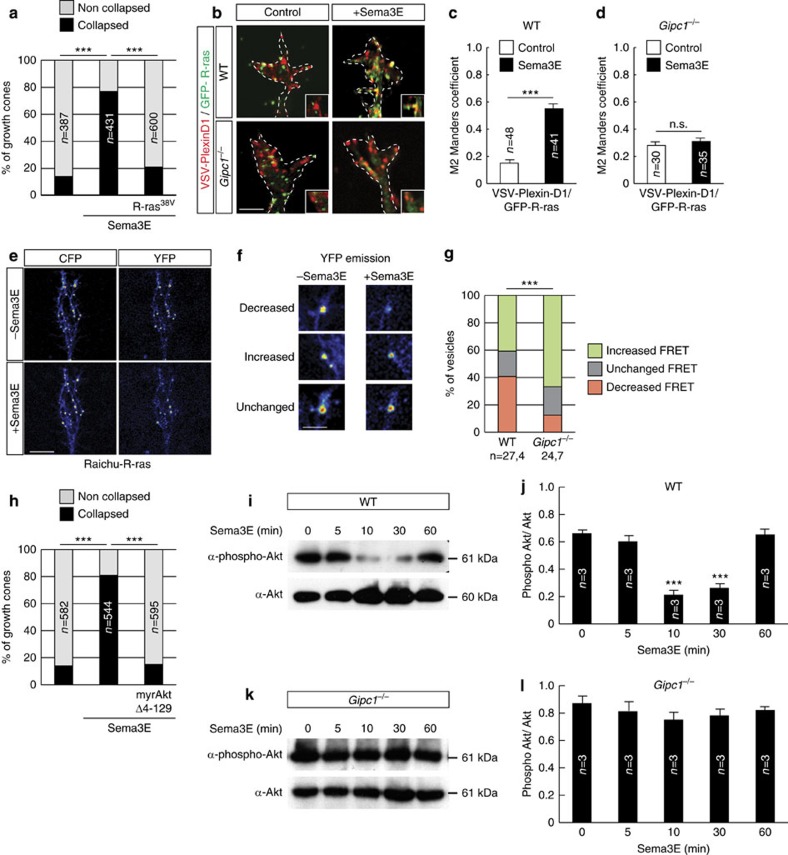
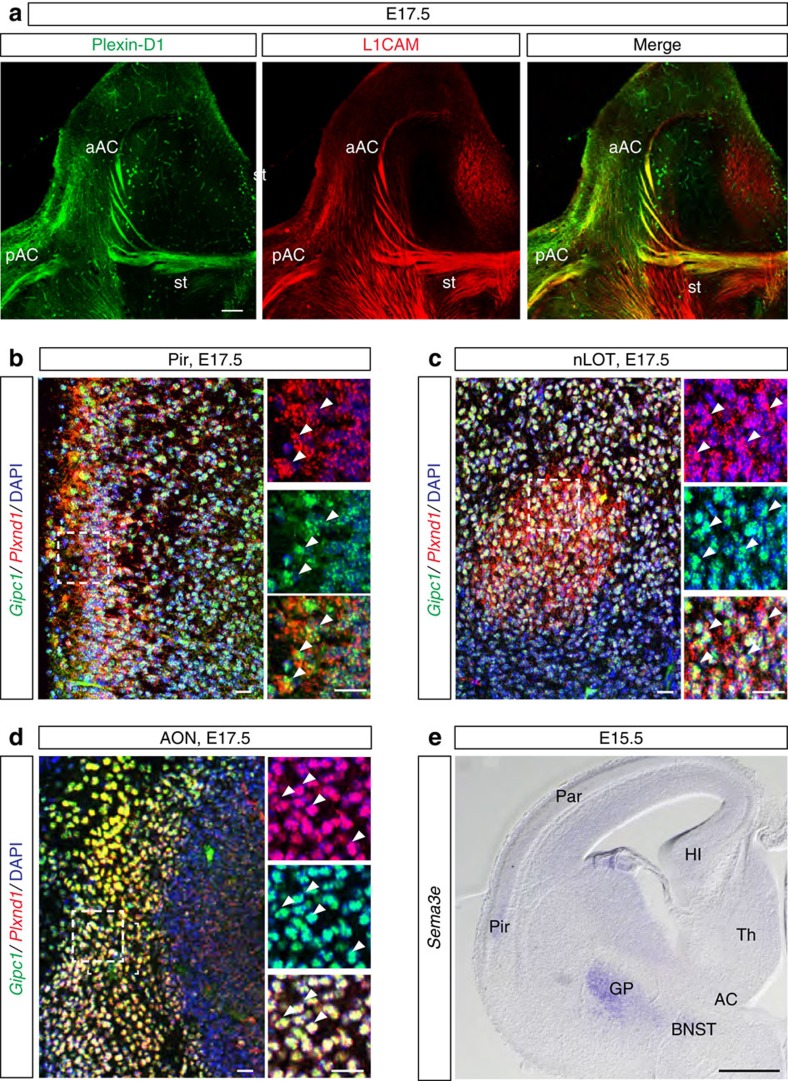
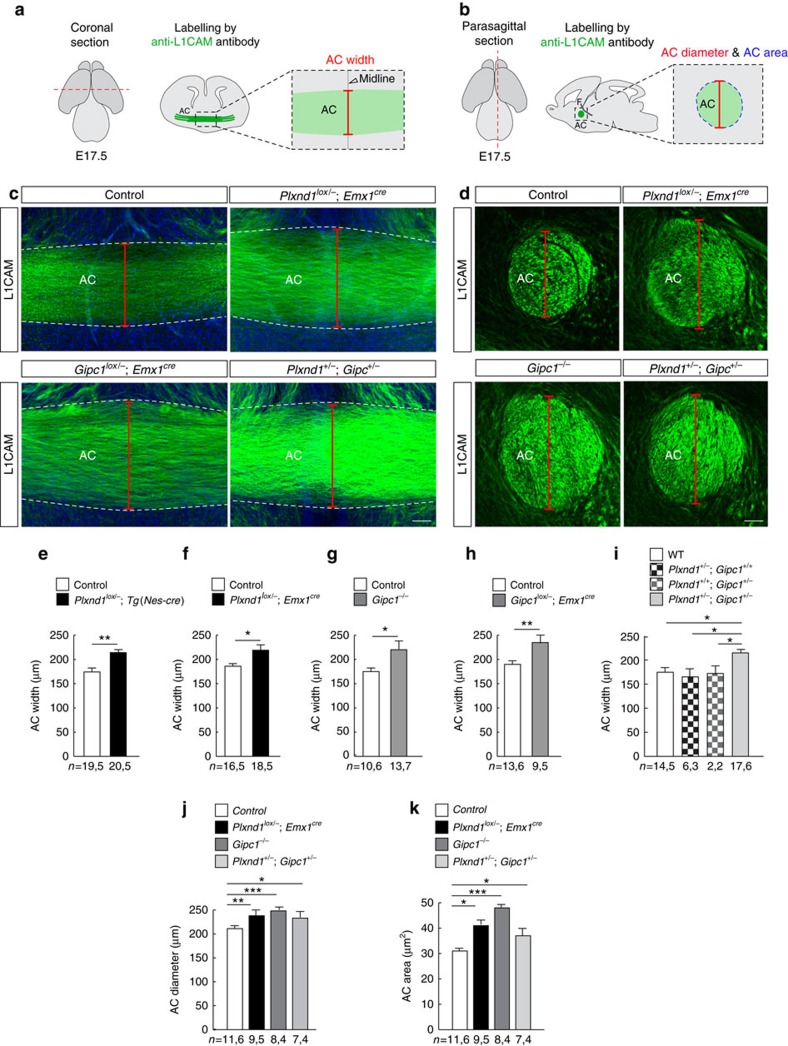
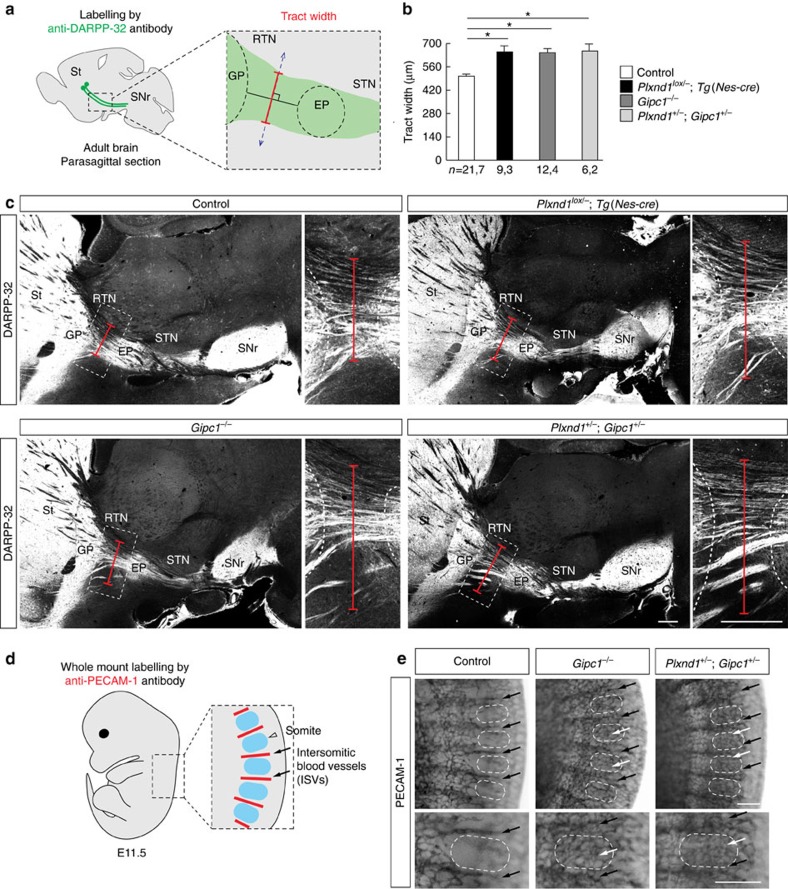
Local endocytic events involving receptors for axon guidance cues play a central role in controlling growth cone behaviour. Yet, little is known about the fate of internalized receptors, and whether the sorting events directing them to distinct endosomal pathways control guidance decisions. Here, we show that the receptor Plexin-D1 contains a sorting motif that interacts with the adaptor protein GIPC1 to facilitate transport to recycling endosomes. This sorting process promotes colocalization of Plexin-D1 with vesicular pools of active R-ras, leading to its inactivation. In the absence of interaction with GIPC1, missorting of Plexin-D1 results in loss of signalling activity. Consequently, Gipc1 mutant mice show specific defects in axonal projections, as well as vascular structures, that rely on Plexin-D1 signalling for their development. Thus, intracellular sorting steps that occur after receptor internalization by endocytosis provide a critical level of control of cellular responses to guidance signals.


Conflict of interest statement

The authors declare no competing financial interests.

Figures

Figure 1
Figure 1. Endocytosis is required for Sema3E-induced growth cone collapse.
(a) Collapse assay performed on E15.5 Pir neurons identified by tubulin in the presence or absence of Sema3E (20 min of treatment). Phalloidin staining shows the complex morphology of growth cones in the control condition and the collapsed morphology in the presence of Sema3E. (b) Image of growth cones of cultured E15.5 Pir neurons expressing clathrin light chain-CFP (CLC-CFP), with or without Sema3E (10 min of treatment). (cf) Quantification of the percentage of collapsed growth cones in control cultures and in response to Sema3E (20 min of treatment). Sema3E-induced collapse was blocked by the endocytosis inhibitors dynasore and Pitstop 2; n=number of growth cones analysed per condition in three independent experiments. The χ2 test, ***P<0.0001. Scale bars, 10 μm. See also Supplementary Fig. 1.
Figure 2
Figure 2. Sema3E induces Plexin-D1 endocytosis.
(a) Examples of growth cones from E15.5 Pir neurons showing cell surface localization (Control) and internalization (+Sema3E) of VSV-Plexin-D1. (be) Quantification of the cell surface/total VSV-Plexin-D1 ratio in control growth cones and growth cones exposed to Sema3E (10 min of treatment) in the presence or absence of dynasore, Pitstop 2 or Pitstop 2-negative control. Sema3E induced clathrin- and dynamin-dependent internalization of Plexin-D1; n=number of growth cones analysed per condition in three independent experiments. Data are represented as mean±s.e.m., ***P<0.0001 by the Mann–Whitney test. (f) Examples of growth cones from E15.5 Pir neurons showing low (Control) and high (+Sema3E) endocytosis of FLAG-Plexin-D1. (g) Quantification of endocytosed FLAG-Plexin-D1 in growth cones illustrated in (f). Results indicate endocytosed of Plexin-D1 after Sema3E treatment; n=number of growth cones analysed per condition. Data are presented as mean±s.e.m. and values are indicated in arbitrary units (a.u.) of fluorescence. ***P<0.0001 by the Mann–Whitney test. Scale bars, 10 μm. See also Supplementary Fig. 2.
Figure 3
Figure 3. Sorting of Plexin-D1 into recycling pathways requires its SEA PDZ-domain-binding motif.
(a) Colocalization of VSV-Plexin-D1 (red) and different GFP-tagged Rab proteins (green) in cultured E15.5 Pir neurons treated or not treated with Sema3E (10 min). (bd) Graphs showing the Manders colocalization coefficients for the fraction of VSV-Plexin-D1 colocalized with GFP-Rab4, GFP-Rab11 or GFP-Rab7 in the presence or absence of Sema3E treatment (10 min). Ligand-activated Plexin-D1 receptors were directed to recycling endosomes; n=number of growth cones analysed per condition in three independent experiments. Data are represented as mean±s.e.m., **P<0.01, ***P<0.0001 by the Mann–Whitney test. (e) Alkaline phosphatase (AP)-tagged Sema3E binds equally well to COS7 cells expressing VSV-Plexin-D1 or VSV-Plexin-D1ΔSEA. No binding is observed on mock-transfected COS7 cells. (f) Examples of growth cones from E15.5 Pir neurons showing cell surface localization (Control) and internalization (+Sema3E) of VSV-Plexin-D1ΔSEA. (g) Quantification of the cell surface/total VSV-Plexin-D1ΔSEA ratio in control growth cones and growth cones exposed to Sema3E (10 min). Plexin-D1 lacking the SEA motif was internalized in growth cones in response to Sema3E ligand activation; n=number of growth cones analysed per condition in three independent experiments. Data are represented as mean±s.e.m., ***P<0.0001 by the Mann–Whitney test. (h) Colocalization of VSV-Plexin-D1ΔSEA (red) with different GFP-Rab proteins (green) in cultured E15.5 Pir neurons with or without Sema3E treatment (10 min). (ik) Graphs showing the Manders colocalization coefficient for the fraction of VSV-Plexin-D1ΔSEA colocalized with GFP-Rab4, GFP-Rab11 or GFP-Rab7 with or without Sema3E treatment (10 min). Ligand-activated Plexin-D1ΔSEA was missorted to late endosomes; n=number of growth cones analysed per condition in three independent experiments. Data are represented as mean±s.e.m. No statistical difference was found between conditions using the Mann–Whitney test. Scale bars, 10 μm. See also Supplementary Fig. 2.
Figure 4
Figure 4. GIPC1 controls post-endocytic sorting of Plexin-D1.
(a) HEK293T cells were transfected with FLAG-GIPC1, VSV-Plexin-D1 and VSV-Plexin-D1ΔSEA constructs. Proteins were immunoprecipitated (IP) from cell lysates and immunoblotted (WB) using the indicated antibodies. The C-terminal SEA motif of Plexin-D1 interacts with GIPC1. (b) Co-IP of endogenous GIPC1 and Plexin-D1 proteins from cell lysate of E15.5 Pir cortex. (c) Axons of E15.5 Pir neurons expressing FLAG-GIPC1 (green) and VSV-Plexin-D1 (red), with or without Sema3E treatment (10 min). (d) Graph showing the Manders colocalization coefficients for the fraction of VSV-Plexin-D1 colocalized with FLAG-GIPC1. Sema3E increased the colocalization of the two proteins; n=number of growth cones analysed per condition in three independent experiments. Data are represented as mean±s.e.m., ***P<0.001 by the Mann–Whitney test. (e) Growth cones of E15.5 Gipc1−/− Pir neurons showing cell surface localization (Control) and internalization (+Sema3E) of VSV-Plexin-D1. (f) Quantification of the cell surface/total VSV-Plexin-D1 ratio in Gipc1−/− growth cones. Sema3E induced internalization of Plexin-D1; n=number of growth cones analysed per condition in three independent experiments. Data are represented as mean±s.e.m., ***P<0.0001 by the Mann–Whitney test. (g) Examples of growth cones of E15.5 Gipc1−/− Pir neurons showing low (Control) and high (+Sema3E) endocytosis of FLAG-Plexin-D1. (h) Quantification of endocytosed FLAG-Plexin-D1 in Gipc1−/− growth cones. Sema3E induced internalization of Plexin-D1; n=number of growth cones analysed per condition. Data are presented as mean±s.e.m. and values are indicated in arbitrary units (A.U.) of fluorescence. ***P<0.0001 by the Mann–Whitney test. (i) Colocalization of VSV-Plexin-D1 (red) with different GFP-Rab proteins (green) in E15.5 Gipc1−/− Pir neurons with or without Sema3E treatment (10 min). (jl) Graphs show the Manders colocalization coefficients for the fraction of VSV-Plexin-D1 colocalized with GFP-Rab proteins in Gipc1−/− growth cones. Ligand-activated Plexin-D1 was missorted to late endosomes; n=number of growth cones analysed per condition in three independent experiments. Data are represented as mean±s.e.m. No statistical difference was found between conditions using the Mann–Whitney test. Scale bars, 10 μm. See also Supplementary Figs 3 and 4.
Figure 5
Figure 5. GIPC1 controls Plexin-D1 receptor recycling to the plasma membrane.
(a) Schematic of the quantitative receptor recycling assay. (b) Quantification of the percentage of FLAG-Plexin-D1 recycling to the growth cone surface of wild-type (WT) or Gipc1−/− E15.5 Pir neurons. GIPC1 is required for recycling of internalized Plexin-D1 to the plasma membrane; n=number of growth cones analysed per condition. Data are represented as mean±s.e.m., ***P<0.0001 by the Mann–Whitney test. (c,d) Representative confocal fluorescence images of FLAG-Plexin-D1 recycling assay in growth cones of WT (c) and Gipc−/− (d) E15.5 Pir neurons. Scale bars, 10 μm.
Figure 6
Figure 6. GIPC1 is required for axonal and growth cone response to Sema3E.
(ac) Quantification of the percentage of collapsed growth cones in response to 20 min of treatment with Sema3E, Sema3B or Sema3C in cultures of E15.5 Pir neurons of Gipc1−/− or Plxnd1lox/−;Tg(Nes-cre) mutants. Sema3E-induced collapse required functional GIPC1 and the C-terminal SEA motif of Plexin-D1; n=number of growth cones analysed per condition in three independent experiments. The χ2 test, ***P<0.001. (d) Photomicrographs showing axons stained with calcein-AM growing out from E15.5 Pir explants of control, Plxnd1lox/−;Tg(Nes-cre) or Gipc1−/− mutants, cultured for 2 days with or without Sema3E. (eg) Quantification of the average fascicle width in response to Sema3E in cultures of control, Plxnd1lox/−;Tg(Nes-cre) or Gipc1−/− mutant explants. Sema3E-induced fasciculation required expression of Plexin-D1 and GIPC1 in axons; n=number of fascicles measured per condition in three independent experiments. Data are shown as mean±s.e.m. and are normalized to the values obtained in unstimulated conditions. ***P<0.001, by the Mann–Whitney test. Scale bar, 50 μm.
Figure 7
Figure 7. Impaired signal transduction in neurons lacking GIPC1.
(a) Percentage of collapsed growth cones of E15.5 Pir neurons in response to Sema3E (20 min). The constitutively active form of R-ras (R-ras38V) abrogated the collapsing effect of Sema3E; n=number of growth cones per condition in three independent experiments. The χ2 test, ***P<0.0001. (b) Growth cones of E15.5 wild-type (WT) or Gipc1−/− Pir neurons expressing GFP-R-ras and VSV-Plexin-D1, treated with or without Sema3E (10 min). (c,d) Graphs show Manders colocalization coefficients for the fraction of VSV-Plexin-D1 colocalized with GFP-R-ras. GIPC1 increased colocalization of Plexin-D1 and R-ras; n=number of growth cones per condition in three independent experiments. Data are represented as mean±s.e.m., ***P<0.001 by the Mann–Whitney test. (e) Expression of the Raichu-R-ras reporter in a E15.5 Pir neuron before and after the addition of Sema3E. CFP and YFP images are presented as pseudocolour images (red: high signal, blue: low signal). The CFP image (left) shows the distribution of R-ras on vesicles. The YFP signal (right) is proportional to the amount of GTP bound to R-ras. (f) Examples of changes in the YFP signal induced by exposure to Sema3E. (g) Percentage of vesicles displaying increased, decreased or unchanged FRET level. Sema3E-driven R-ras inhibition was reduced in Gipc1−/− neurons; n=x,y where x indicates the number of vesicles and y the number of growth cones analysed. The χ2 test, ***P<0.0001. (h) Percentage of collapsed growth cones in response to Sema3E (20 min) in cultures of E15.5 Pir neurons. A constitutively active form of Akt (myrAkt Δ4–129) abrogated the collapsing effect of Sema3E; n=number of growth cones per condition in three independent experiments. The χ2 test, ***P<0.0001. (i,k) Phosphorylation of Akt in E15.5 WT or Gipc1−/− Pir neurons stimulated with Sema3E (0 to 60 min). (j,l) Quantification of phospho-Akt levels. Sema3E-induced inhibition of Akt required GIPC1 function; n=number of experiments, data are mean±s.e.m., ***P<0.001 by the Mann–Whitney test. Scale bars, 10 μm (b,e), 2 μm (f). See also Supplementary Figs 5 and 6.
Figure 8
Figure 8. Plexin-D1 and GIPC1 are coexpressed in neurons of the AC.
(a) Immunolabelling of Plexin-D1 (green) and L1CAM (red) in horizontal sections of E17.5 brain. Plexin-D1 is expressed on the three branches of the AC. (bd) Fluorescent RNA in situ hybridization for Gipc1 (green) and Plxnd1 (red) on coronal sections of E17.5 wild-type mouse brain. Gipc1 and Plxnd1 mRNA are coexpressed in the Pir cortex (b), nLOT (c) and AON (d). (e) Coronal sections of E15.5 wild-type mouse brains were hybridized with an RNA probe for Sema3e. Strong signal was seen in the GP and BNST. aAC, anterior limb of the AC; AON, anterior olfactory nucleus; BNST, bed nucleus of the stria terminalis; GP, globus pallidus; HI, hippocampus; nLOT, nucleus of the lateral olfactory tract; pAC, posterior limb of the AC; Par, parietal cortex; Pir, piriform cortex; st, stria terminalis; Th, thalamus. Scale bars, 300 μm (a), 50 μm (e) and 20 μm (bd).
Figure 9
Figure 9. Plxnd1 and Gipc1 genetically interact to regulate the development of the AC.
(a,b) Schematic illustrating the section planes and measurement methods for analysis of the AC. (c,d) Representative L1CAM-stained AC in coronal sections (c) and parasagittal sections at the level of the fornix (F) (d) of E17.5 brains from control, Plxnd1lox/−;Emx1cre mutants, Gipc1lox/−;Emx1cre mutants and Plxnd1+/, Gipc1+/− double-heterozygous embryos. (ek) Quantification of AC width (ei), diameter (j) and cross-sectional area (k) in E17.5 brains from control mice, conditional Plxnd1lox/−;Tg(Nes-cre) and Plxnd1lox/−;Emx1cre mutants, null Gipc1−/− and conditional Gipc1lox/−;Emx1cre mutants, Plxnd1 and Gipc1 single- (Plxnd1+/−, Gipc1+/+ and Plxnd1+/+, Gipc1+/−) and double-heterozygous (Plxnd1+/−, Gipc1+/−) mutants. Mice lacking Plexin-D1 and/or GIPC1 developed an enlarged AC. Data are shown as mean±s.e.m., n=x,y where x indicates the number of slices and y the number of mice analysed for each genotype. *P<0.05, **P<0.01, by the Mann–Whitney test (eh), Kruskal–Wallis test (ik). Scale bars, 50 μm (c), 40 μm (d). See also Supplementary Fig. 7. AC, anterior commissure. F, fornix.
Figure 10
Figure 10. Plxnd1 and Gipc1 genetically interact to regulate the development of the striatonigral pathway and intersomitic blood vessels.
(a) Schematic representing the region of interest in parasagittal sections of adult mouse brains and the quantification method for analysis of the striatonigral tract. The width (red segment) of the striatonigral tract (green) was measured at equal distance between the border of the globus pallidus (GP) and the entopeduncular nucleus (EP) on parasagittal sections, along a line perpendicular (dashed blue line) to the main orientation of the tract. (b) Quantification of the width of the striatonigral tract in control, Plxnd1lox/−;Tg(Nes-cre), Gipc1−/− or double-heterozygous Plxnd1+/−, Gipc1+/− mutant brains. Mice lacking Plexin-D1 or GIPC1 and double heterozygous mice displayed an enlargement of the striatonigral axon tract. Data are shown as mean±s.e.m., n=x,y where x indicates the number of slices and y the number of mice analysed for each genotype. *P<0.05, by the Kruskal–Wallis test. (c) Representative DARPP-32-stained striatonigral projections in parasagittal sections of adult brains from control, Plxnd1lox/−;Tg(Nes-cre), Gipc1−/− or double-heterozygous Plxnd1+/−, Gipc1+/− mutant mice. Red segments delineate the tract width. Onsets show high magnifications views of the tract (dashed boxes in main pictures). (d) Schematic drawing showing the region of interest for analysis of intersomitic blood vessels (ISVs). (e) Whole-mount PECAM-1 staining of E11.5 embryos from control (n=15 mice), Gipc1−/− (n=6 mice) and double-heterozygous Plxnd1+/−, Gipc1+/− mutants (n=5 mice). Dashed oval, somite; black arrow, ISV; white arrows, misguided ISV. Mice lacking GIPC1 and double heterozygous mice show disruption of the ISV vascular pattern. EP, entopeduncular nucleus; GP, globus pallidus; ISVs, intersomitic blood vessels; RTN, reticular thalamic nucleus; SNr, substantia nigra; St: striatum; STN, subthalamic nucleus. Scale bars, 500 μm. See also Supplementary Fig. 8.

Similar articles

Cited by

References

    1. Itofusa R. & Kamiguchi H. Polarizing membrane dynamics and adhesion for growth cone navigation. Mol. Cell. Neurosci. 48, 332–338 (2011). - PubMed
    1. Pfenninger K. H. Plasma membrane expansion: a neuron's Herculean task. Nat. Rev. Neurosci. 10, 251–261 (2009). - PubMed
    1. Zylbersztejn K. & Galli T. [Membrane traffic, a new actor in axon guidance]. Med. Sci. 28, 267–269 (2012). - PubMed
    1. Tojima T., Hines J. H., Henley J. R. & Kamiguchi H. Second messengers and membrane trafficking direct and organize growth cone steering. Nat. Rev. Neurosci. 12, 191–203 (2011). - PMC - PubMed
    1. Tojima T. & Kamiguchi H. Exocytic and endocytic membrane trafficking in axon development. Dev. Growth Differ. 57, 291–304 (2015). - PubMed

Publication types

MeSH terms