

Liver histology and diffusion-weighted MRI in children with nonalcoholic fatty liver disease: A MAGNET study
- PMID: 28225568
- PMCID: PMC5568908
- DOI: 10.1002/jmri.25663
Liver histology and diffusion-weighted MRI in children with nonalcoholic fatty liver disease: A MAGNET study
Abstract
Purpose: To determine potential associations between histologic features of pediatric nonalcoholic fatty liver disease (NAFLD) and estimated quantitative magnetic resonance diffusion-weighted imaging (DWI) parameters.
Materials and methods: This prospective, cross-sectional study was performed as part of the Magnetic Resonance Assessment Guiding NAFLD Evaluation and Treatment (MAGNET) ancillary study to the Nonalcoholic Steatohepatitis Clinical Research Network (NASH CRN). Sixty-four children underwent a 3T DWI scan (b-values: 0, 100, and 500 s/mm2 ) within 180 days of a clinical liver biopsy of the right hepatic lobe. Three parameters were estimated in the right hepatic lobe: apparent diffusion coefficient (ADC), diffusivity (D), and perfusion fraction (F); the first assuming exponential decay and the latter two assuming biexponential intravoxel incoherent motion. Grading and staging of liver histology were done using the NASH CRN scoring system. Associations between histologic scores and DWI-estimated parameters were tested using multivariate linear regression.
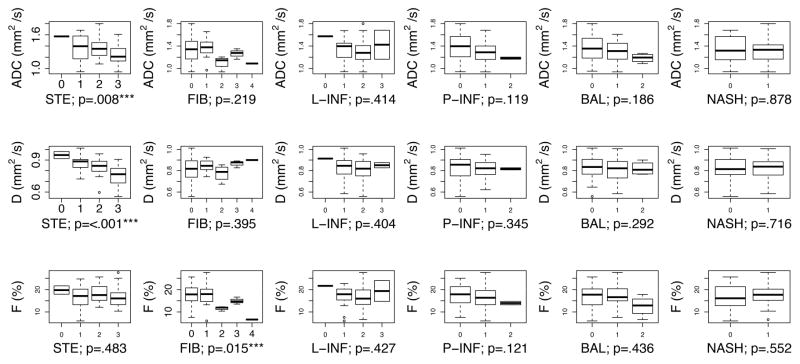
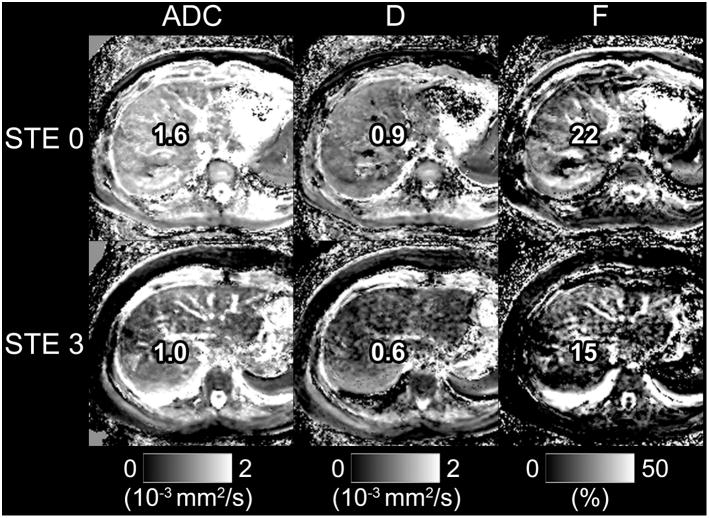
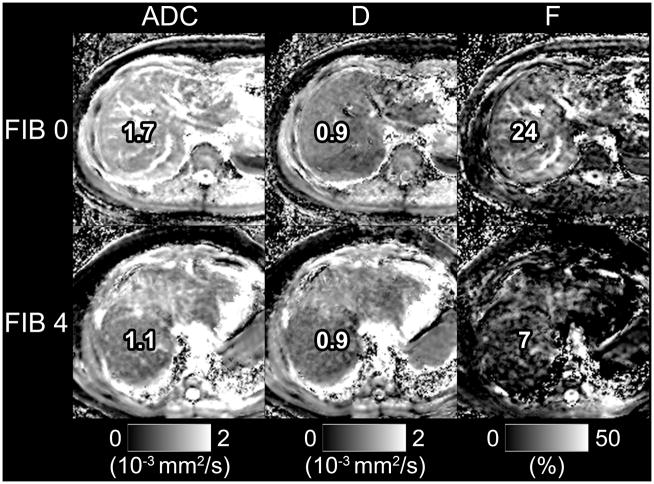
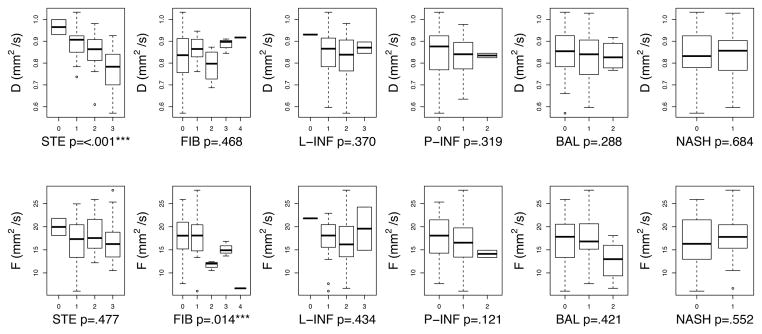
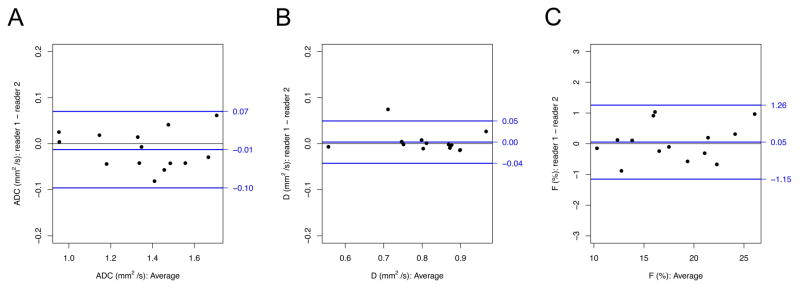
Results: Estimated means ± standard deviations were: ADC: 1.3 (0.94-1.8) × 10-3 mm2 /s; D: 0.82 (0.56-1.0) × 10-3 mm2 /s; and F: 17 (6.0-28)%. Multivariate analyses showed ADC and D decreased with steatosis and F decreased with fibrosis (P < 0.05). Associations between DWI-estimated parameters and other histologic features were not significant: ADC: fibrosis (P = 0.12), lobular inflammation (P = 0.20), portal inflammation (P = 0.27), hepatocellular inflammation (P = 0.29), NASH (P = 0.30); D: fibrosis (P = 0.34), lobular inflammation (P = 0.84), portal inflammation (P = 0.76), hepatocellular inflammation (P = 0.38), NASH (P = 0.81); F: steatosis (P = 0.57), lobular inflammation (P = 0.22), portal inflammation (P = 0.42), hepatocellular inflammation (P = 0.59), NASH (P = 0.07).
Conclusion: In children with NAFLD, steatosis and fibrosis have independent effects on DWI-estimated parameters ADC, D, and F. Further research is needed to determine the underlying mechanisms and clinical implications of these effects.
Level of evidence: 1 Technical Efficacy: Stage 2 J. Magn. Reson. Imaging 2017;46:1149-1158.
Keywords: ADC; DWI; NAFLD; QIBs; children; intravoxel incoherent motion; nonalcoholic fatty liver disease; pediatric; quantitative imaging biomarkers.
© 2017 International Society for Magnetic Resonance in Medicine.
Figures
References
-
- Schwimmer JB, Deutsch R, Kahen T, Lavine JE, Stanley C, Behling C. Prevalence of fatty liver in children and adolescents. Pediatrics. 2006;118(4):1388–1393. - PubMed
-
- Brunt EM. Pathology of nonalcoholic steatohepatitis. Hepatol Res. 2005;33(2):68–71. - PubMed
-
- Dezsőfi A, Knisely AS. Liver biopsy in children 2014: Who, whom, what, when, where, why? Clinics and Research in Hepatology and Gastroenterology. 2014;38(4):395–398. - PubMed
-
- Taouli B, Koh DM. Diffusion-weighted MR imaging of the liver. Radiology. 2010;254(1):47–66. - PubMed
Publication types
MeSH terms
Grants and funding
LinkOut - more resources
Full Text Sources
Other Literature Sources
Medical
Research Materials
Miscellaneous
