. 2017 Mar 2;543(7643):103-107.
doi: 10.1038/nature21376. Epub 2017 Feb 22.

Prefrontal cortex output circuits guide reward seeking through divergent cue encoding

Affiliations

Prefrontal cortex output circuits guide reward seeking through divergent cue encoding

James M Otis et al. Nature. .

Abstract

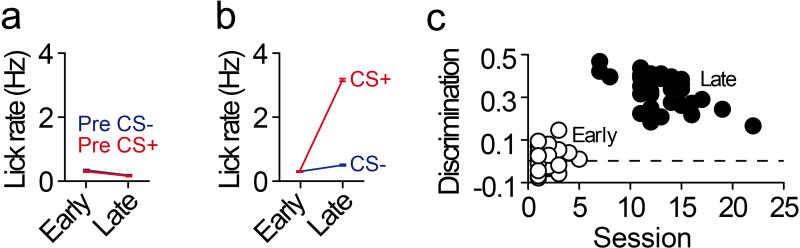
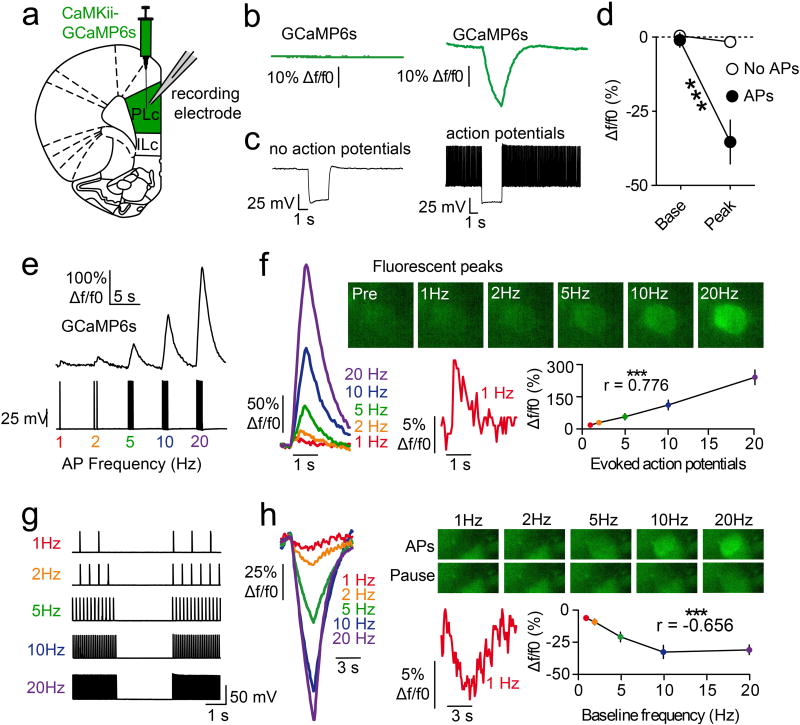
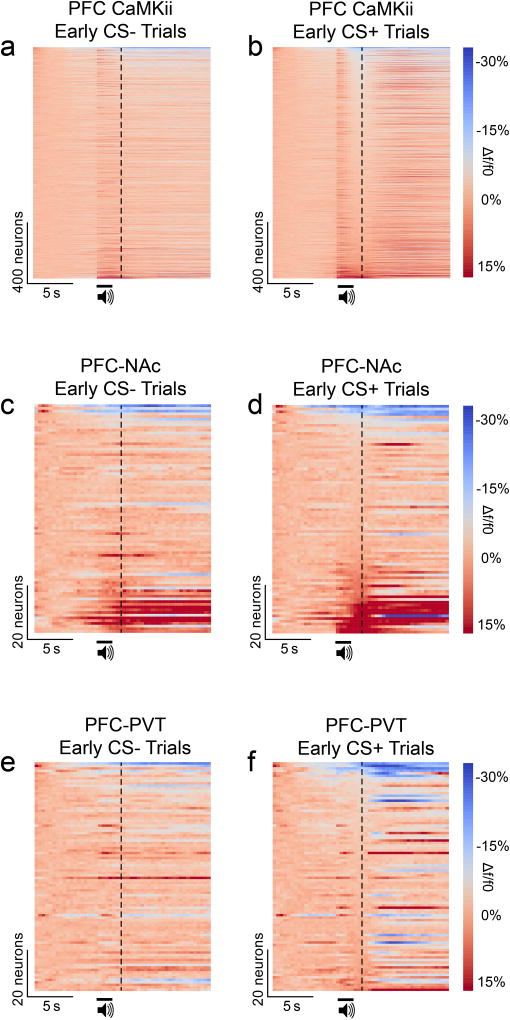
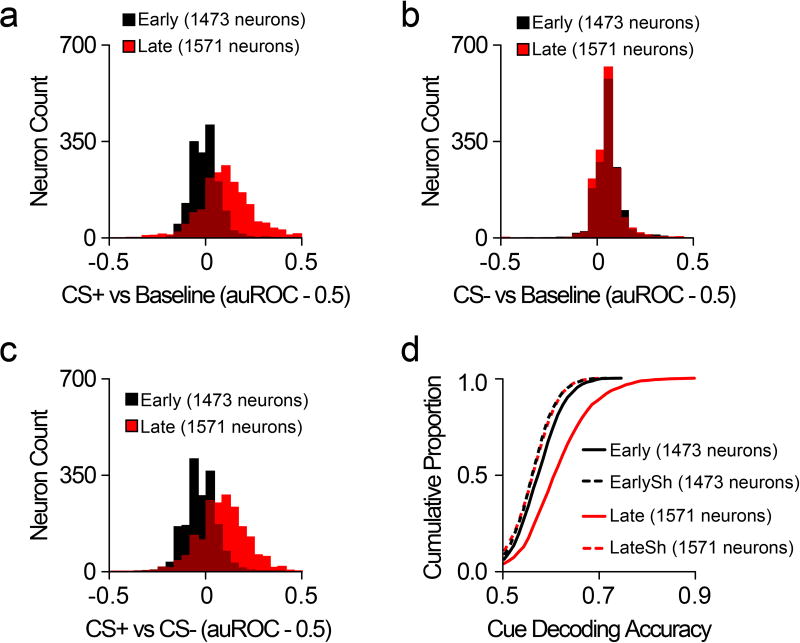
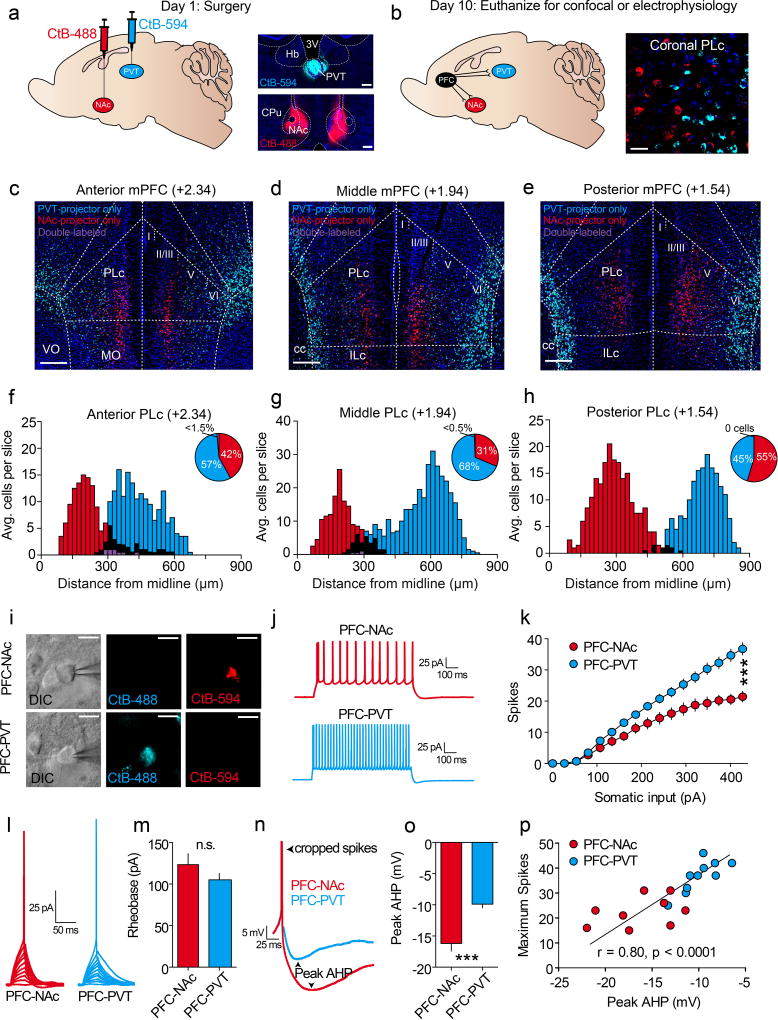
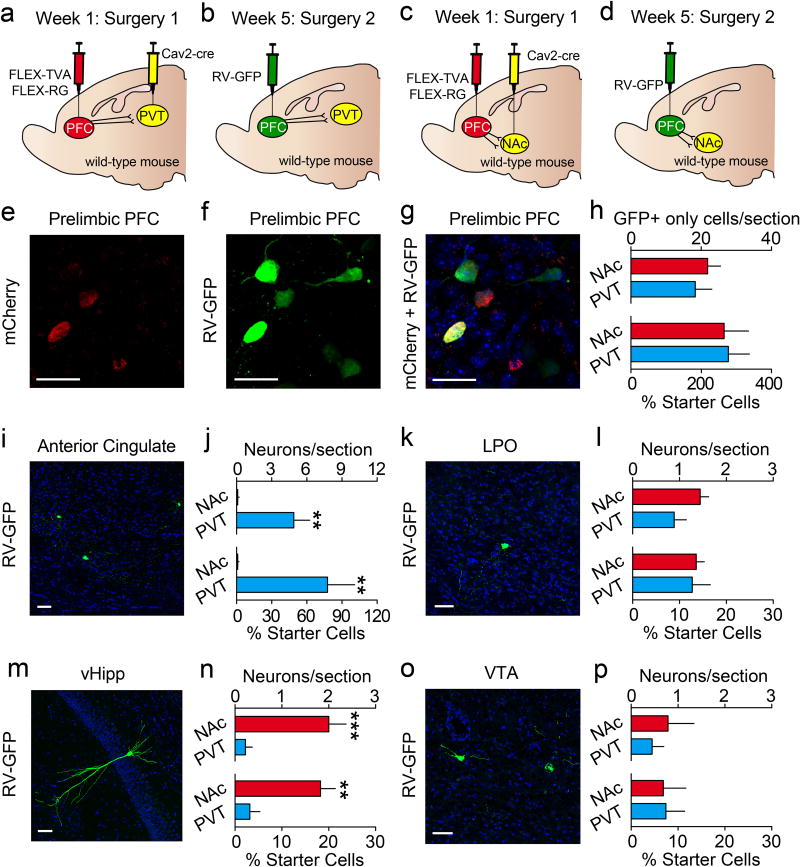
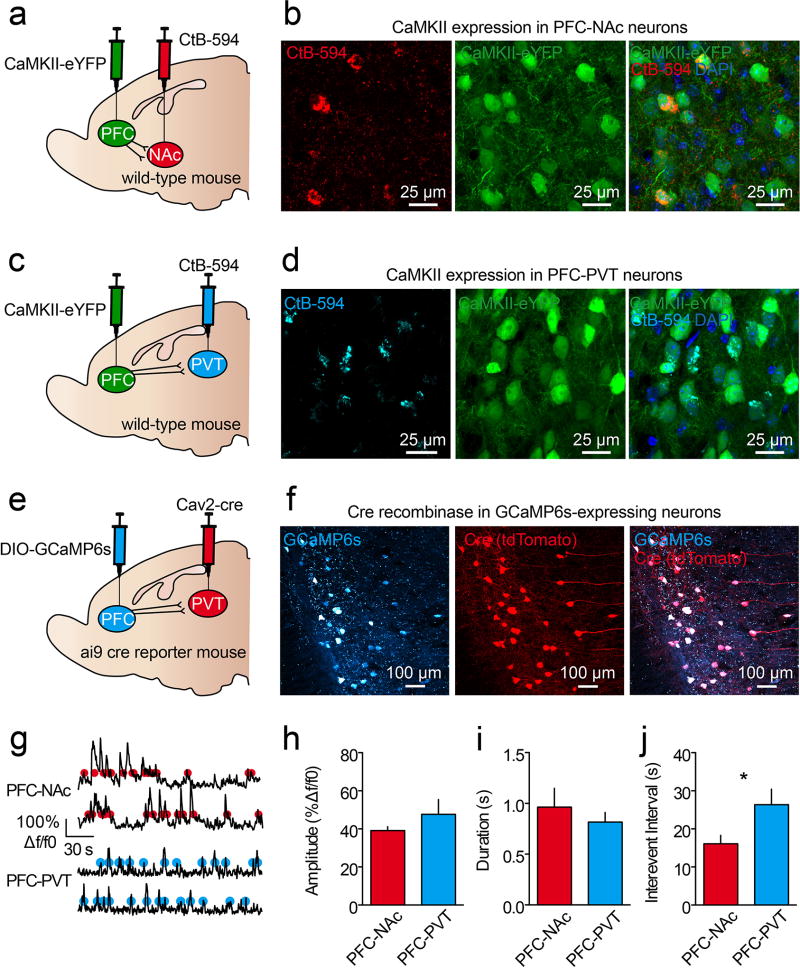
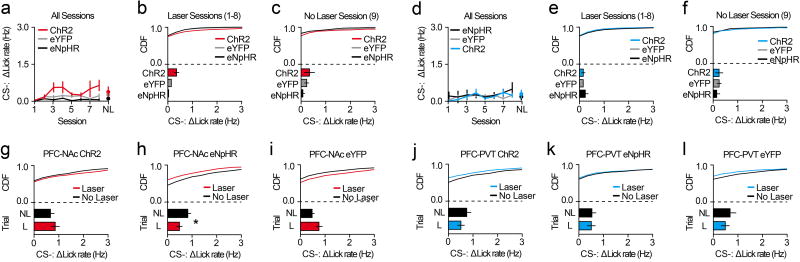
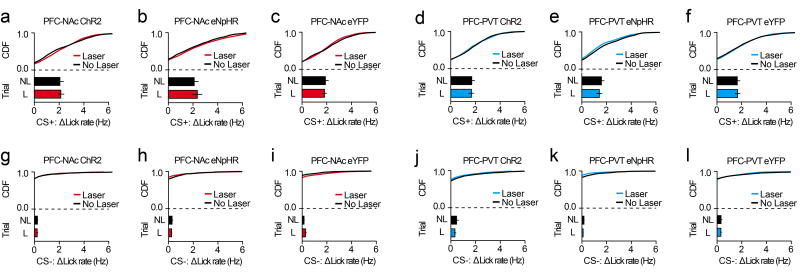
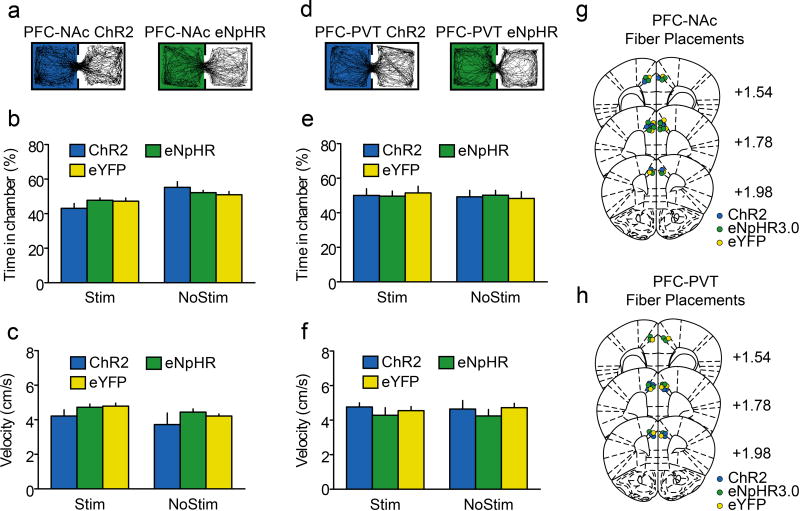
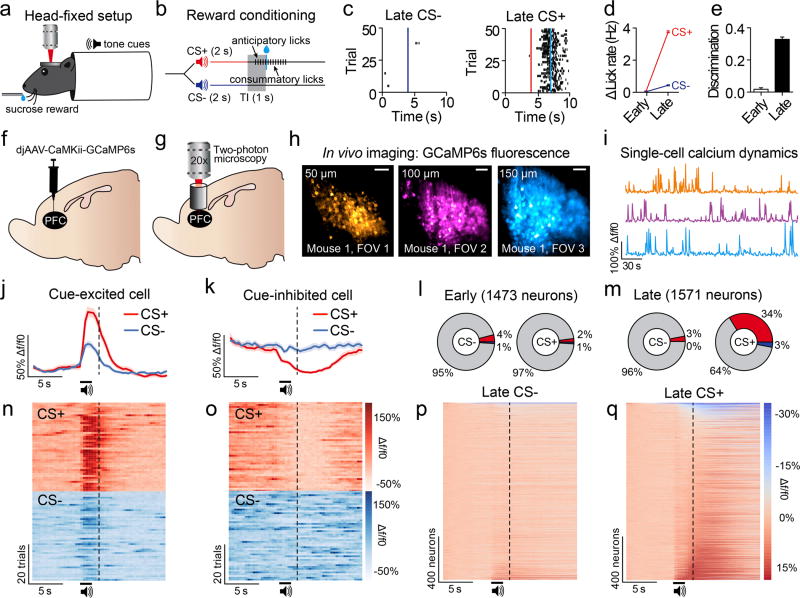
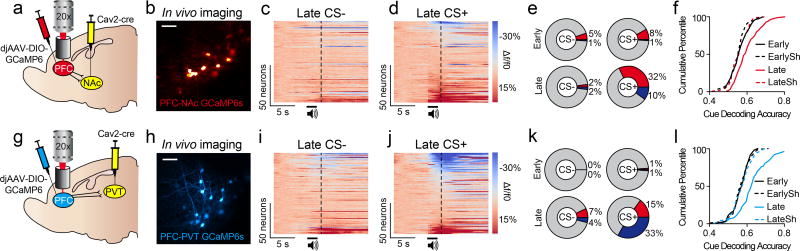
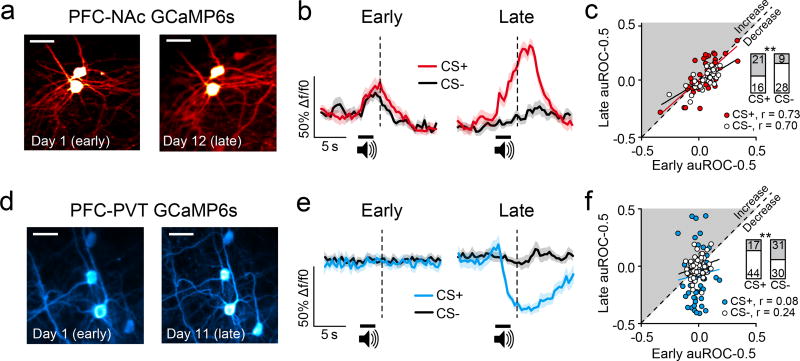
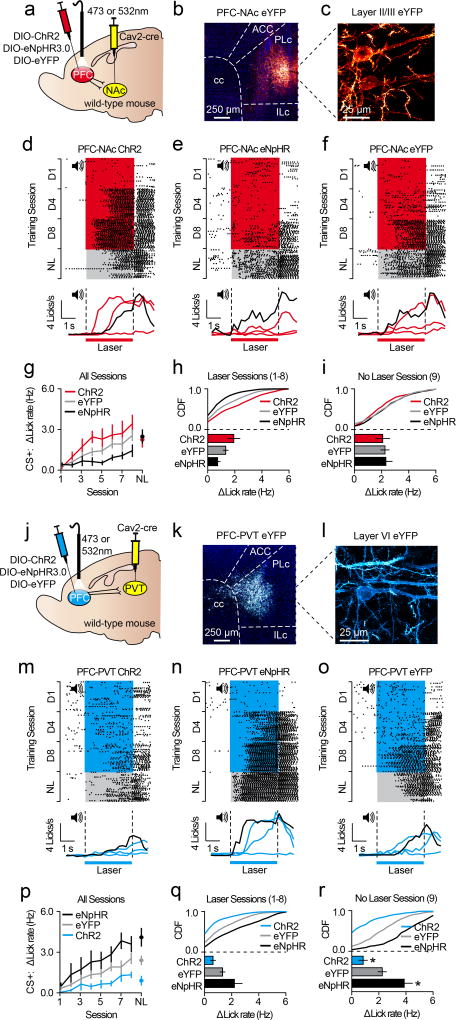
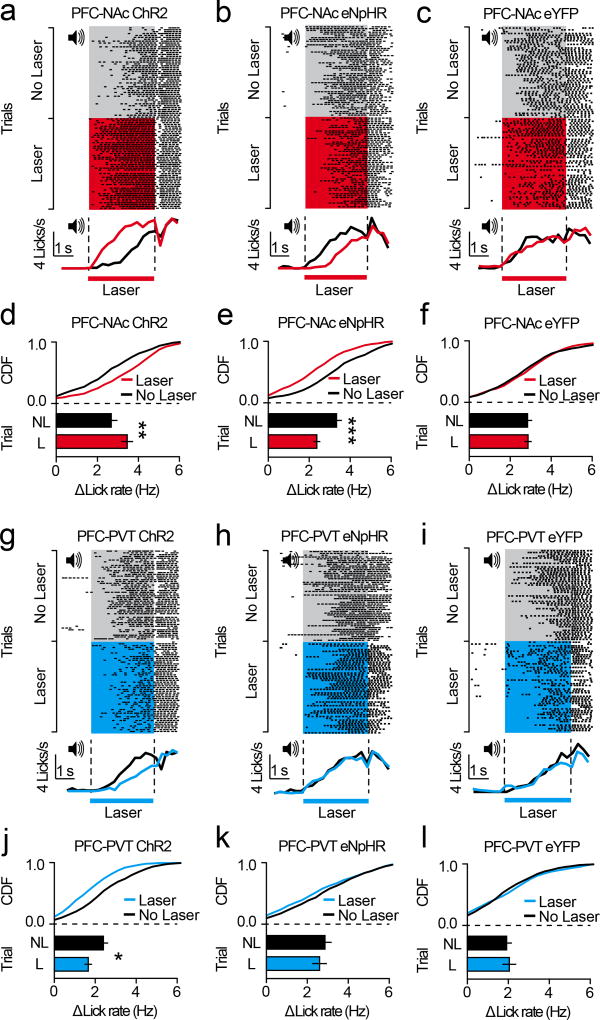
The prefrontal cortex is a critical neuroanatomical hub for controlling motivated behaviours across mammalian species. In addition to intra-cortical connectivity, prefrontal projection neurons innervate subcortical structures that contribute to reward-seeking behaviours, such as the ventral striatum and midline thalamus. While connectivity among these structures contributes to appetitive behaviours, how projection-specific prefrontal neurons encode reward-relevant information to guide reward seeking is unknown. Here we use in vivo two-photon calcium imaging to monitor the activity of dorsomedial prefrontal neurons in mice during an appetitive Pavlovian conditioning task. At the population level, these neurons display diverse activity patterns during the presentation of reward-predictive cues. However, recordings from prefrontal neurons with resolved projection targets reveal that individual corticostriatal neurons show response tuning to reward-predictive cues, such that excitatory cue responses are amplified across learning. By contrast, corticothalamic neurons gradually develop new, primarily inhibitory responses to reward-predictive cues across learning. Furthermore, bidirectional optogenetic manipulation of these neurons reveals that stimulation of corticostriatal neurons promotes conditioned reward-seeking behaviour after learning, while activity in corticothalamic neurons suppresses both the acquisition and expression of conditioned reward seeking. These data show how prefrontal circuitry can dynamically control reward-seeking behaviour through the opposing activities of projection-specific cell populations.


Conflict of interest statement

The authors declare no conflicts of interest.

Figures

Extended Data Figure 1
Extended Data Figure 1. Mice used for imaging experiments acquired cue-specific anticipatory licking across conditioning
a, Average lick rate during the 1-second baseline period (immediately before each cue delivery) for all imaging experiments (Early, n=30; Late n=30). b, Average lick rate during each cue (rather than the change in lick rate presented in the main figures) for all imaging experiments (Early, n=30; Late n=30). c, Individual behavioral discrimination (licking during CS+ versus CS−; auROC-0.5) scores during early and late conditioning sessions for all imaging sessions used in this manuscript (Early, n=30; Late, n=30; t(58)=43.0, p<0.001). Line graphs represent the mean±SEM. These data are presented in a summarized form in Figure 1d and 1e.
Extended Data Figure 2
Extended Data Figure 2. Elevations and reductions in GCaMP6s fluorescence track action potential frequency but not voltage per se
a, Virus injections of AAVdj-CaMKii-GCaMP6s into dorsomedial PFC allowed subsequent whole-cell patch-clamp slice recordings of GCaMP6s-expressing neurons. Coronal cartoon redrawn based on Paxinos and Watson, 2007. b,c, Example traces showing GCaMP6s fluorescence (b) during current-clamp recordings (c), in the absence (left) and presence (right) of action potentials (n=8 neurons; n=2 mice). d, Grouped data revealing that hyperpolarization resulted in negative GCaMP6s fluorescence deflections in the presence of baseline action potentials, but not in the absence of baseline action potentials (interaction: F(1,14)=20.0; p<0.001; post-hoc tests: baseline APs, p>0.4; no baseline APs, p<0.001). e, Example traces showing a series of depolarizing pulses (1–20Hz) applied in current clamp mode to drive trains of action potentials (bottom), during which GCaMP6s fluorescence was tracked in recorded neurons (top; n=12 neurons; n=2 mice). f, Action potential generation resulted in linear elevations in GCaMP6s fluorescence (r=0.776, p<0.001), such that a single action potential was detectable (red waveform; peak=12.6±4.0% Δf/f). g, A series of baseline depolarizing pulses (1–20Hz) was applied before and after a 3 second pause (n=7 neurons; n=2 mice). h, The pause in action potentials resulted in linear reductions in GCaMP6s fluorescence (r=−0.656, p<0.001), such that a 1Hz reduction in firing frequency was detectable (red waveform; peak=−8.4±2.0% Δf/f). Line graphs represent the mean±SEM. AP, action potential; ILc, infralimbic cortex; PLc, prelimbic cortex.
Extended Data Figure 3
Extended Data Figure 3. Cue responses in PFC CaMKii-expressing neurons, PFC-NAc neurons, and PFC-PVT neurons before appetitive learning
a,b, Population heat plots showing average responses for all individual PFC CaMKii-expressing neurons (n=1473 neurons; n=8 mice) across all CS− trials before learning (a) and all CS+ trials before learning (b). c,d, Population heat plots showing average responses for all individual PFC-NAc neurons (n=84 neurons; n=4 mice) across all CS− trials before learning (c) and all CS+ trials before learning (d). e,f, Population heat plots showing average responses for all individual PFC-PVT neurons (n=92 neurons; n=3 mice) across all CS− trials before learning (e) and all CS+ trials before learning (f). Data shown here are from neurons presented in Figures 1 & 2. Vertical dotted lines refer to the time of sucrose delivery (CS+ trials) or no sucrose delivery (CS− trials). CS, conditioned stimulus.
Extended Data Figure 4
Extended Data Figure 4. Cue discrimination in PFC CaMKii-expressing neurons before and after appetitive learning. a–c
Histograms for all recorded CaMKii-expressing PFC neurons (Early, n=1473 neurons; Late, n=1571 neurons; n=8 mice), showing CS+ responses (a), CS− responses (b), and CS+/CS− discrimination (c) during both early and late Pavlovian conditioning sessions. d, CDF plot showing that the dynamics of individual CaMKii-expressing neurons could be used to accurately decode whether the CS+ or CS− was presented in early conditioning sessions (compared to early shuffled: Welch’s t(2925.61)=7.30, p<0.001), as well as in late conditioning sessions (compared to late shuffled: Welch’s t(2727.06)=24.84, p<0.001). Data shown here are from neurons presented in Figure 1. CDF, cumulative distribution frequency; CS, conditioned stimulus; EarlySh, early shuffled; LateSh, late shuffled.
Extended Data Figure 5
Extended Data Figure 5. Corticostriatal and corticothalamic projection neurons are anatomically and electrophysiologically distinct
a,b, CtB-488 and CtB-594 were injected (n=3 mice) into either NAc or PVT (scale bars=250µm) (a), resulting in retrograde labeling of NAc-projecting and PVT-projecting neurons in dorsomedial PFC (scale bars=50µm) (b). c–e, Coronal sections of anterior (c), middle (d), and posterior (e) dorsomedial PFC revealing spatial separation of PFC-NAc and PFC-PVT neurons (scale bars=250µm). f–h, Population histograms from all mice (n=3) showing cell counts from anterior (f), middle (g), and posterior (h) dorsomedial PFC reveal that NAc-projecting neurons (red) are in more superficial layers as compared with PVT-projecting neurons (blue). Black refers to overlap (medial-lateral axis) between red and blue bars, and purple refers to double-labeled neurons (i.e., both NAc and PVT projection neurons). i, Current clamp recordings from dorsomedial PFC CtB-labeled neurons projecting to either NAc (top; n=9 neurons; n=3 mice; scale bars=25µm) or PVT (bottom; n=10 neurons; n=3 mice; scale bars=25µm). j,k, Representative waveforms (j) and averaged data (k) showing that PFC-NAc neurons fired fewer action potentials (spikes) as compared to PFC-PVT neurons during somatic depolarization (interaction: F(16,272)=16.6, p<0.001). l,m, Representative waveforms (l) and averaged data (m) revealing no differences in rheobase (the minimum current required to evoke an action potential) between PFC-NAc and PFC-PVT neurons (t(17)=1.22, p>0.2). n,o, Representative waveforms (n) and averaged data (o) showing that PFC-NAc neurons had larger peak AHPs as compared with PFC-PVT neurons (t(17)=4.67, p<0.001). p, The maximum number of action potentials (spikes) in each neuron was correlated with the peak AHP (r=0.80, p<0.001). Line and bar graphs represent the mean±SEM. AHP, afterhyperpolarization, cc, corpus callosum; ILc, Infralimbic cortex; MO, medial orbitofrontal cortex; PLc, prelimbic cortex; VO ventral orbitofrontal cortex.
Extended Data Figure 6
Extended Data Figure 6. Corticostriatal and corticothalamic projection neurons have distinct monosynaptic inputs
a–d, Viral strategy for rabies tracing experiments in which the monosynaptic inputs to (a,b) PFC-NAc and (c,d) PFC-PVT neurons were evaluated (n=3 mice/group). e–g, Example images showing (e) mCherry+ cells (TVA expression), (f) RV-GFP+ cells (local interneurons), and (g) overlap revealing mCherry+/RV-GFP+ cells (starter cells) or only GFP+ cells (local interneurons). h, The number of local inputs neurons (nonstarter; only GFP+ cells per section) to each projection population, as quantified by raw neuron count and by the percent of starter cells for each mouse, was equivalent for PFC-NAc and PFC-PVT neurons (raw neuron count: t(16)=0.59, p=0.56; % starter cells: t(16)=0.13, p=0.90). i, Representative image showing RV-GFP but not mCherry expression in the ACC. j, The number of input neurons from ACC was higher for PFC-PVT neurons as compared with PFC-NAc neurons (raw neuron count: t(16)=3.51; p=0.003; % starter cells: t(16)=3.31, p=0.004). k, Representative image showing RV-GFP but not mCherry expression in the LPO. l, The number of input neurons from the LPO was equivalent for PFC-NAc and PFC-PVT cells (raw neuron count: t(16)=1.77; p=0.01; % starter cells: t(16)=0.20, p=0.84). m, Representative image showing RV-GFP but not mCherry expression in the vHipp. n, The number of input neurons from vHipp was higher for PFC-NAc neurons as compared with PFC-PVT neurons (raw neuron count: t(16)=4.44; p<0.001; % starter cells: t(16)=4.00, p=0.001). o, Representative image showing RV-GFP but not mCherry expression in the VTA. p, The number of input neurons from the VTA was equivalent for PFC-NAc and PFC-PVT cells (raw neuron count: t(16)=0.56; p=0.59; % starter cells: t(16)=0.09, p=0.93). Bar graphs represent the mean±SEM. ACC, anterior cingulate cortex; RV-GFP, rabies virus encoding green fluorescent protein; LPO, lateral preoptic area; vHipp, ventral hippocampus; VTA, ventral tegmental area. *Note: no RV-GFP+ neurons were detected in any nucleus of the amygdala for either projection group.
Extended Data Figure 7
Extended Data Figure 7. Corticostriatal and corticothalamic projection neurons express CaMKii and have distinct basal activity dynamics
a–d, Injections of AAV5-CaMKii-eYFP into dorsomedial PFC and the retrograde tracer CtB-594 into NAc (a) or PVT (c) resulted in expression of eYFP in CtB-labeled PFC-NAc neurons (b) and PFC-PVT neurons (d). These data reveal that PFC-NAc and PFC-PVT are subpopulations of CaMKii-expressing neurons (n=2 mice/group). e,f, In ai9 reporter mice, (e) DIO-GCaMP6s injections in dorsomedial PFC and Cav2-cre injections into PVT (f) result in expression of GCaMP6s and tdTomato (marker for cre-recombinase), which have spatial overlap in PFC (n=2 mice). These data reveal that GCaMP6s expression is specific to the projection cells of interest. g, Example traces revealing spontaneous calcium dynamics from in vivo two-photon imaging in GCaMP6s-expressing PFC-NAc neurons (top; n=69 neurons; n=4 mice) and PFC-PVT neurons (bottom; n=61; n=3 mice) in awake, head-fixed mice. Red and blue dots refer to detected events. h–j, Averaged data reveal no differences in event amplitude (h) or event duration (i); however, PFC-NAc neurons had significantly shorter inter-event intervals (j) as compared to PFC-PVT neurons (amplitude: t(130)=1.10, p>0.2; duration: t(130)=0.68, p>0.4; interval: t(130)=2.30, p<0.05). Bar graphs represent the mean±SEM. CtB, cholera toxin subunit B; tdT, tdTomato.
Extended Data Figure 8
Extended Data Figure 8. Effects of corticostriatal and corticothalamic optogenetic manipulations on acquisition and expression of CS− licking
Acquisition: a, Line graph showing average CS− lick rate during conditioning (with laser) and test (no laser) from PFC-NAc::ChR2 (n=5), PFC-NAc::eNpHR (n=6), and PFC-NAc::eYFP mice (n=10). b,c, CDF plots and bar graphs showing CS− lick rate during conditioning (b) and test (c). No differences were observed between PFC-NAc groups during the no-laser test (ChR2 vs. eYFP: auROC=0.53, BHC p=0.43; eNpHR vs. eYFP: auROC=0.45, p=0.43). d, Line graph showing average CS− lick rate during conditioning (with laser) and test (no laser) from PFC-PVT::ChR2 (n=6), PFC-NAc::PVT (n=5), and PFC-PVT::eYFP mice (n=10). e,f, CDF plots and bar graphs showing CS− lick rate during conditioning (e) and test (f). No differences were observed between PFC-PVT groups during the no-laser test (ChR2 vs. eYFP: auROC=0.48, BHC p=0.48; eNpHR vs. eYFP: auROC=0.32, p=0.30). Expression: g–i, CDF plots and bar graphs showing CS− lick rates for PFC-NAc::ChR2 (n=5), PFC-NAc::eNpHR (n=5), and PFC-NAc::eYFP mice (n=8). There were no significant differences in CS− lick rate for PFC-NAc::ChR2 mice (vs. PFC-NAc::eYFP: auROC=0.43, p=0.26), although there was an effect of laser for PFC-NAc eNpHR mice (vs. PFC-NAc::eYFP: auROC=0.23, p=0.006). j–l, CDF plots and bar graphs showing CS− lick rates for PFC-PVT::ChR2 (n=5), PFC-PVT::eNpHR (n=5), and PFC-PVT::eYFP mice (n=6). There were no significant differences in CS− lick rate for PFC-PVT::ChR2 mice (vs. PFC-PVT::eYFP: auROC=0.35, p=0.15) or PFC-PVT::eNpHR mice (vs. PFC-PVT::eYFP: auROC=0.55, p=0.31). Line and bar graphs represent the mean±SEM. CDF, cumulative distribution frequency; NL, no laser test.
Extended Data Figure 9
Extended Data Figure 9. Effects of corticostriatal and corticothalamic optogenetic manipulations are timing dependent
a–c, CDF plots (top) and bar graphs (bottom) show anticipatory licking rates for PFC-NAc::ChR2 (n=5) or PFC-NAc::eNpHR3.0 (n=5) versus PFC-NAc::eYFP mice (n=6) during sessions in which the laser was randomly presented outside of cue delivery. There were no significant differences in anticipatory lick rate for PFC-NAc::ChR2 mice (vs. PFC-NAc::eYFP: auROC=0.56, BHC p=0.30) or PFC-NAc::eNpHR mice (vs. PFC-NAc::eYFP: auROC=0.63, p=0.23). d–f, CDF plots (top) and bar graphs (bottom) show anticipatory licking rates for PFC-PVT::ChR2 (n=5) or PFC-PVT::eNpHR3.0 (n=5) versus PFC-PVT::eYFP (n=8) mice during sessions in which the laser was randomly presented outside of cue delivery. There were no significant differences in anticipatory lick rate for PFC-PVT::ChR2 mice (vs. PFC-PVT::eYFP: auROC=0.42, p=0.21) or PFC-PVT::eNpHR mice (vs. PFC-PVT::eYFP: auROC=0.36, BHC p=0.14). g–i, CDF plots (top) and bar graphs (bottom) show CS− lick rates for PFC-NAc::ChR2 (n=5) or PFC-NAc::eNpHR3.0 (n=5) versus PFC-NAc::eYFP mice (n=6) during sessions in which the laser was randomly presented outside of cue delivery. There were no significant differences in CS− lick rate for PFC-NAc::ChR2 mice (vs. PFC-NAc::eYFP: auROC=0.41, p=0.19) or PFC-NAc::eNpHR mice (vs. PFC-NAc::eYFP: auROC=0.40, p=0.19). j–l, CDF plots (top) and bar graphs (bottom) show CS− lick rates for PFC-PVT::ChR2 (n=5) or PFC-PVT::eNpHR3.0 (n=5) versus PFC-PVT::eYFP (n=8) mice during sessions in which the laser was randomly presented outside of cue delivery. There were no significant differences in CS− lick rate for PFC-PVT::ChR2 mice (vs. PFC-PVT::eYFP: auROC=0.39, p=0.12) or PFC-PVT::eNpHR mice (vs. PFC-PVT::eYFP: auROC=0.36, p=0.12). Bar graphs represent the mean±SEM. CDF, cumulative distribution frequency.
Extended Data Figure 10
Extended Data Figure 10. Optogenetic manipulations of corticostriatal and corticothalamic neurons are not appetitive, aversive, and do not affect movement
a, Tracking data from single example mice during real time place preference experiments showing that PFC-NAc::ChR2 (left; 5) and PFC-NAc::eNpHR3.0 (right; n=5) mice spent equivalent time in chambers that were paired with laser (PFC-NAc::eYFP mice, n=8). b, Grouped data show that laser stimulation in PFC-NAc mice did not lead to a real-time place preference (interaction: F(2,30)=2.15, p>0.13). c, Grouped data show that optogenetic manipulations in PFC-NAc mice did not influence velocity of movement (interaction: F(2,30)=0.12, p>0.88). d, Tracking data from single example mice during real time place preference experiments showing that PFC-PVT::ChR2 (left; n=5) and PFC-PVT::eNpHR3.0 (right; n=5) mice spent equivalent time in chambers that were paired with laser (PFC-PVT::eYFP mice, n=5). e, Grouped data show that laser stimulation in PFC-PVT mice did not lead to a real-time place preference (interaction: F(2,24)=0.15, p>0.86). f, Grouped data show that optogenetic stimulation in PFC-PVT did not influence velocity of movement (interaction: F(2,24)=0.10, p>0.90). g,h, Coronal plates (redrawn based on Paxinos and Watson, 2007) located 1.98, 1.78, and 1.54 mm anterior to bregma illustrate the placements of optical fiber tips in PFC-NAc mice (g) and PFC-PVT mice (h). Bar graphs represent the mean±SEM. NoStim, no laser stimulation; Stim, laser stimulation.
Figure 1
Figure 1. PFC neurons show heterogeneous responses to reward-predictive cues
a, Head fixation allowed two-photon microscopy in awake, behaving mice. b, Schematic of the Pavlovian conditioning paradigm. c, Example data showing anticipatory licking to the CS+ but not CS− after learning. d, Average change in lick rate during each cue for early and late conditioning sessions. e, Behavioral discrimination (licking during CS+ versus CS−; auROC-0.5) during early and late conditioning sessions wherein separate FOVs were examined (Early, n=30; Late, n=30; t(58)=43.0, p<0.001). f,g, Injections of AAVdj-CaMKii-GCaMP6s into PFC (f) and optical cannula implantation (g) allowed two-photon imaging of PFC neurons throughout conditioning (Early, n=1473 neurons; Late n=1571 neurons; n=8 mice). h,i, GCaMP6s expression across multiple FOVs in dorsomedial PFC (h) allowed recordings from hundreds of prefrontal neurons within individual mice (i). j,k, Perievent data showing example excitatory (j) or inhibitory (k) responses from example neurons during cue delivery after learning. l, Population data of all neurons showing few excitatory (red) or inhibitory (blue) cue responses (p<0.05 after correction; see Methods) to the CS+ and CS− during early sessions (CS+ versus CS−: χ2(2)=9.06, p=0.01). m, Population data of all neurons show many excitatory (red) or inhibitory (blue) cue responses to the CS+, but not CS−, during late sessions (CS+ versus CS−: χ2(2)=523.15, p<0.001). n,o, Heat plots from individual example neurons that showed excitatory (n) or inhibitory (o) responses during cue delivery. p,q, Population heat plots from all mice plots showing averaged cue responses after learning. Bar and line graphs represent the mean±SEM. Vertical dotted lines refer to timing of sucrose delivery. Scale bars=100µm; CS, conditioned stimulus; FOV, field of view; TI, trace interval.
Figure 2
Figure 2. PFC projection neurons have opposing responses to reward-predictive cues
a,b, Viral strategy (a) allowed recordings of PFC-NAc::GCaMP6s neurons (Early, n=84 neurons; Late, n=101 neurons; n=4 mice) in vivo (b). c,d, Population heat plots showing responses for all PFC-NAc::GCaMP6s neurons averaged across CS− trials (c) and CS+ trials (d) after learning. e, Population data of all PFC-NAc::GCaMP6s neurons showing no difference in CS+ versus CS− responses during early sessions (top; χ2(2)=0.88, p>0.6); however, these responses were different during late sessions (bottom; χ2(2)=41.06, p<0.001). f, CDF plots showing that the dynamics of individual PFC-NAc::GCaMP6s neurons could be used to accurately decode whether the CS+ or CS− was presented in late conditioning sessions (compared to late shuffled: Welch’s t(178.66)=5.63, p<0.001), but not in the early conditioning sessions (compared to early shuffled: Welch’s t(165.47)=1.13, p>0.2). g,h, Viral strategy (g) allowed recordings of PFC-PVT::GCaMP6s neurons (Early, n=92 neurons; Late, n=123 neurons; n=3 mice) in vivo (h). i,j, Population heat plots showing responses for all PFC-PVT::GCaMP6s neurons averaged across CS− trials (i) and CS+ trials (j) after learning. k, Population data of all PFC-PVT::GCaMP6s neurons showing no difference in CS+ versus CS− responses during early sessions (top; χ2(2)=2.02, p>0.35); however, these responses were different during late sessions (bottom; χ2(2)=43.86, p<0.001). l, CDF plots showing that the dynamics of individual PFC-PVT::GCaMP6s neurons could be used to accurately decode whether the CS+ or CS− was presented during late conditioning sessions (compared to late shuffled: Welch’s t(212.01)=6.03, p<0.001) but not during the early conditioning sessions (compared to early shuffled: Welch’s t(180.89)= −0.56, p>0.5). Vertical dotted lines refer to timing of sucrose delivery. Scale bars=100µm; CDF, cumulative distribution frequency; CS, conditioned stimulus; EarlySh, early shuffled; LateSh, late shuffled.
Figure 3
Figure 3. PFC projection neurons show distinct functional plasticity across learning
a, Representative images show the same PFC-NAc::GCaMP6s neurons tracked from early (left) to late (right) sessions (n=37 neurons; n=4 mice). b, Traces from individual example neurons averaged across trials during early (left) and late (right) sessions. c, Cue responses of PFC-NAc::GCaMP6s neurons during early conditioning sessions could be used to predict responses during late conditioning sessions (CS+, r=0.73, p<0.001; CS−, r=0.70, p<0.001). c,inset, Bar graphs showing that most PFC-NAc::GCaMP6s neurons showed elevated (gray) GCaMP6s fluorescence to the CS+ across learning, and reduced (white) GCaMP6s fluorescence to the CS− across learning (χ2(1)=8.07; p<0.005). d, Representative images show the same PFC-PVT::GCaMP6s neurons tracked from early (left) to late (right) sessions (n=61 neurons; n=3 mice). e, Traces from individual example neurons averaged across trials during early (left) and late (right) sessions. f, Cue responses of all PFC-PVT::GCaMP6s neurons during early Pavlovian conditioning sessions could not be used to predict subsequent responses during late conditioning sessions (CS+, r=0.08, p>0.05; CS−, r=0.24, p>0.05). f,inset, Bar graphs showing that most PFC-PVT::GCaMP6s neurons showed reduced (white) GCaMP6s fluorescence to the CS+ across learning, whereas equivalent numbers of neurons showed elevated (gray) and reduced (white) GCaMP6s fluorescence to the CS− across learning (χ2(1)=6.73, p<0.01). Vertical dotted lines refer to timing of sucrose delivery. Scale bars=25µm; CS, conditioned stimulus.
Figure 4
Figure 4. Activity in corticothalamic neurons controls acquisition of conditioned reward seeking
a–c, Viral strategy (a) for PFC-NAc optogenetics experiments resulted in eYFP expression in PFC-NAc neurons (b,c). d–f, Example perievent rasters (top) and histograms (bottom; red lines refer to laser sessions (D1, D4, D8) and black line refers to no-laser test) from PFC-NAc::ChR2 (n=5), PFC-NAc::eNpHR (n=6), and PFC-NAc::eYFP mice (n=10). g, Line graph showing CS+ lick rate during conditioning (with laser) and test (no laser). h,i, CDF plots and bar graphs showing CS+ lick rate during conditioning (h) and test (i). No differences were observed between PFC-NAc groups during the no-laser test (ChR2 vs. eYFP: auROC=0.43; p=0.48; eNpHR vs. eYFP: auROC=0.51, p=0.48). j–l, Viral strategy (j) for PFC-PVT optogenetics experiments resulted in eYFP expression in PFC-PVT neurons (k,l). m–o, Example perievent rasters (top) and histograms (bottom; blue lines refer to laser sessions (D1, D4, D8) and black line refers to no-laser test) from a PFC-PVT::ChR2 (n=6), PFC-PVT::eNpHR (n=5), or PFC-PVT::eYFP mouse (n=10). p, Line graph showing average CS+ lick rate during all conditioning sessions (with laser) and test (no laser). q,r, CDF plots and bar graphs showing CS+ lick rate during all laser sessions (q), and during the no laser test (r). CS+ lick rate was reduced in PFC-PVT::ChR2 mice (vs. PFC-PVT::eYFP mice: auROC=0.09, p=0.01) and enhanced in PFC-PVT::eNpHR mice (vs. PFC-PVT::eYFP mice: auROC=0.84, p=0.02). Line and bar graphs represent the mean±SEM. ACC, anterior cingulate cortex; cc, corpus callosum; CDF, cumulative distribution frequency; ILc, infralimbic cortex; NL, no-laser test; PLc, prelimbic cortex.
Figure 5
Figure 5. Activity in corticostriatal and corticothalamic neurons controls expression of conditioned reward seeking
a–c, Example perievent rasters (top) and histograms (bottom) from PFC-NAc::ChR2 (n=5), PFC-NAc::eNpHR (n=5), and PFC-NAc::eYFP mice (n=8). d–f, CDF plots and bar graphs showing that the laser increased CS+ licking for PFC-NAc::ChR2 mice (vs. PFC-NAc::eYFP: auROC=0.74, p=0.006) and reduced CS+ licking for PFC-NAc::eNpHR mice (vs. PFC-NAc::eYFP: auROC=0.18, p<0.001). g–i, Example perievent rasters (top) and histograms (bottom) from PFC-PVT::ChR2 (n=5), PFC-PVT::eNpHR (n=5), and PFC-PVT::eYFP mice (n=6). j–l, CDF plots and bar graphs showing that the laser decreased CS+ licking for PFC-PVT::ChR2 mice (vs. PFC-PVT::eYFP: auROC=0.26, p=0.02), whereas no effect of laser was observed for PFC-NAc::eNpHR mice (vs. PFC-PVT::eYFP: auROC=0.37, p=0.11). Bar graphs represent the mean±SEM. CDF, cumulative distribution frequency.

References

    1. Langworthy OR. Increased spontaneous activity produced by frontal lobe lesion in cats. Am. J. Physiol. 1939;126:158–161.
    1. Matsumoto K, Suzuki W, Tanaka K. Neuronal correlates of goal-based motor selection in the prefrontal cortex. Science. 2003;301:229–232. - PubMed
    1. Warden MR, et al. A prefrontal cortex-brainstem neuronal projection that controls response to behavioural challenge. Nature. 2012;492:428–432. - PMC - PubMed
    1. Vertes RP. Differential projections of the infralimbic and prelimbic cortex in the rat. Synapse. 2004;51:32–58. - PubMed
    1. Britt JP, Benaliouad F, McDevitt RA, Stuber GD, Wise RA, Bonci A. Synaptic and behavioral profile of multiple glutamatergic inputs to the nucleus accumbens. Neuron. 2012;76:790–803. - PMC - PubMed

Publication types

MeSH terms