. 2017 Mar 2;543(7643):113-117.
doi: 10.1038/nature21405. Epub 2017 Feb 22.

Targeting a CAR to the TRAC locus with CRISPR/Cas9 enhances tumour rejection

Affiliations

Targeting a CAR to the TRAC locus with CRISPR/Cas9 enhances tumour rejection

Justin Eyquem et al. Nature. .

Abstract

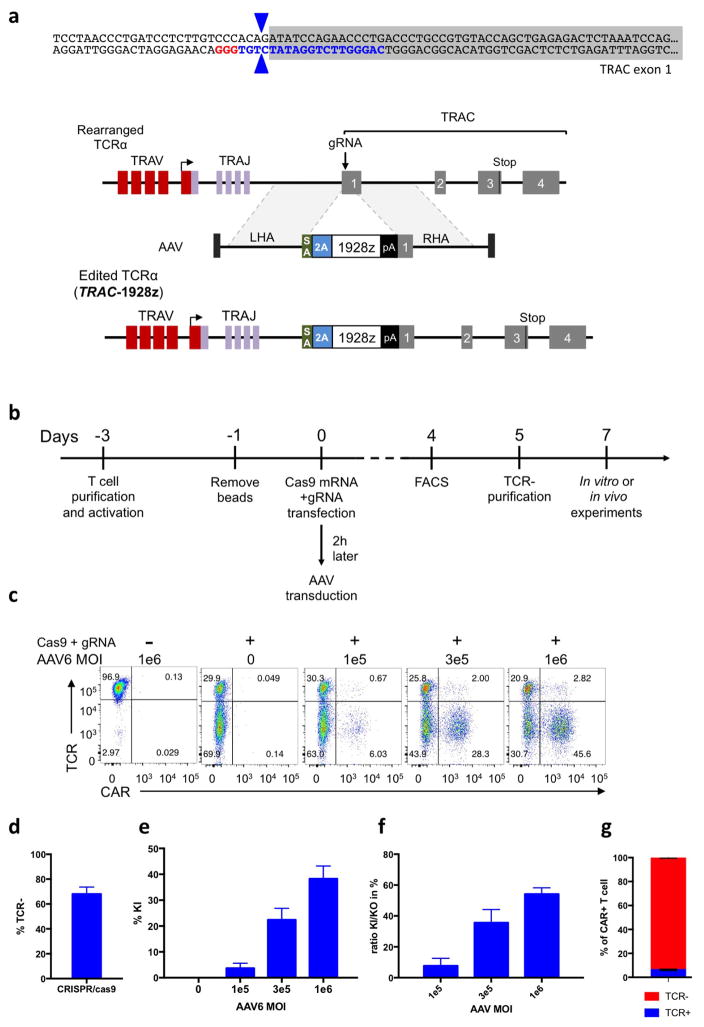
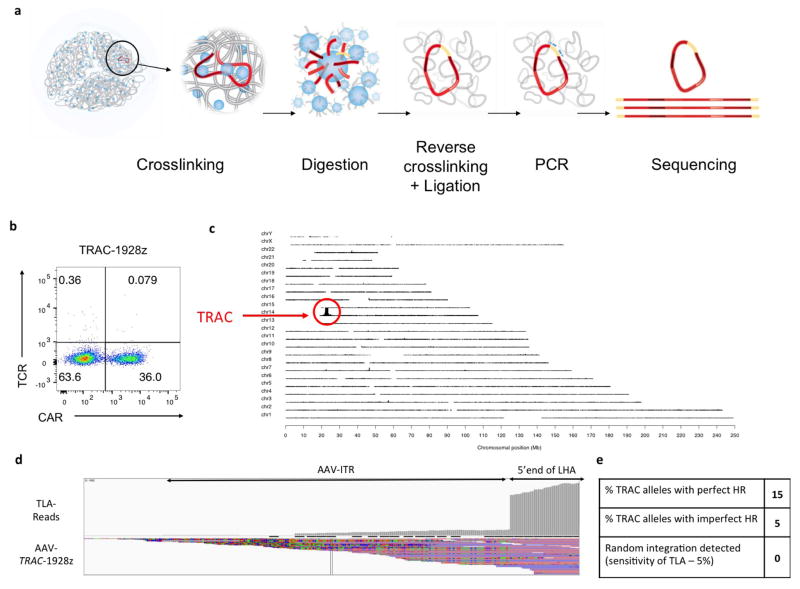
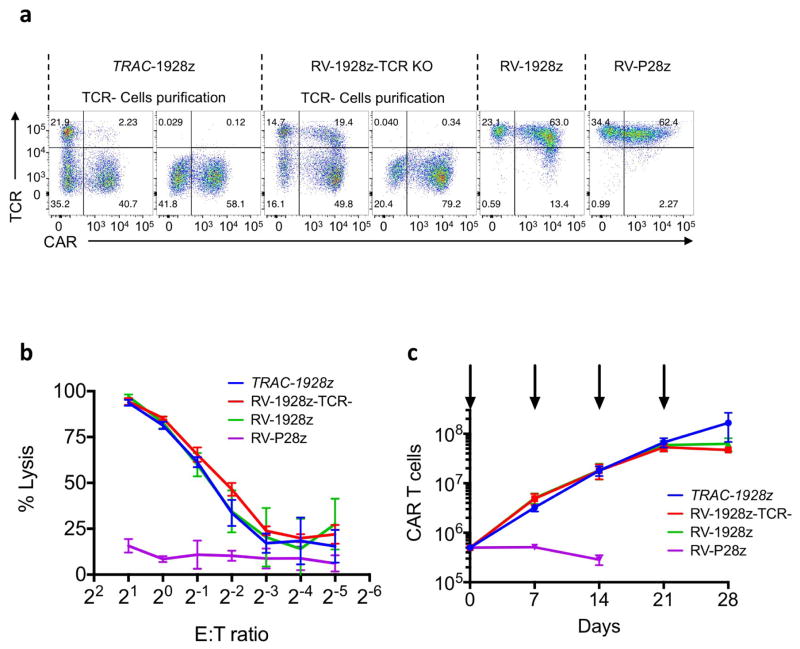
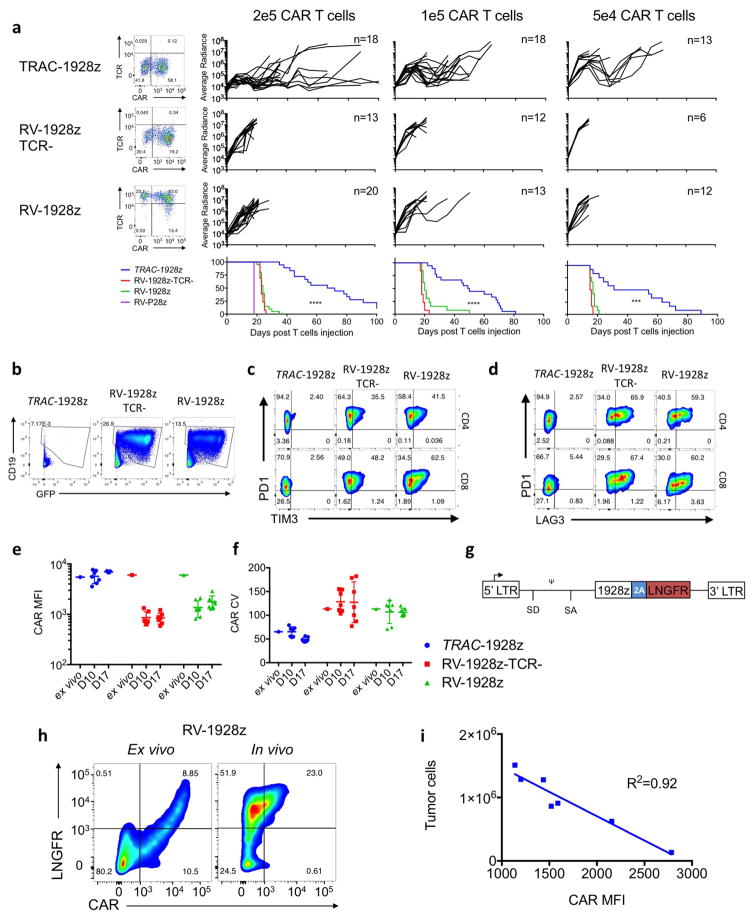
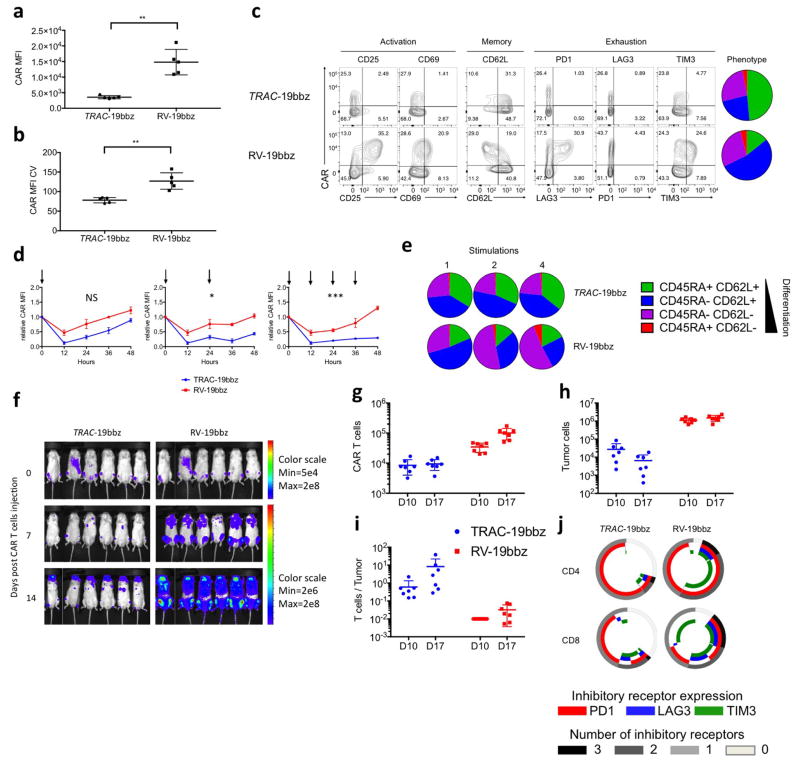
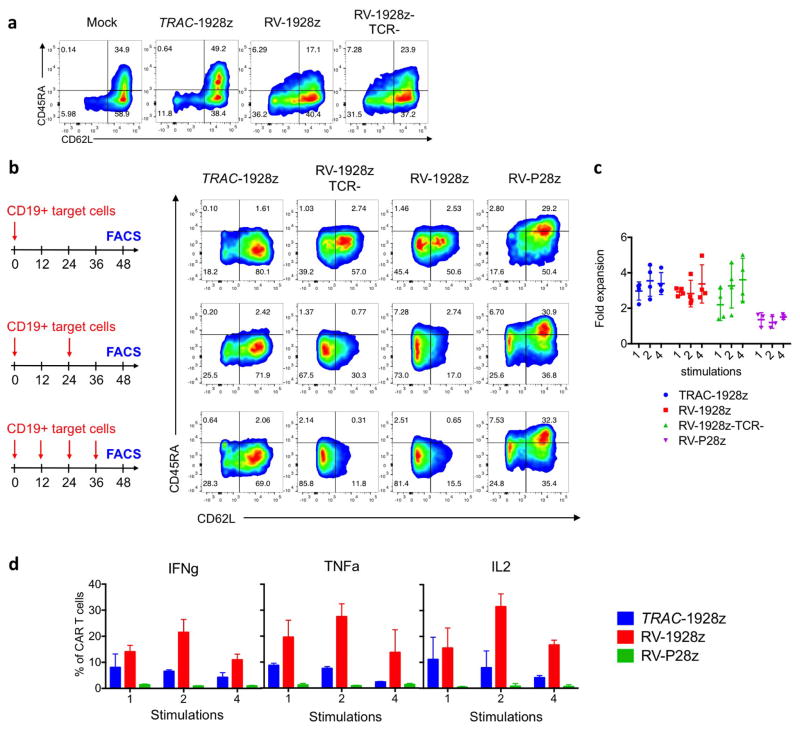
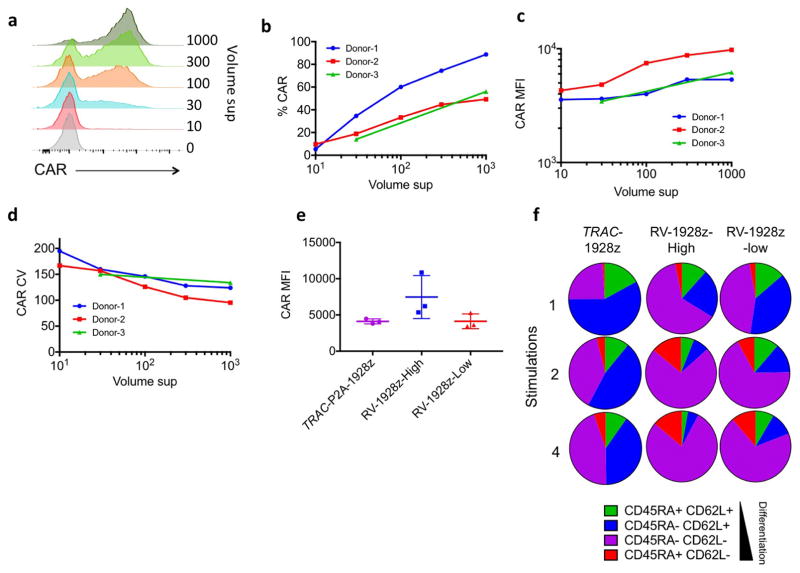
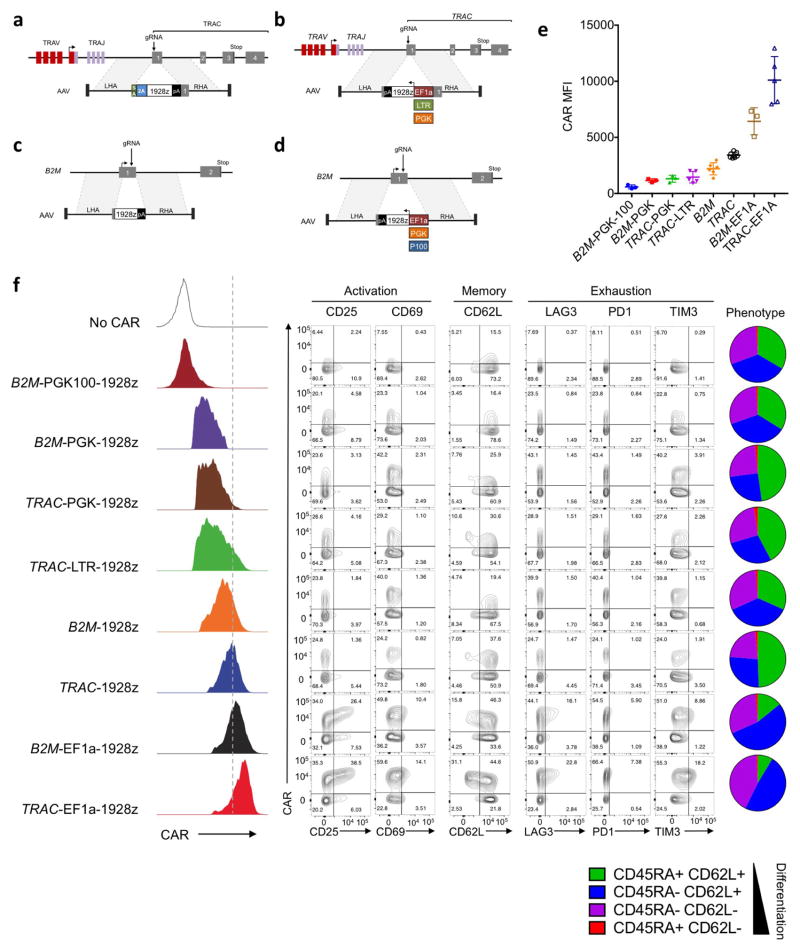
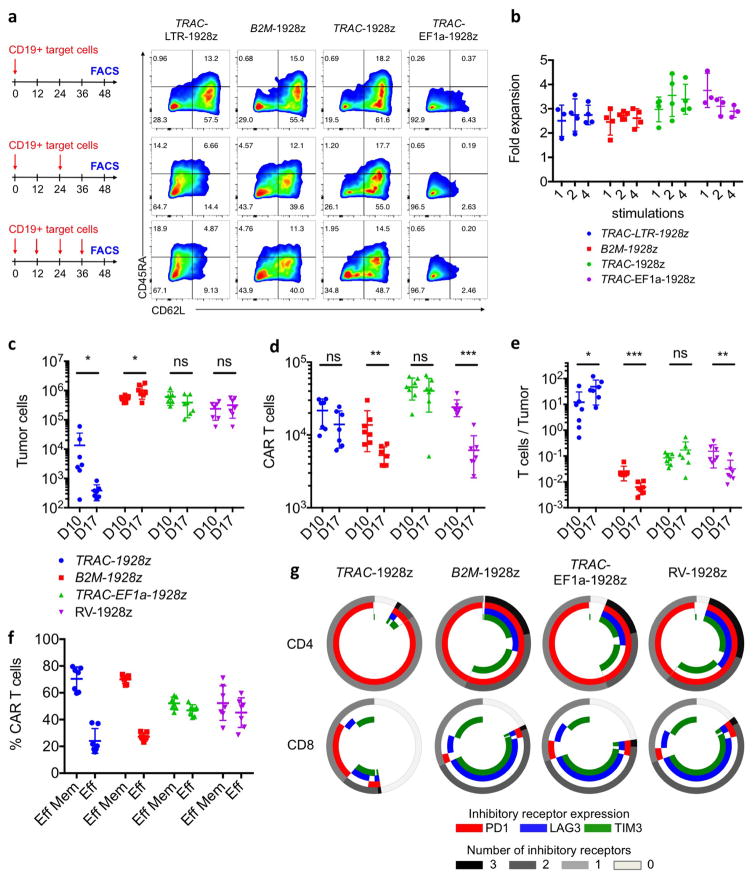
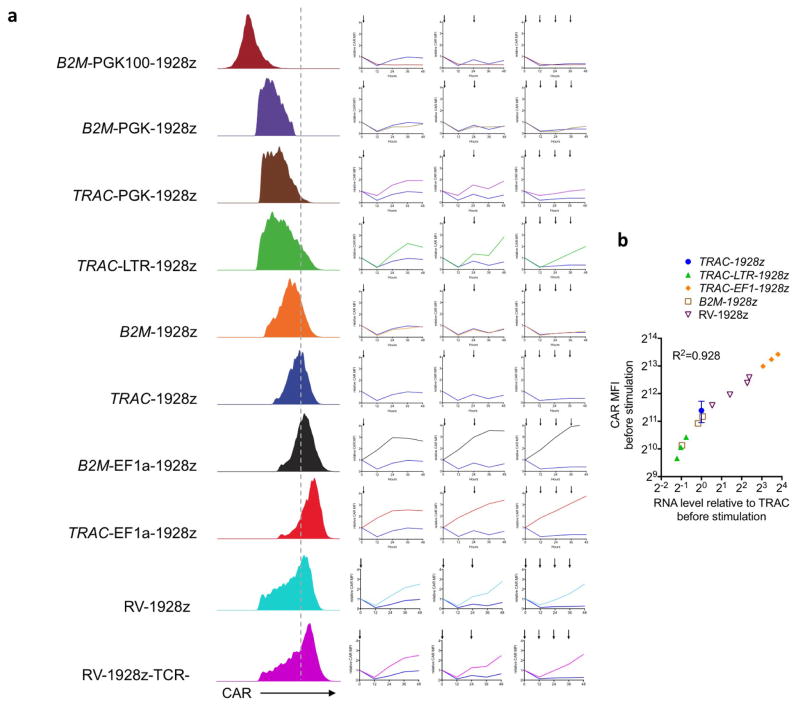
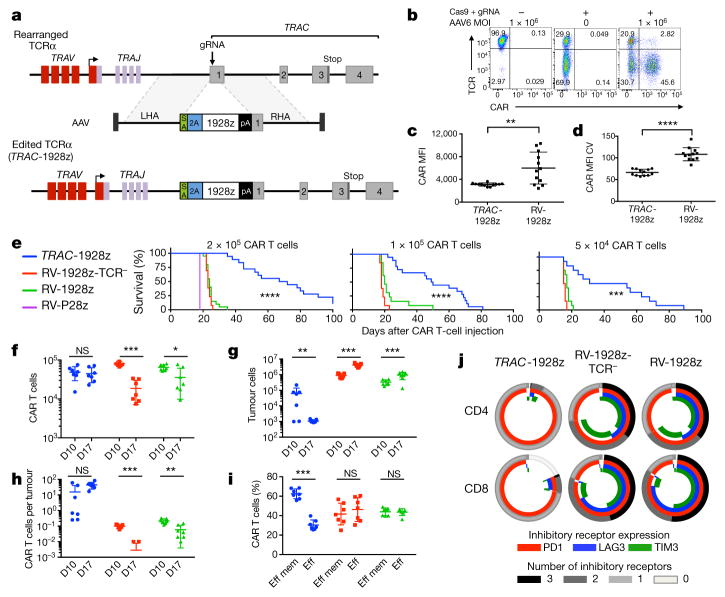
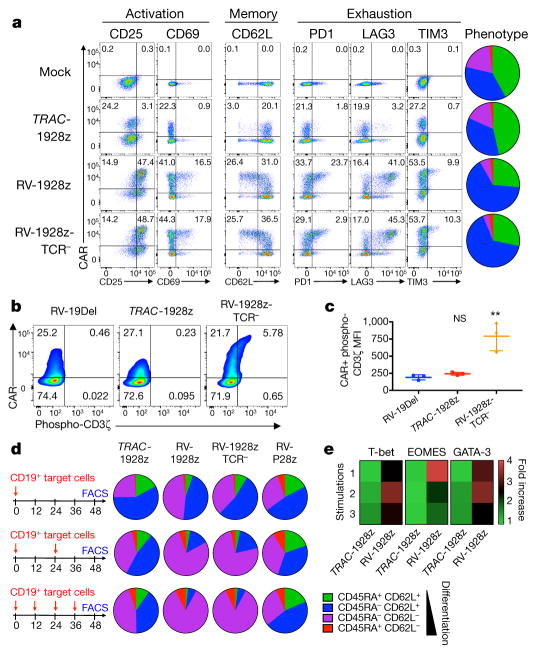
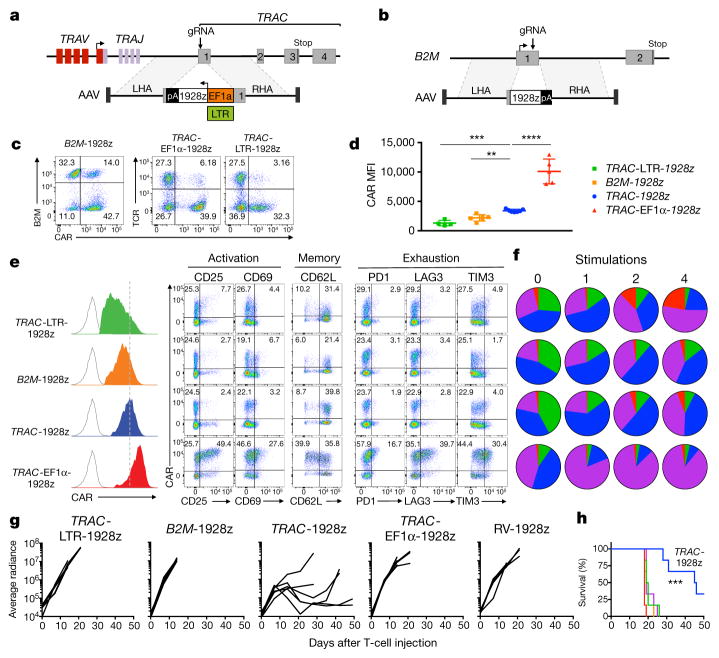
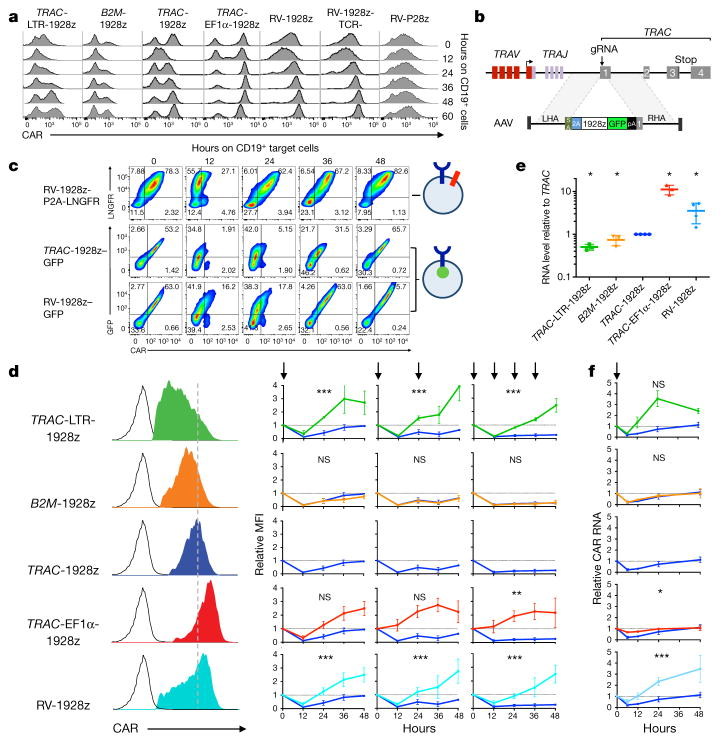
Chimeric antigen receptors (CARs) are synthetic receptors that redirect and reprogram T cells to mediate tumour rejection. The most successful CARs used to date are those targeting CD19 (ref. 2), which offer the prospect of complete remission in patients with chemorefractory or relapsed B-cell malignancies. CARs are typically transduced into the T cells of a patient using γ-retroviral vectors or other randomly integrating vectors, which may result in clonal expansion, oncogenic transformation, variegated transgene expression and transcriptional silencing. Recent advances in genome editing enable efficient sequence-specific interventions in human cells, including targeted gene delivery to the CCR5 and AAVS1 loci. Here we show that directing a CD19-specific CAR to the T-cell receptor α constant (TRAC) locus not only results in uniform CAR expression in human peripheral blood T cells, but also enhances T-cell potency, with edited cells vastly outperforming conventionally generated CAR T cells in a mouse model of acute lymphoblastic leukaemia. We further demonstrate that targeting the CAR to the TRAC locus averts tonic CAR signalling and establishes effective internalization and re-expression of the CAR following single or repeated exposure to antigen, delaying effector T-cell differentiation and exhaustion. These findings uncover facets of CAR immunobiology and underscore the potential of CRISPR/Cas9 genome editing to advance immunotherapies.


Figures

Extended Data Figure 1
Extended Data Figure 1. CRISPR/Cas9-mediated CAR gene targeting into the TRAC locus
a, Top, TRAC locus with the 5′ end (grey) of the TRAC first exon, the TRAC gRNA (blue) and the corresponding PAM sequence (red). The two blue arrows indicate the predicted Cas9 double strand break. Bottom, CRISPR/Cas9-targeted integration into the TRAC locus. The targeting construct (AAV) contains a splice acceptor (SA), followed by a P2A coding sequence, the 1928z CAR gene and a polyA sequence, flanked by sequences homologous to the TRAC locus (LHA and RHA, left and right homology arm). Once integrated, the endogenous TCRα promoter drives CAR expression, while the TRAC locus is disrupted. TRAV, TCRα variable region; TRAJ, TCRα joining region; 2A, the self-cleaving Porcine teschovirus 2A sequence. pA: bovine growth hormone polyA sequence. b, Timeline of the CAR targeting into primary T cells. c, Representative TCR/CAR flow plots 4 days after transfection of T cells with Cas9 mRNA and TRAC gRNA and addition of AAV6 at the indicated multiplicity of infection. d, Percentage of TCR disruption 4 days post transfection of the Cas9 mRNA and the TRAC gRNA measured by FACS analysis of the TCR expression (n =5). e, Percentage of knock-in depending on the AAV6 multiplicity of infection measured by FACS analysis of the CAR expression (n =4). f, Percentage of CAR+ cells in the TCR-negative population (n =4). g, Percentage of TCR-positive and TCR-negative in the CAR+ population analysed by FACS (n =4).
Extended Data Figure 2
Extended Data Figure 2. Whole-genome mapping of the AAV6 TRAC-1928z integration using the TLA technology
a, Schematic representation of the TLA technology. For this study, two sets of primers targeting the CAR and the left homology arm have been used. b, TCR/CAR FACS plot of the TRAC-1928z CAR T cells used for the TLA analysis. CAR T cells have been processed as in Extended Data Fig. 1b and expanded for 2 weeks. c, TLA sequence coverage across the human genome using 1928z CAR specific primers (CD28-specific forward: 5′-ACAATGAGAAGAGCAATGGA-3′ and scFV-specific reverse: 5′-GAGATTGTCCTGGTTTCTGT-3′). The chromosomes are indicated on the y axis, the chromosomal position on the x axis. TRAC-encoded CAR T cells were produced as in Fig. 1 and expanded for 10 days before processed for analysis. The primer set was used in an individual TLA amplification. PCR products were purified and library prepped using the Illumina NexteraXT protocol and sequenced on an Illumina Miseq sequencer. Reads were mapped using BWA-SW, which is a Smith–Waterman alignment tool. This allows partial mapping, which is optimally suited for identifying break-spanning reads. The human genome version hg19 was used for mapping. d, TLA sequence coverage aligned on the AAV-TRAC-1928z sequence (Targeting sequence flanked by ITRs). The grey vertical bars on top represent the coverage at the shown positions. The coverage showed integration of the AAV ITRs in fraction of reads. The coverage comparison between ITR and CAR integration at the 5′ and 3′ ends of the TRAC homology arms locus allow the measurement of faithful and unfaithful homologous recombination shown in e. e, Final results from the TLA analysis.
Extended Data Figure 3
Extended Data Figure 3. In vitro cytotoxicity activity and proliferation response of TRAC-CAR T cells
a, Representative flow cytometry analysis showing CAR and TCR expression. TRAC-1928z CAR T cells were generated as in Fig. 1b; CRISPR/Cas9-generated TCR T cells were transduced with RV-1928z retroviral vector; TCR+ cells were transduced with either RV-1928z or RV-P28z (PSMA-specific CAR). TCR-negative T-cell purification was performed using magnetic beads on column. b, Cytotoxic activity using an 18 h bioluminescence assay, using firefly luciferase (FFL)-expressing NALM-6 as targets cells (n =3 independent experiments on 3 healthy donors). c, Representative cumulative cell counts of CAR T cells upon weekly stimulation with CD19+ target cells. Arrows indicate stimulation time points (n = 3 independent experiments on 3 healthy donors).
Extended Data Figure 4
Extended Data Figure 4. TRAC-CAR T cells outperform conventional CAR T cells in vivo
a, NALM-6-bearing mice were treated with 2 × 10⁵ (left), 1 × 10⁵ (middle) or 5 × 10⁴ (right) CAR T cells. Tumour burden was quantified weekly over a 100-day period using BLI. Quantification is the average photon count of ventral and dorsal acquisitions per animal at all given time points. Each line represents one mouse. Some groups are pooled from two to three independent experiments from different healthy donors, representing n = 6–20 mice per group. Lower, Kaplan–Meier analysis of survival of mice. b–f, NALM-6-bearing mice were treated with 1 × 10⁵ indicated CAR T cells. At 10 and 17 days after CAR T-cell infusion, 7 mice per group were euthanized and bone marrow cells were collected. CAR T cells and NALM-6 cells were analysed and counted with flow cytometry. b, Representative FACS analysis of tumour cells (CD19+GFP+) in the bone marrow at day 17. c, Representative FACS analysis of exhaustion markers PD1 and TIM3 in bone marrow CAR T cells at day 17. d, Representative FACS analysis of exhaustion markers PD1 and LAG3 in bone marrow CAR T cells at day 17. e, CAR MFI of the CAR+ cells in the bone marrow (each dot represents one mouse). f, Coefficient of variation measuring the dispersion in the CAR expression of the CAR+ population (ratio of the standard deviation to the mean; each dot represents one mouse). g, RV-1928z CAR design allows the co-expression of the CAR and LNGFR from the same LTR promoter by using a self-cleaving P2A sequence. LTR, long terminal repeat, SD, splice donor site; SA, splice acceptor site; 2A, Porcine teschovirus self-cleaving 2A sequence. h, Representative flow cytometry plots of RV-1928z transduced T cells cultured in vitro or in vivo (extracted from bone marrow) and labelled to detect CAR and LNGFR expression. i, Comparison between CAR MFI in the RV-1928z T cells and the tumour burden (NALM-6 count) in the bone marrow.
Extended Data Figure 5
Extended Data Figure 5. TRAC-19BBz CAR T cells outperform conventional 19BBz CAR T cells by preventing exhaustion in vivo
a, b, These results compiled the average CAR MFI (a) and coefficient of variation (b) of CAR+ T cells obtained from three independent transfections or transductions. The T cells used for these three experiments have been isolated from blood of three different healthy donors. c, Left, activation, memory, and exhaustion markers of CAR T cells analysed by flow cytometry 5 days after gene transfer. Left, plots indicate the phenotypes of the CAR+ T cells measured by flow cytometry analysis of CD62L and CD45RA expression 5 days after CAR vectorization; colours as in e. d, Relative CAR MFI (1 = MFI at 0 h) after CAR T cells being activated 1, 2 or 4 times on CD19+ target cells over a 48 h periods (n = 3 independent experiments, arrows indicate stimulation time points). e, CAR T cells stimulated on CD19+ target cells either 1, 2 or 4 times in 48 h period were analysed by flow cytometry. Plots indicate the phenotypes of the CAR+ T cells measured by flow cytometry analysis of CD62L and CD45RA expression (average proportion from 3 independent experiments). f, FFL-NALM-6-bearing mice were treated with 1 × 10⁵ CAR T cells. Tumour burden shown as bioluminescent signal quantified per animal every week over a 21-day period. n = 6 mice per group. g–j, NALM-6-bearing mice were treated with 1 × 10⁵ CAR T cells. At 10 and 17 days after CAR T-cell infusion, 7 mice per group were euthanized and bone marrow cells were collected. CAR T cells and NALM-6 cells were analysed and counted with flow cytometry. Each dot represents one mouse. g, CAR T cells count in marrow (n =7). h, Tumour (CD19+GFP+ NALM-6) cells count in bone marrow (n =7). i, Effector/tumour ratio in the bone marrow (n =7). j, Exhaustion marker analysis from bone marrow T cells collected at day 17 and analysed by flow cytometry. Represented as the average percentage of cells expressing the indicated markers (n =7). *P <0.05, **P <0.01, ***P < 0.001 (Mann–Whitney test (a, b) ANOVA F-test (d); see Supplementary information)
Extended Data Figure 6
Extended Data Figure 6. TRAC-CAR T cells show reduced tonic signalling and antigen-induced differentiation in vitro
a, Representative FACS analysis of T cells differentiation markers 5 days after the CAR gene transfer. b, Representative FACS analysis of the CAR T cell differentiation markers after 1, 2 or 4 stimulations on CD19+ target cells. c, CAR T cells expansion when stimulated 1, 2 or 4 times on CD19+ target cells over a 48 h period. No noticeable difference in the proliferation was found between the three 1928z CAR T cells conditions. d, Percentage of CAR T cells with positive expression of IFNγ, TNFα or IL-2 after intracellular staining at the end of the protocol in Fig. 2d (n =2 independent experiments on 2 donors).
Extended Data Figure 7
Extended Data Figure 7. TRAC-CAR T cells show delayed in vitro antigen-induced differentiantion compared to lowly or highly transduced RV-CAR T cells
a, Representative histogram of the CAR expression 5 days after transduction of different volume of retroviral supernatant in μl (representative of 3 independent experiments; total transduction volume 2 ml). b, Percentage of CAR+ T cells in function of the volume of retroviral supernatant analysed by FACS 5 days after transduction. (n =3 donors). c. CAR mean fluorescence intensity (MFI) of T cells as a function of the volume of retroviral supernatant analysed by FACS 5 days after transduction (n =3 donors). d, CAR coefficient of variation as a function of the volume of retroviral supernatant analysed by FACS 5 days after transduction (n =3 donors). e, Average CAR MFI of CAR T cells 5 days after transduction (n = 3 donors). High =1,000 μl, and low =30 μl. f, CAR T cells stimulated on CD19+ target cells either 1, 2 or 4 times in 48 h period were analysed by flow cytometry. Plots indicate the phenotypes of the CAR-positive T cells measured by flow cytometry analysis of CD62L and CD45RA expression (average proportion from of 3 independent experiments).
Extended Data Figure 8
Extended Data Figure 8. CAR gene expression using different promoters at distinct loci influences tonic signalling levels in vitro
a, CRISPR/Cas9-targeted integration into the TRAC locus. The targeting construct (AAV) contains a splice acceptor (SA), followed by a P2A coding sequence, the 1928z CAR gene and a polyA sequence, flanked by sequences homologous to the TRAC locus (LHA and RHA, left and right homology arm). Once integrated, the endogenous TCRα promoter drives CAR expression, while the TRAC locus is disrupted. TRAV, TCRα variable region; TRAJ, TCRα joining region; 2A, the self-cleaving Porcine teschovirus 2A sequence. b, CRISPR/Cas9-targeted promoter integration into the TRAC locus. The targeting construct (AAV) contains the 1928z CAR coding sequence in the reverse orientation, under the control of an exogenous promoter, the long version of human EF1α, the enhancer sequence from the gamma retrovirus used in Figs 1, 2 (Mo-MLV LTR here called LTR) or the phosphoglycerate kinase (PGK) promoter and a polyA sequence, flanked by sequences homologous to the TRAC locus (LHA and RHA, left and right homology arm). c, Schematic of tailored CRISPR/Cas9-induced targeted integration into the B2M locus. The targeting construct (AAV) contains the CAR gene flanked by homology sequences (LHA and RHA). Once integrated, the endogenous B2M promoter drives CAR expression. d, CRISPR/Cas9-targeted promoter integration into the B2M locus. The targeting construct (AAV) contains the 1928z CAR gene in the reverse orientation, under the control of an exogenous promoter, human EF1α, the PGK promoter or a truncated version of the PGK (PGK100) and a polyA sequence, flanked by sequences homologous to the B2M locus (LHA and RHA, left and right homology arm). e, Average CAR mean fluorescence intensity (MFI) analysed by FACS 4 days after transduction (n = 3 to 7 independent experiments and 4 different donors). pA: bovine growth hormone polyA sequence for all targeting constructs. f, Left, representative histogram of the CAR expression 5 days after its vectorization into T cells. Middle, activation, memory, and exhaustion markers of CAR T cells analysed by flow cytometry 5 days after the vectorization of the CAR. Right, plots indicate the phenotypes of the CAR+ T cells measured by flow cytometry analysis of CD62L and CD45RA expression 5 days after CAR gene transfer.
Extended Data Figure 9
Extended Data Figure 9. CAR gene expression using different promoters at distinct loci influences antigen-induced differentiation and exhaustion in vivo
a, Representative FACS analysis of the CAR T-cell differentiation markers after 1, 2 or 4 stimulations on CD19+ target cells. b, CAR T-cell expansion when stimulated 1, 2 or 4 times on CD19+ target cells over a 48 h period. No apparent difference in the proliferation was found between the four 1928z CAR T cells conditions. ce, NALM-6-bearing mice were treated with 1 × 10⁵ CAR T cells. At 10 and 17 days after CAR T cell infusion, 7 mice per group were euthanized and bone marrow cells were collected. CAR T cells and NALM-6 cells were analysed and counted with flow cytometry. Each dot represents one mouse. f, Percentage of effector memory (‘Eff mem’, CD62LCD45RA) and effector (‘Eff ’, CD62L CD45RA+) in the bone marrow CAR T cells at day 17 (n =7 mice). g, Exhaustion marker analysis from bone marrow T cells collected at day 17 and analysed by flow cytometry. Represented as the average percentage of cells expressing the indicated markers (n =7 mice).
Extended Data Figure 10
Extended Data Figure 10. Locus-promoter configuration controls CAR protein expression and transcriptional response upon CAR T cell activation
a, Left, representative histogram of the CAR expression 5 days after its vectorization into T cells. Right, relative CAR MFI (1 =MFI at 0 h) after CAR T cells being activated 1, 2 or 4 times on CD19+ target cells over a 48 h period. b, Comparison between CAR MFI and CAR RNA relative level before stimulation (n = 3 independent experiment on 3 donors).
Figure 1
Figure 1. TRAC-CAR T cells outperform conventional CAR T cells by preventing exhaustion in vivo
a, CRISPR/Cas9-targeted CAR gene integration into the TRAC locus. Top, TRAC locus; middle, rAAV6 containing the CAR cassette flanked by homology arms; bottom, edited TRAC locus. b, Representative TCR/CAR flow plots 4 days after TRAC targeting. c, d, CAR mean fluorescence intensity (MFI) (c) and CAR MFI coefficient of variance (d) of CAR+ T cells (n = 12 independent experiments, 6 donors). e, Kaplan–Meier analysis of survival of mice. f–j, NALM-6-bearing mice were treated with 1 × 10⁵ CAR T cells (n = 7 per group; dot = one mouse), and euthanized at days 10 and 17 after infusion; bone marrow CAR T cells and NALM-6 cells were analysed and counted by FACS (colours as in e). f, CAR T cells. g, Tumour (GFP+CD19+) cells. h, CAR T cells to tumour ratio. i, Percentage of effector memory (CD62LCD45RA) and effector (CD62LCD45RA+) in CAR T cells at day 17. j, Percentage of CAR T cells expressing exhaustion markers; quantified by FACS at day 17. *P <0.05, **P <0.01, ***P <0.001, ****P < 0.0001 (Welch’s two samples t-test (c, d); log-rank Mantel–Cox test (e); Mann–Whitney (f–i)). All data are means ± s.d. See also Extended Data Figs 1–4.
Figure 2
Figure 2. TRAC-CAR T cells display reduced constitutive signalling and antigen-induced differentiation
a, FACS analysis of activation, memory and exhaustion markers in T cells (day 5 after infusion; representative of 3 donors; pie chart for CD62L/D45RA expression (n = 3, 3 donors, colours as in d). b, CAR expression and CD3ζ ITAM phosphorylation (representative of 3 donors). RV-19Del, retrovirally expressed CD19-specific CAR lacking signalling domains. c, Phospho-CD3ζ MFI in the CAR+ population (n = 3, 3 donors; **P <0.05 Mann–Whitney test). d, CD62L/CD45RA expression in CAR T cells stimulated 1, 2 or 4 times. Pie charts show the phenotypes of the CAR+ T cells (n =3–5 on different donors). e, Heat map of T-bet, EOMES and GATA3 expression in CAR T cells collected as in d; fold-increase value of 1 represents to TRAC-1928z, 1 stimulation (n = 2, 2 donors). All data are means ± s.d. See also Extended Data Fig. 6.
Figure 3
Figure 3. The endogenous TRAC promoter surpasses other locus/promoter combinations in vivo
a, CRISPR/Cas9-targeted promoter-CAR integration into the TRAC locus. Top, TRAC locus; bottom, rAAV6 containing the promoter-CAR-polyA cassette flanked by homology arms. b, CRISPR/Cas9-targeted promoter-less CAR integration into the B2M locus. Top, B2M locus; bottom, rAAV6 containing a promoter-less CAR cassette flanked by homology arms. c, Representative B2M/CAR or TCR/CAR flow plots 4 days after gene transfer. d, CAR MFI at day 4 (n = 4–7 independent experiments; 4 donors). e, Left, CAR expression (representative histogram) at day 4. Right, FACS analysis of activation, memory, and exhaustion markers of CAR T cells at day 5 (representative of 3 donors). f, CAR T cells stimulated on CD19+ target cells 0, 1, 2 or 4 times. Pie charts show the CD62L/CD45RA phenotypes of CAR+ T cells (n = 3–5 independent experiments on different donors, colours as in Fig. 2d). g, Tumour burden (average radiance) of NALM-6-bearing mice treated with 1 × 10⁵ CAR T cells (n =6; line =one mouse). h, Kaplan–Meier analysis of the mice survival, **P <0.01, ***P <0.001, ****P < 0.0001 (Welch’s two samples t-test (d); log-rank Mantel–Cox test (g) and Mann–Whitney test (hk). All data are means ± s.d. See also Extended Data Figs 8, 9.
Figure 4
Figure 4. TRAC locus affords optimal regulation of cell-surface CAR expression
a, Representative histogram of CAR expression before and after co-culture with CD19+ target cells. b, CRISPR/Cas9-targeted integration of a CAR-GFP fusion gene into TRAC locus. c, Upper, LNGFR/CAR expression of the bicistronic CAR-P2A-LNGFR CAR T cells before and after co-culture with CD19+ target cells. Lower, GFP/CAR expression of CAR–GFP fusion targeted into the TRAC locus or randomly integrated with the RV vector (representative of 3 independent experiments on 3 donors). d, Left, representative histogram of the CAR expression 5 days after gene transfer. Right, relative CAR MFI (1 = MFI at 0 h) of CAR T cells after 1, 2 or 4 stimulations (indicated by arrows; n =3–7 independent experiments on different donors). e, Relative CAR RNA levels (1 =TRAC RNA level) 5 days after gene transfer. f, Time-course analysis of CAR RNA levels (1 = RNA level at 0 h) in CAR T cells stimulated once on CD19+ target cells (n = 3 independent experiments on 3 donors; CAR T cells as in d). All data are means ±s.d. *P <0.05, **P <0.01, ***P <0.001 (ANOVA F-test with Bonferroni correction (d; see Supplementary Information), and Mann–Whitney test (e)). See also Extended Data Fig. 10.

Comment in

References

    1. Jensen MC, Riddell SR. Designing chimeric antigen receptors to effectively and safely target tumors. Curr Opin Immunol. 2015;33:9–15. - PMC - PubMed
    1. Brentjens RJ, et al. Eradication of systemic B-cell tumors by genetically targeted human T lymphocytes co-stimulated by CD80 and interleukin-15. Nat Med. 2003;9:279–286. - PubMed
    1. Sadelain M. CAR therapy: the CD19 paradigm. J Clin Invest. 2015;125:3392–3400. - PMC - PubMed
    1. Sadelain M, Mulligan RC. Efficient retroviral-mediated gene transfer into murine primary lymphocytes. Ninth International Immunology Congress; Budapest. 1992. p. 34.
    1. Wang X, Rivière I. Clinical manufacturing of CAR T cells: foundation of a promising therapy. Mol Ther Oncolytics. 2016;3:16015. - PMC - PubMed

Publication types

MeSH terms

Substances