. 2017 Mar 2;543(7643):78-82.
doi: 10.1038/nature21427. Epub 2017 Feb 22.

Elucidation of the biosynthesis of the methane catalyst coenzyme F430

Affiliations

Elucidation of the biosynthesis of the methane catalyst coenzyme F430

Simon J Moore et al. Nature. .

Erratum in

Abstract

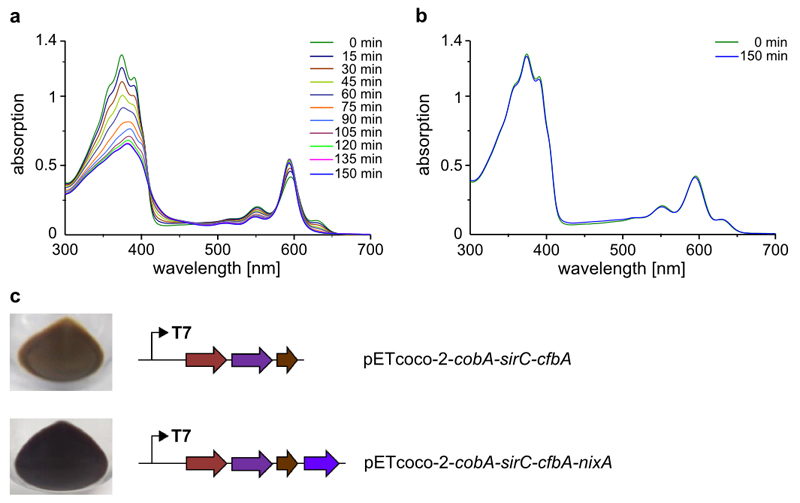
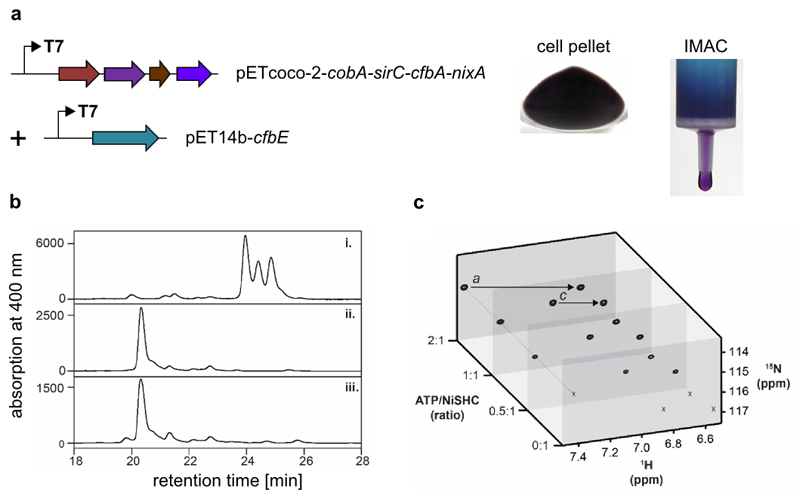
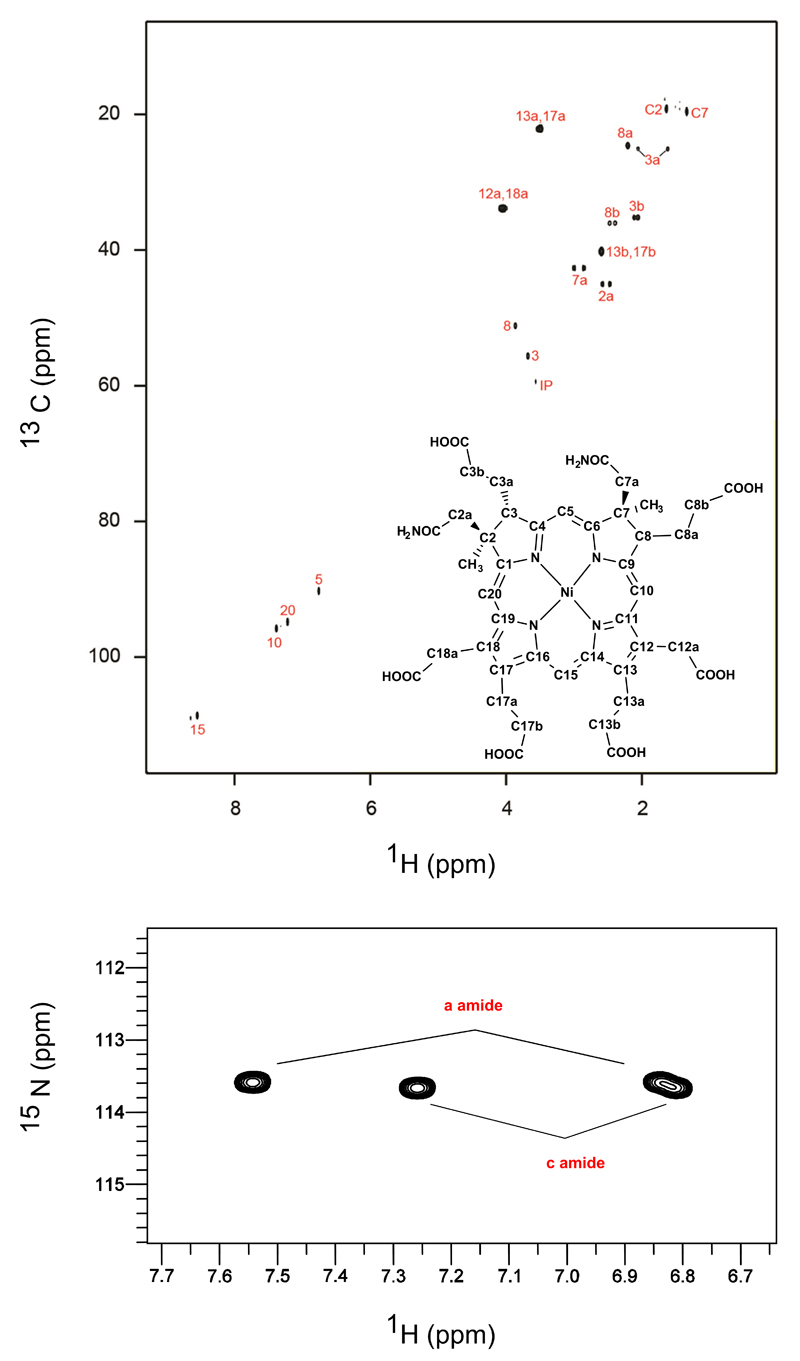
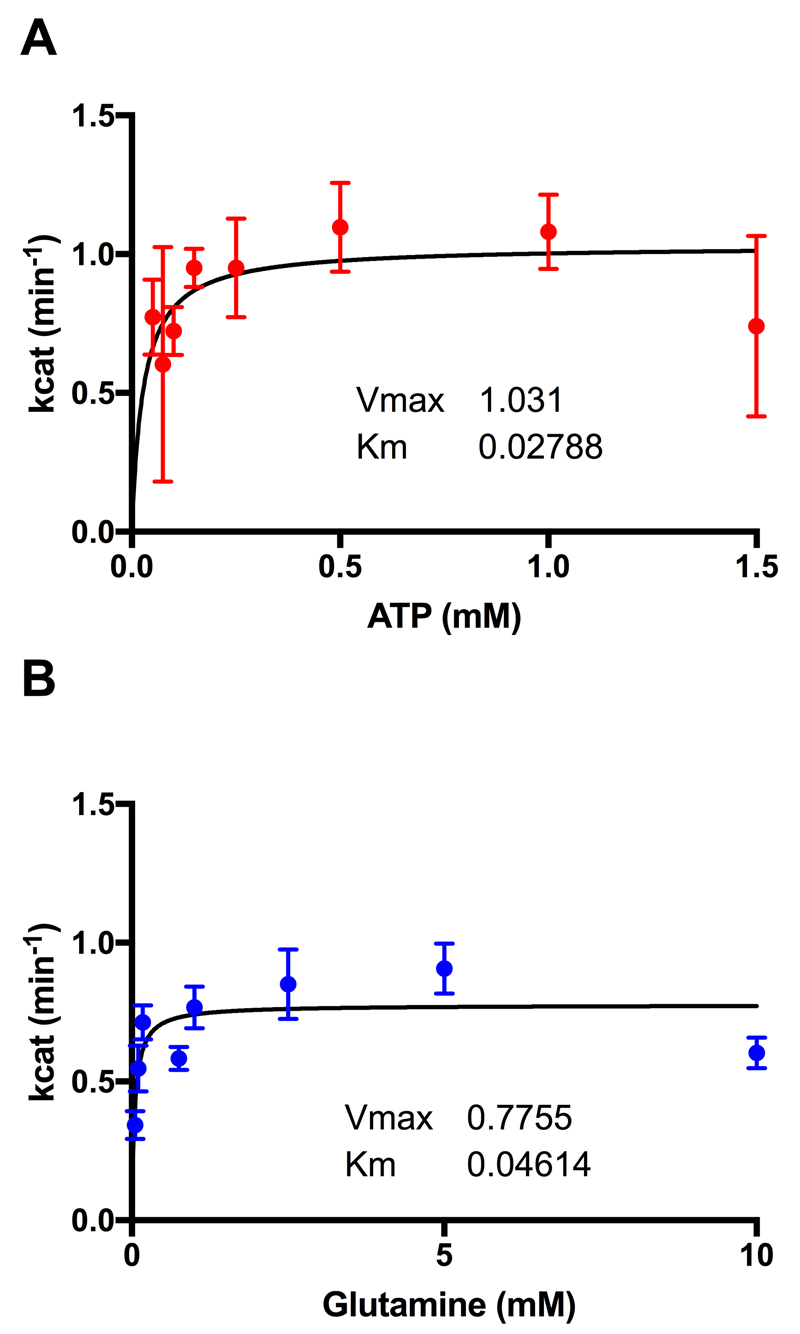
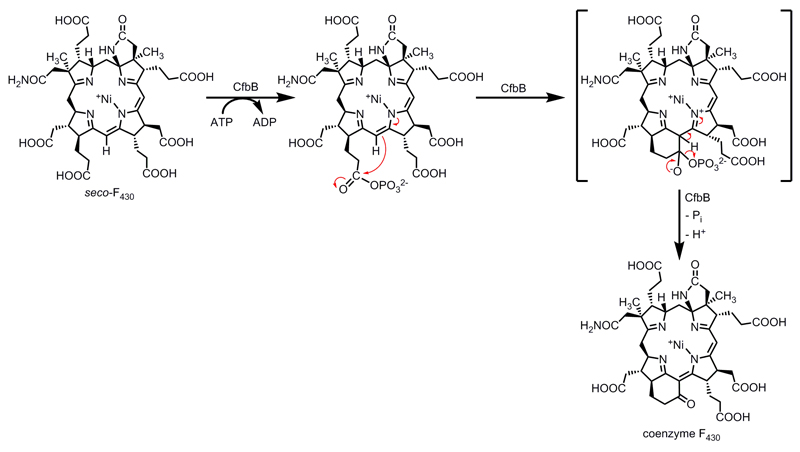
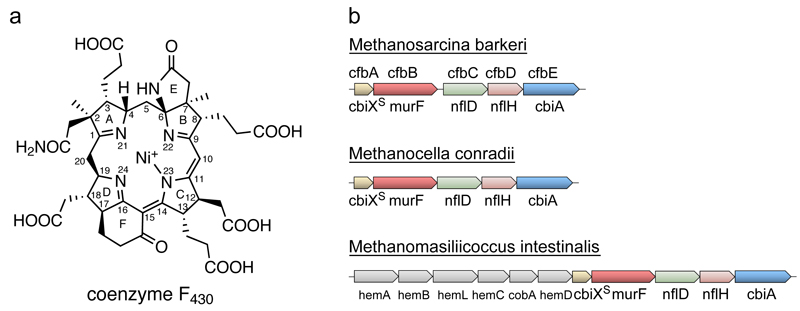
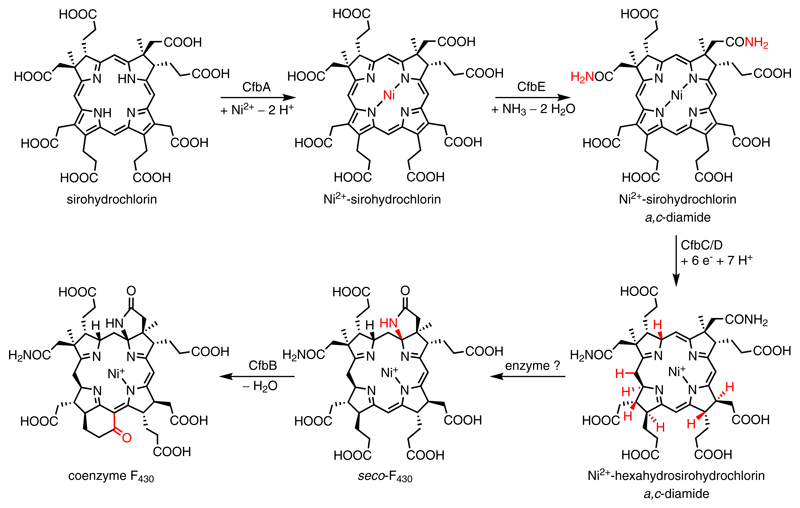
Methane biogenesis in methanogens is mediated by methyl-coenzyme M reductase, an enzyme that is also responsible for the utilization of methane through anaerobic methane oxidation. The enzyme uses an ancillary factor called coenzyme F430, a nickel-containing modified tetrapyrrole that promotes catalysis through a methyl radical/Ni(ii)-thiolate intermediate. However, it is unclear how coenzyme F430 is synthesized from the common primogenitor uroporphyrinogen iii, incorporating 11 steric centres into the macrocycle, although the pathway must involve chelation, amidation, macrocyclic ring reduction, lactamization and carbocyclic ring formation. Here we identify the proteins that catalyse the biosynthesis of coenzyme F430 from sirohydrochlorin, termed CfbA-CfbE, and demonstrate their activity. The research completes our understanding of how the repertoire of tetrapyrrole-based pigments are constructed, permitting the development of recombinant systems to use these metalloprosthetic groups more widely.


Conflict of interest statement

The authors have no competing financial interests with this research.

Figures

Extended Data Figure 1
Extended Data Figure 1. Nickel chelatase activity of CfbA.
(A) and (B) In vitro activity assay of CfbA. Purified CfbA was incubated with sirohydrochlorin and NiSO4 at 37°C (A). The insertion of nickel was monitored by UV/Vis absorption spectroscopy every 15 min. When CfbA was omitted from the assay mixture (B), no nickel insertion was observed. (C) In vivo activity of CfbA. Cell pellets of E. coli cells transformed with either pETcoco-2-cobA-sirC-cfbA or pETcoco-2-cobA-sirC-cfbA-nixA grown in the presence of nickel.
Extended Data Figure 2
Extended Data Figure 2. Amidotransferase activity of CfbE.
(A) In vivo activity of CfbE. E. coli cells transformed with pETcoco-2-cobA-sirC-cfbA-nixA and pET14b-cfbE and grown in the presence of nickel produce a dark violet pigment that co-purifies with CfbE during IMAC. (B) and (C) 15N labelling of nickel-sirohydrochlorin a,c-diamide. (B) Reverse-phase HPLC chromatogram of (i) nickel-sirohydrochlorin substrate, m/z = 919; (ii) unlabelled nickel-sirohydrochlorin a,c-diamide, m/z = 917; (iii) 15N labelled nickel-sirohydrochlorin a,c-diamide, m/z = 919. (C) 15N 1H HSQC of an ATP limited titration with nickel-sirohydrochlorin, CfbE and 15NH3. The a and c amide groups increase proportionally in intensity as the level of ATP increases.
Extended Data Figure 3
Extended Data Figure 3. NMR characterisation of Ni2+-sirohydrochlorin a,c-diamide.
1H-13C HSQC (A) and 1H-15N HSQC (B) of 4 mM Ni2+-sirohydrochlorin a,c-diamide in D2O.
Extended Data Figure 4
Extended Data Figure 4. Steady-state kinetics of the M. barkeri CfbE amidotransferase with glutamine or ATP as a variable.
(A) 1 mM glutamine with ATP varied between 0.05 – 1.5 mM ATP. (B) 0.5 mM ATP with glutamine varied between 0.05 – 10 mM. Fixed conditions: Buffer B, 20°C, 2.5 μM M. barkeri CfbE, 25 μM nickel-sirohydrochlorin, 5 mM MgCl2. The mean values and error bars were calculated from 3 technical repeats.
Extended Data Figure 5
Extended Data Figure 5. Characterization of the CfbC/D assay reaction products by mass spectrometry after HPLC separation.
(A) Mass spectrum with the isotopic pattern of the reaction product after 1.5 h of incubation measured in positive ion mode. (B) Mass spectrum with the isotopic pattern of the reaction product after 22 h of incubation measured in positive ion mode.
Extended Data Figure 6
Extended Data Figure 6. NMR characterization of seco-F430.
1H-13C HSQC (A) and 1H-15N HSQC (B) of 4 mM seco-F430 in D2O.
Extended Data Figure 7
Extended Data Figure 7. Characterization of the CfbB assay reaction products.
(A) UV/Vis absorption spectrum of an F430 standard in 0.01 % formic acid / acetonitrile. (B) CfbB assay with Ni2+-hexahydrosirohydrochlorin a,c-diamide as the substrate. Mass spectrum with the isotopic pattern of the reaction product after 2 h of incubation measured in positive ion mode after HPLC separation. (C) CfbB assay with seco-F430 as the substrate. Mass spectrum with the isotopic pattern of the reaction product after 22 h of incubation measured in positive ion mode after HPLC separation.
Extended Data Figure 8
Extended Data Figure 8. NMR characterisation of F430 synthesised by CfbB.
1H-13C HSQC and 1H-15N HSQC of F430 in TFE-d3.
Extended Data Figure 9
Extended Data Figure 9. Proposed mechanism for the reaction catalyzed by CfbB.
Initially, CfbB promotes the ATP-dependent phosphorylation of the propionic acid side chain on ring D of seco-F430. This activated side chain is then able to undergo cyclisation to form ring F and thereby generate coenzyme F430.
Figure 1
Figure 1. Coenzyme F430 and biosynthesis gene clusters in methanogens.
(A) Coenzyme F430 structure showing the numbering of the pyrrole rings A-D, lactam ring E and cyclohexanone ring F, and the C- and N-atoms. (B) Coenzyme F430 biosynthesis (cfb) gene clusters identified in this study. Homologous genes are shown in the same colour. Gene designations below the arrows represent the original annotation. The genes are: M. barkeri: cfbA (Mbar_A0344), cfbB (Mbar_A0345), cfbC (Mbar_A0346), cfbD (Mbar_A0347), cfbE (Mbar_A0348); M. conradii: cfbA (MTC_0061), cfbB (MTC_0062), cfbC (MTC_0063), cfbD (MTC_0064), cfbE (MTC_0065); M. intestinalis: cfbA (H729_08045), cfbB (H729_08040), cfbC (H729_08035), cfbD (H729_08030), cfbE (H729_08025).
Figure 2
Figure 2. EPR characterization of CfbC/D.
X band continuous wave EPR spectra of dithionite reduced proteins: (i), CfbC: (ii), CfbD: (iii), CfbD plus excess MgADP: (iv), CfbD plus excess MgATP. ii – iv have the same vertical scale, protein concentration and dithionite concentration. (v), CfbC: (vi), CfbD: (vii), one-to-one mixture of CfbC and CfbD: (viii), one-to-one mixture of CfbC and CfbD plus excess MgATP. v-viii have the same vertical scale, protein concentration and dithionite concentration. Experimental parameters: microwave power 0.5 mW, field modulation amplitude 7 G, temperature 15 K.
Figure 3
Figure 3. Enzymatic activity of CfbC/D.
(A) Left, UV/Vis absorption spectra of the conversion of Ni2+-sirohydrochlorin a,c-diamide (green line) to Ni2+-hexahydrosirohydrochlorin a,c-diamide (blue line) catalysed by CfbC/D during 1.5 h and autocatalytic formation of the lactam ring E yielding seco-F430 (pink and red lines) during 14-22 h of incubation. Right, UV/Vis absorption spectra of the control reaction lacking CfbC. (B) HPLC analysis (left) of the reaction products from (A) after 1.5 and 22 h of incubation with diode-array detection (right). Characteristic absorption features of the reaction products are indicated.
Figure 4
Figure 4. Enzymatic activity of CfbB.
(A) UV/Vis absorption spectra (after HPLC separation) of the substrate Ni2+-hexahydrosirohydrochlorin a,c-diamide (blue line) and the reaction product observed after incubation with CfbB and ATP for 2 h (pink line). (B) UV/Vis absorption spectra (after HPLC separation) of the substrate seco-F430 (red line) and the reaction product observed after incubation with CfbB and ATP for 1 h (orange line).
Figure 5
Figure 5. Biosynthesis of coenzyme F430 from sirohydrochlorin.
The overall series of reactions required for the transformation of sirohydrochlorin into coenzyme F430. There are four enzymatic steps, requiring CfbA, E, C/D and B, as well as one spontaneous process (in vitro), which might be enzyme-catalysed in vivo. The formal chemical changes for each step are given below the arrows not reflecting required cofactors or enzymatic mechanisms. The introduced structural changes are highlighted in red.

Comment in

References

    1. Ragsdale SW. Biochemistry of methyl-coenzyme M reductase: the nickel metalloenzyme that catalyzes the final step in synthesis and the first step in anaerobic oxidation of the greenhouse gas methane. Met Ions Life Sci. 2014;14:125–145. - PubMed
    1. Thauer RK. Biochemistry of methanogenesis: a tribute to Marjory Stephenson. 1998 Marjory Stephenson Prize Lecture. Microbiology. 1998;144:2377–2406. - PubMed
    1. Raghoebarsing AA, et al. A microbial consortium couples anaerobic methane oxidation to denitrification. Nature. 2006;440:918–921. - PubMed
    1. Scheller S, Goenrich M, Boecher R, Thauer RK, Jaun B. The key nickel enzyme of methanogenesis catalyses the anaerobic oxidation of methane. Nature. 2010;465:606–608. - PubMed
    1. Shima S, et al. Structure of a methyl-coenzyme M reductase from Black Sea mats that oxidize methane anaerobically. Nature. 2012;481:98–101. - PubMed

Publication types

MeSH terms

LinkOut - more resources