

A new explanation for unexpected evolution in body size
- PMID: 28225765
- PMCID: PMC5321426
- DOI: 10.1371/journal.pbio.2001832
A new explanation for unexpected evolution in body size
Abstract
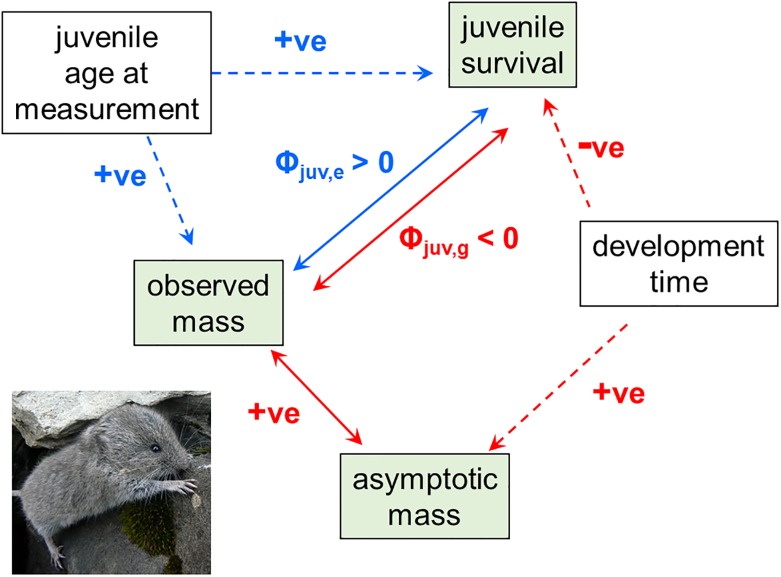
Bigger is apparently frequently fitter, and body size is typically heritable, so why don't animals in wild populations evolve towards larger sizes? Different explanations have been proposed for this apparent "paradox of stasis." A new study of snow voles in the Swiss Alps finds higher survival in animals with larger body mass and heritability of body mass, but, surprisingly, a genetic decline in body mass is also indicated. The authors suggest a novel explanation for this observation: the appearance of positive phenotypic selection is driven by a confounding variable of the age at which a juvenile is measured, whereas the evolutionarily relevant selection actually acts negatively on mass via its association with development time. Thus, genes for larger mass are not actually "fitter" because they are associated with longer development times, and juvenile snow voles with longer development times run the risk of not completing development before the first winter snow. However, the genetic decline in body size is not apparent at the phenotypic level, presumably because of countervailing trends in environmental effects on the phenotype.
Conflict of interest statement
The authors have declared that no competing interests exist.
Figures
Comment on
-
Bigger Is Fitter? Quantitative Genetic Decomposition of Selection Reveals an Adaptive Evolutionary Decline of Body Mass in a Wild Rodent Population.PLoS Biol. 2017 Jan 26;15(1):e1002592. doi: 10.1371/journal.pbio.1002592. eCollection 2017 Jan. PLoS Biol. 2017. PMID: 28125583 Free PMC article.
Similar articles
-
Bigger Is Fitter? Quantitative Genetic Decomposition of Selection Reveals an Adaptive Evolutionary Decline of Body Mass in a Wild Rodent Population.PLoS Biol. 2017 Jan 26;15(1):e1002592. doi: 10.1371/journal.pbio.1002592. eCollection 2017 Jan. PLoS Biol. 2017. PMID: 28125583 Free PMC article.
-
Selection on heritable seasonal phenotypic plasticity of body mass.Evolution. 2007 Aug;61(8):1969-79. doi: 10.1111/j.1558-5646.2007.00160.x. Evolution. 2007. PMID: 17683438
-
Phenotypic evolution of dispersal-enhancing traits in insular voles.Proc Biol Sci. 2011 Jan 22;278(1703):225-32. doi: 10.1098/rspb.2010.1325. Epub 2010 Aug 4. Proc Biol Sci. 2011. PMID: 20685710 Free PMC article.
-
Does rapid evolution matter? Measuring the rate of contemporary evolution and its impacts on ecological dynamics.Ecol Lett. 2011 Jun;14(6):603-14. doi: 10.1111/j.1461-0248.2011.01616.x. Epub 2011 Apr 24. Ecol Lett. 2011. PMID: 21518209 Review.
-
Contemporary evolution during invasion: evidence for differentiation, natural selection, and local adaptation.Mol Ecol. 2015 May;24(9):1999-2017. doi: 10.1111/mec.13162. Epub 2015 Apr 20. Mol Ecol. 2015. PMID: 25891044 Review.
Cited by
-
Balancing selection via life-history trade-offs maintains an inversion polymorphism in a seaweed fly.Nat Commun. 2020 Feb 3;11(1):670. doi: 10.1038/s41467-020-14479-7. Nat Commun. 2020. PMID: 32015341 Free PMC article.
-
Sex Ratio, Sexual Dimorphism, and Wing Geometric Morphometrics in Species of Trypoxylon Latreille, 1796 (Hymenoptera: Crabronidae).Neotrop Entomol. 2023 Dec;52(6):1005-1017. doi: 10.1007/s13744-023-01080-y. Epub 2023 Sep 28. Neotrop Entomol. 2023. PMID: 37768508
-
Genome data uncover four synergistic key regulators for extremely small body size in horses.BMC Genomics. 2018 Jun 25;19(1):492. doi: 10.1186/s12864-018-4877-5. BMC Genomics. 2018. PMID: 29940849 Free PMC article.
References
-
- Merilä J, Sheldon BC, Kruuk LEB (2001) Explaining stasis: microevolutionary studies of natural populations. Genetica 112: 119–222. - PubMed
-
- Falconer DS, Mackay TFC (1996) Introduction to Quantitative Genetics. Essex: Longman.
-
- Morrissey MB, Kruuk LEB, Wilson AJ (2010) The danger of applying the breeder's equation in observational studies of natural populations. J Evolutionary Biology 23: 2277–2288. - PubMed
Publication types
MeSH terms
LinkOut - more resources
Full Text Sources
Other Literature Sources
