. 2017 Feb 22;12(2):e0171508.
doi: 10.1371/journal.pone.0171508. eCollection 2017.

A distal intergenic region controls pancreatic endocrine differentiation by acting as a transcriptional enhancer and as a polycomb response element

Affiliations

A distal intergenic region controls pancreatic endocrine differentiation by acting as a transcriptional enhancer and as a polycomb response element

Joris van Arensbergen et al. PLoS One. .

Abstract

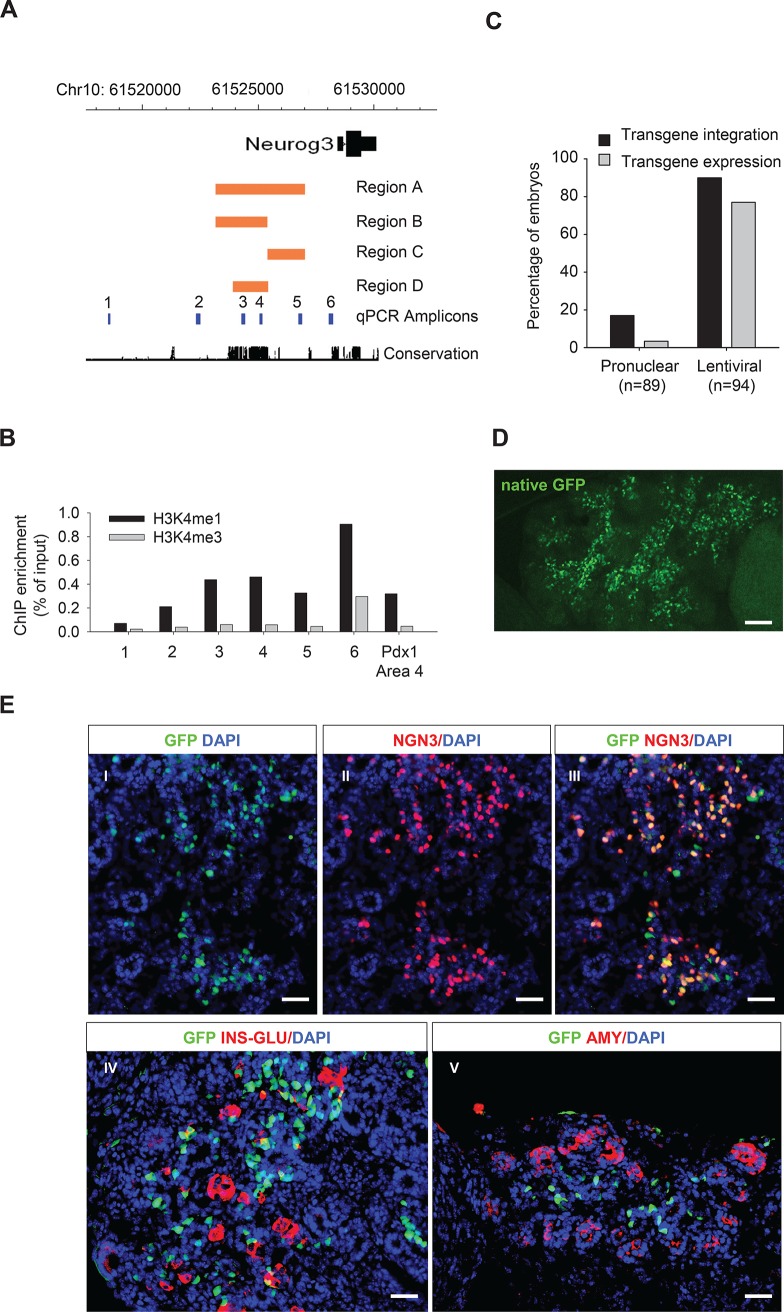
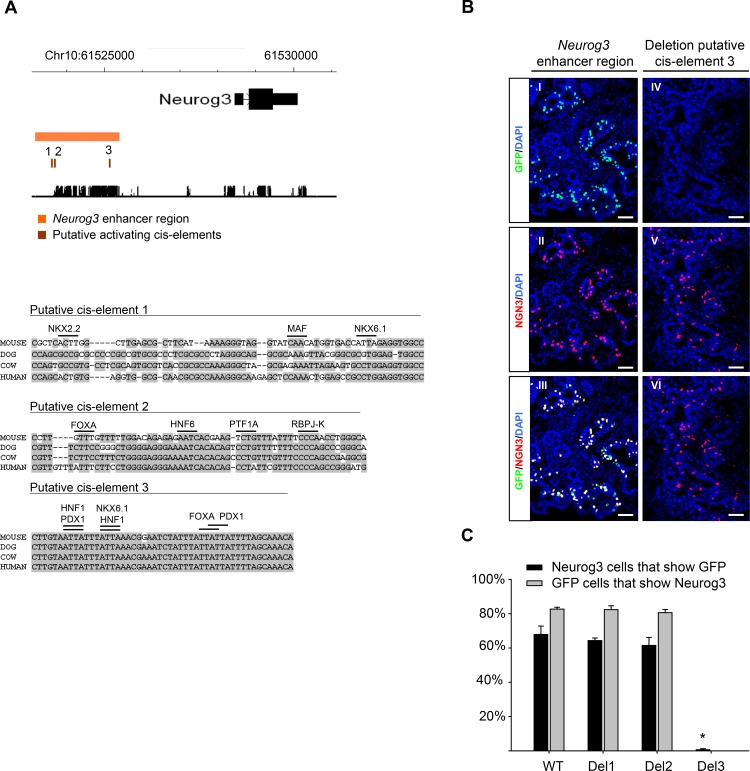
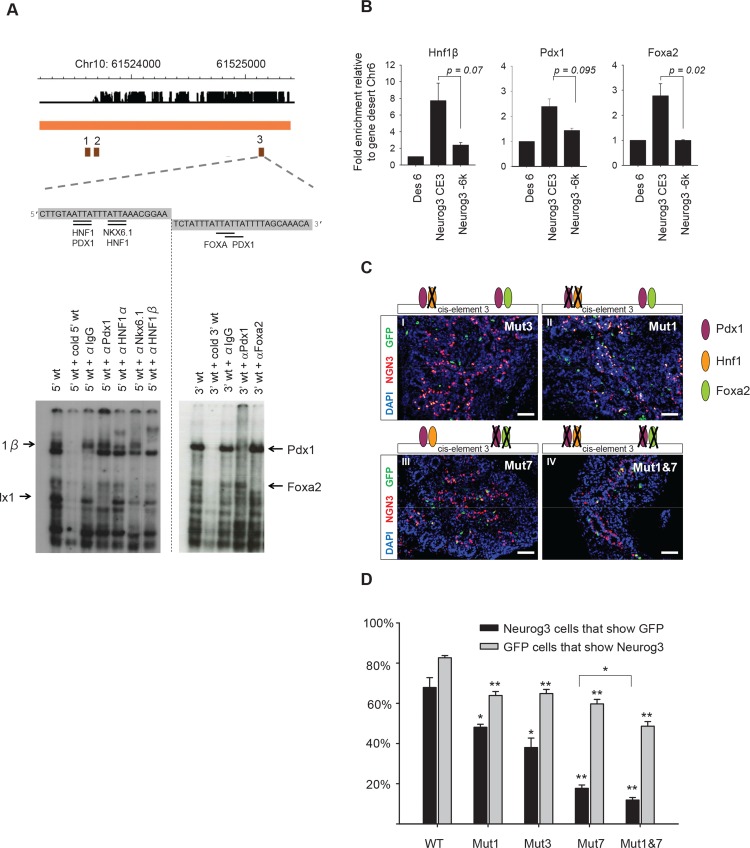
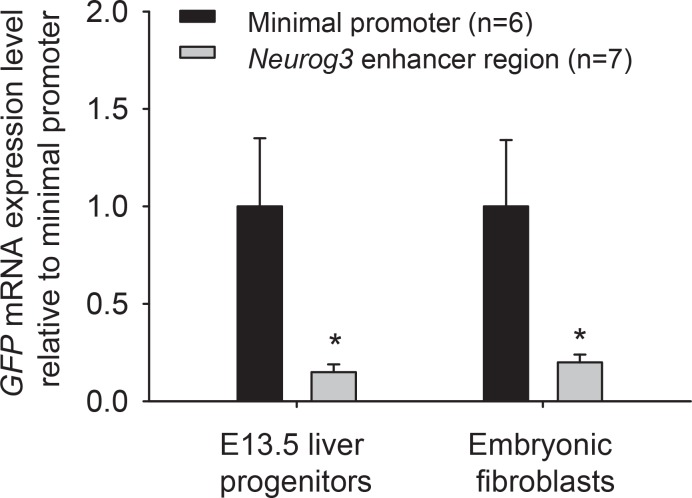
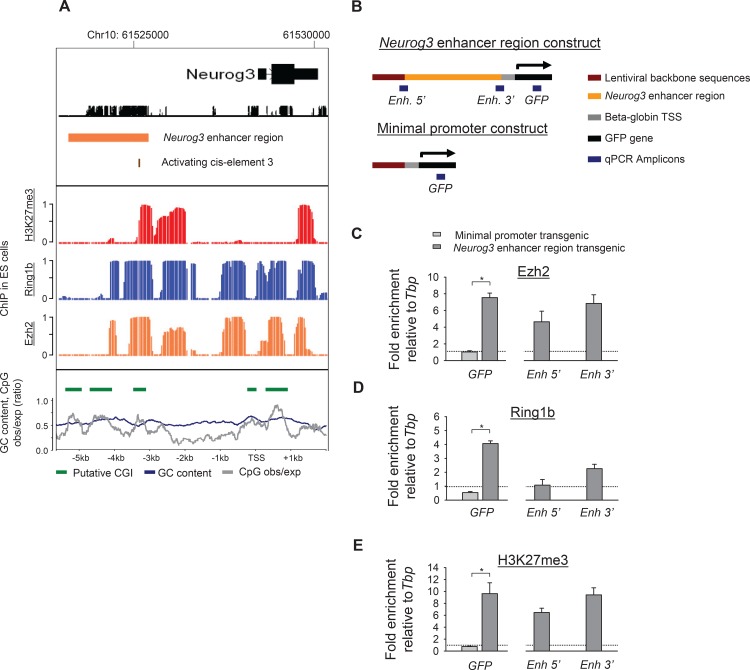
Lineage-selective expression of developmental genes is dependent on the interplay between activating and repressive mechanisms. Gene activation is dependent on cell-specific transcription factors that recognize transcriptional enhancer sequences. Gene repression often depends on the recruitment of Polycomb group (PcG) proteins, although the sequences that underlie the recruitment of PcG proteins, also known as Polycomb response elements (PREs), remain poorly understood in vertebrates. While distal PREs have been identified in mammals, a role for positive-acting enhancers in PcG-mediated repression has not been described. Here we have used a highly efficient procedure based on lentiviral-mediated transgenesis to carry out in vivo fine-mapping of, cis-regulatory sequences that control lineage-specific activation of Neurog3, a master regulator of pancreatic endocrine differentiation. Our findings reveal an enhancer region that is sufficient to drive correct spacio-temporal expression of Neurog3 and demonstrate that this same region serves as a PRE in alternative lineages where Neurog3 is inactive.


Conflict of interest statement

Competing Interests: The authors have declared that no competing interests exist.

Figures

Fig 1
Fig 1. Mapping a Neurog3 enhancer region through highly efficient lentiviral transgenesis.
A. Schematic representation of the screened Neurog3 locus. Orange bars depict regions A-D that were selected for characterization through standard transgenesis. PCR amplicons that were used for ChIP analysis (in B) are shown in blue. The conservation track represents conservation over 17 vertebrate species. B. ChIP revealed H3K4me1 without H3K4me3 enrichment in E13.5 pancreatic buds in putative Neurog3 enhancer regions (n = 1; note that the H3K4me3 signal results from Neurog3+ cells which represent <5% of the pancreatic bud). Pdx1 Area 4 is shown as a positive control as it represents a known enhancer. C. Lentiviral integration increases the efficiency of transgenesis and transgene expression compared with standard pronuclear injections. D, E. Expression of GFP under the control of the Neurog3 enhancer region B in lentiviral transgenics. Native GFP in a whole mount follows the trunk of E14.5 pancreas (D) and coincides with endogenous Neurog3 in (E, panel I-III), whereas no overlap is seen with Amylase (red; panel V) and only rare overlap is seen with Insulin and Glucagon (panel IV). Occasional GFP-positive Neurog3-negative cells were found at E14.5, most of which belonged to the endocrine lineage (panel III, IV). Scale bars are 75 μm (D) and 50μm (E).
Fig 2
Fig 2. An essential activating cis-element within the Neurog3 enhancer region.
A. Three elements in the Neurog3 enhancer displayed clustered binding motifs for known pancreatic transcription factors. Black lines above sequence indicate 4 bp core of transcription factor motif. B. Deletion of cis-element 3 (Del3; but not 1 or 2) from the Neurog3 enhancer region leads to a near complete loss of expression. The panels show GFP (green) and Neurog3 (red) in an E14.5 transgenic for the wild-type Neurog3 enhancer region (panel I-III) and a transgenic for the Neurog3 enhancer region with activating cis-element 3 deleted (panel IV-VI). C. Quantification of percentage of Neurog3 cells that are GFP positive (black bars) and the percentage of GFP cells that are Neurog3 positive (grey bars; not present for Del3 because in 7 out of 8 embryo’s no GFP cells were detected. Quantification was done on 8 embryos for each genotype in which slides amounting to at least 1000 Neurog3 cells were counted ([*] P = 5.3 x 10⁻⁹, Student’s t-test with Bonferroni correction). Scale bars: I-VI = 50 μm.
Fig 3
Fig 3. Identification of cis-regulatory mutations that disrupt activation of Neurog3 in pancreatic progenitors.
A. Binding of Hnf1b, Pdx1 and Foxa2 to cis-element 3 of the Neurog3 enhancer using EMSAs with nuclear extracts from E13.5 pancreatic buds. The 5’ part of the cis-element 3 sequence binds Hnf1b and Pdx1 while the 3’ part binds Pdx1 and Foxa2. B. ChIP for Hnf1b (n = 3), Pdx1 (n = 2) and Foxa2 (n = 3) in E13.5 pancreatic buds. Binding to the cis-element 3 (Neurog3 CE3) was compared to control regions Des6 (locus in gene-desert) and Neurog3 -6K (Neurog3 5’ upstream region). Indicated P-values were calculated with Students t-test. C. Lentiviral transgenesis using enhancers with indicated mutations, all of which disrupt specific transcription factor binding sites (S3 Fig). Note how the strongest reduction of expression is found upon disruption of all identified binding sites within cis-element 3. D. Quantification of percentage of Neurog3 cells that are GFP positive (black bars) and the percentage of GFP cells that are Neurog3 positive (grey bars). Quantification was done on 8 embryos for each genotype in which at least 1000 Neurog3 cells were counted ([**] P<1.0 x 10⁻⁶, [*] P<0.02, Student’s t-test with Bonferroni correction). Scale bars: C I-VI = 50 μm.
Fig 4
Fig 4. The Neurog3 enhancer region contributes to transcriptional repression in alternative lineages.
qRT-PCR analysis showed that in E13.5 liver progenitors and embryonic fibroblasts from transgenics carrying the Neurog3 enhancer, GFP mRNA was significantly reduced. GFP transcript levels were normalized for Tbp and compared to the construct that lacked the Neurog3 enhancer region ([*] (P<0.05, Student’s t-test).
Fig 5
Fig 5. The minimal Neurog3 enhancer functions as a PRE in vivo.
A. ChIP-oligonucleotide array analysis of the endogenous mouse Neurog3 locus in ES cells. The graph shows significance of enrichments for H3K27me3 (red), Ring1b (blue), and Ezh2 (orange) in posterior probability ranging from 0 to 1. The bottom panel shows a CpG content analysis for the same genomic coordinates. The average GC content in 400 bp sliding windows is shown in blue and the CpG fold over expected is shown in grey. Green bars depict putative CpG islands. B. Schematic representation of amplicons used in ChIP-qPCR to selectively study the integrated exogenous Neurog3 enhancer region or the control minimal promoter (note that only GFP can be used on both). C-E. ChIP-qPCR analysis for Ezh2, Ring1b and H3K27me3 on the exogenous Neurog3 enhancer region in transgenic E13.5 liver (n = 2) ([*] P<0.01, Student’s t-test).

References

    1. Heintzman ND, Ren B (2009) Finding distal regulatory elements in the human genome. Curr Opin Genet Dev 19: 541–549. 10.1016/j.gde.2009.09.006 - DOI - PMC - PubMed
    1. Ong CT, Corces VG (2012) Enhancers: emerging roles in cell fate specification. EMBO Rep 13: 423–430. 10.1038/embor.2012.52 - DOI - PMC - PubMed
    1. Margueron R, Reinberg D (2011) The Polycomb complex PRC2 and its mark in life. Nature 469: 343–349. 10.1038/nature09784 - DOI - PMC - PubMed
    1. Morey L, Helin K (2010) Polycomb group protein-mediated repression of transcription. Trends Biochem Sci 35: 323–332. 10.1016/j.tibs.2010.02.009 - DOI - PubMed
    1. Schuettengruber B, Cavalli G (2009) Recruitment of polycomb group complexes and their role in the dynamic regulation of cell fate choice. Development 136: 3531–3542. 10.1242/dev.033902 - DOI - PubMed

MeSH terms

Substances