. 2017 Feb 21;18(8):2058-2072.
doi: 10.1016/j.celrep.2017.01.075.

Diverse Central Projection Patterns of Retinal Ganglion Cells

Affiliations

Diverse Central Projection Patterns of Retinal Ganglion Cells

Emily M Martersteck et al. Cell Rep. .

Abstract

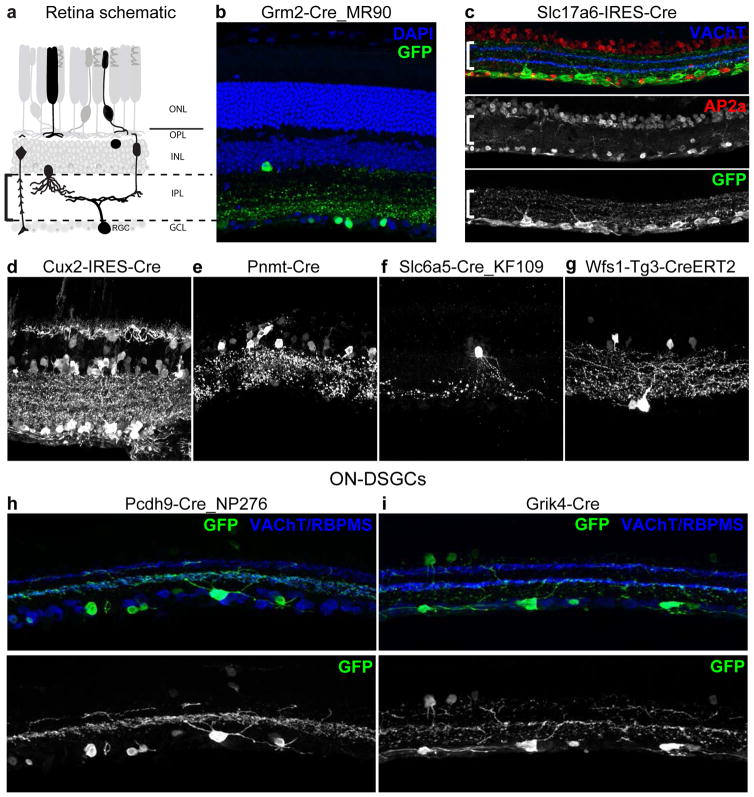
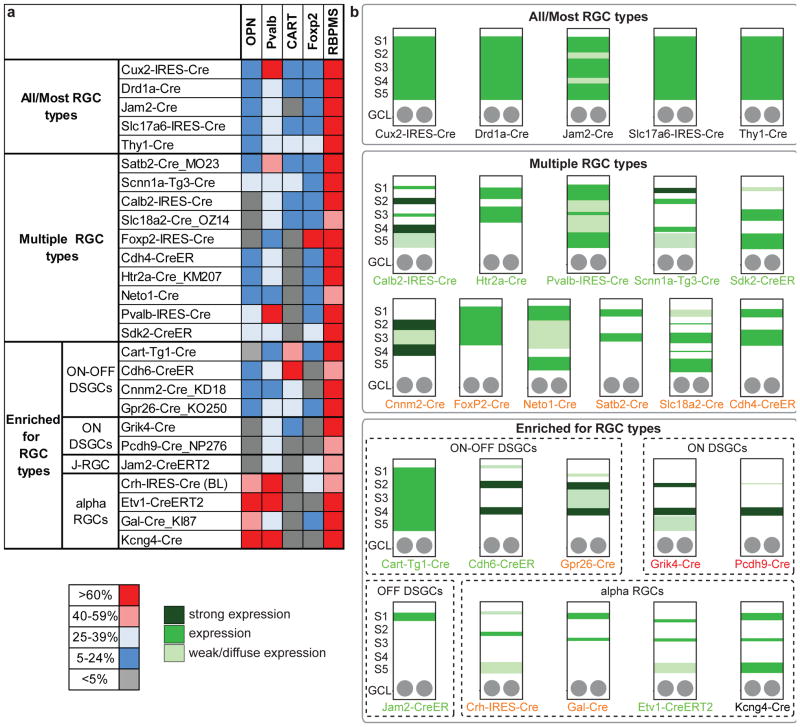
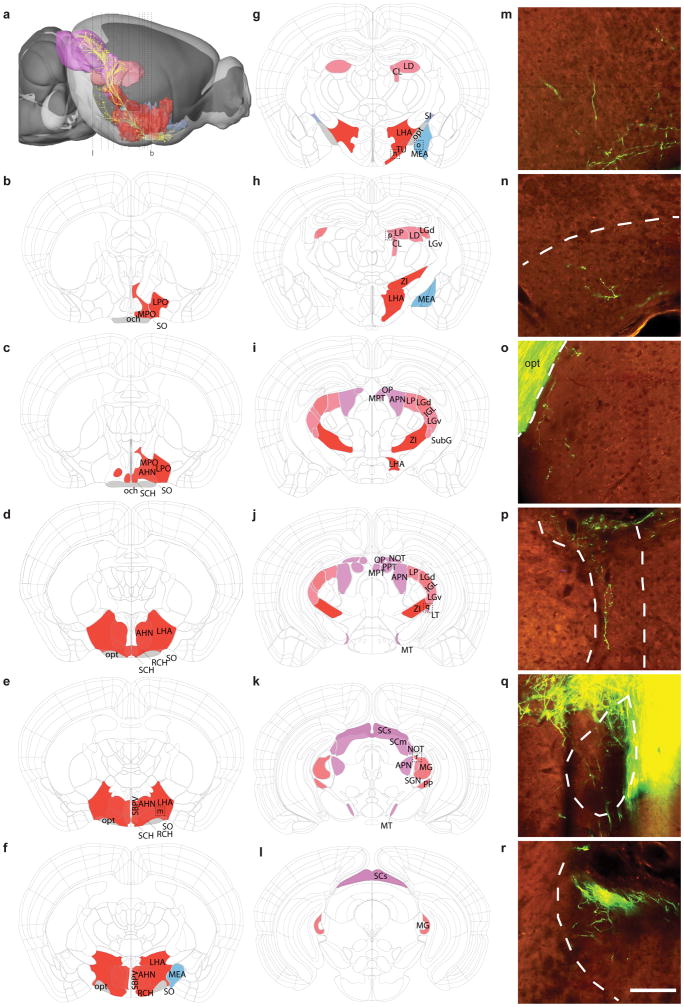
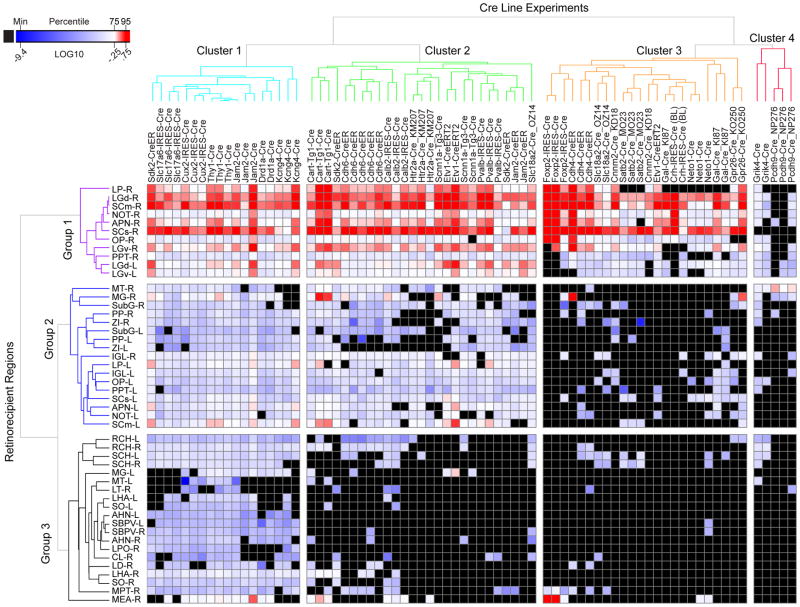
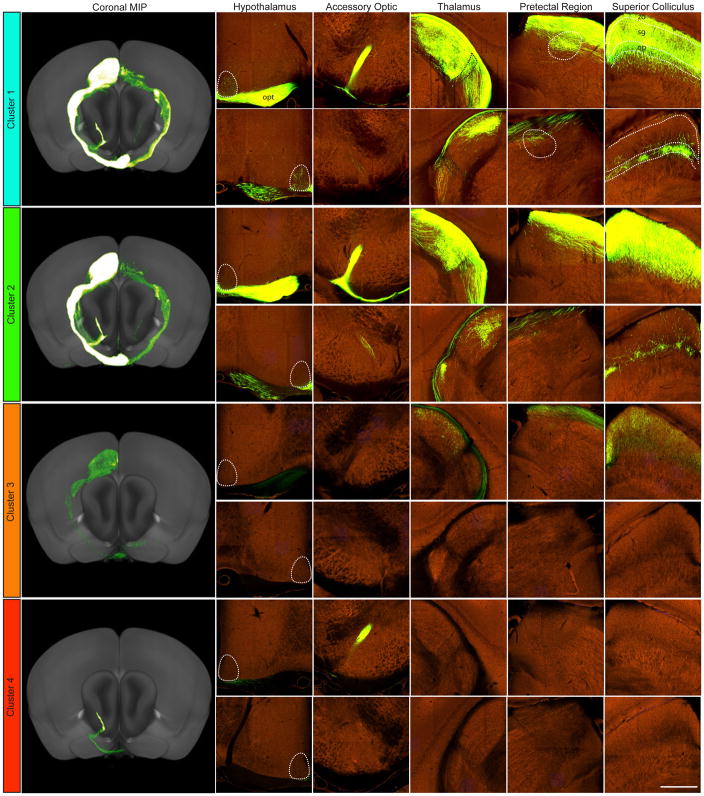
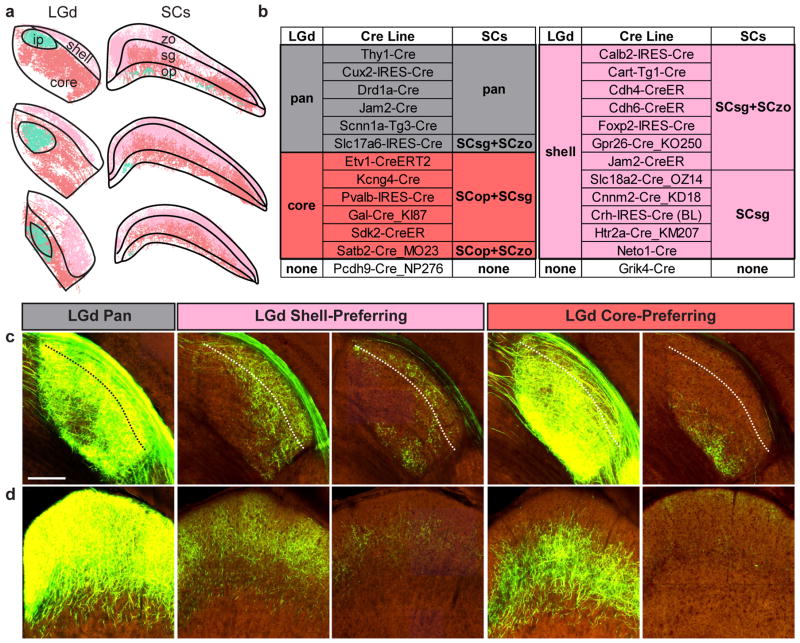
Understanding how >30 types of retinal ganglion cells (RGCs) in the mouse retina each contribute to visual processing in the brain will require more tools that label and manipulate specific RGCs. We screened and analyzed retinal expression of Cre recombinase using 88 transgenic driver lines. In many lines, Cre was expressed in multiple RGC types and retinal cell classes, but several exhibited more selective expression. We comprehensively mapped central projections from RGCs labeled in 26 Cre lines using viral tracers, high-throughput imaging, and a data processing pipeline. We identified over 50 retinorecipient regions and present a quantitative retina-to-brain connectivity map, enabling comparisons of target-specificity across lines. Projections to two major central targets were notably correlated: RGCs projecting to the outer shell or core regions of the lateral geniculate projected to superficial or deep layers within the superior colliculus, respectively. Retinal images and projection data are available online at http://connectivity.brain-map.org.

Keywords: Cre driver; axon projections; connectivity mapping; retinal ganglion cell types.


Figures

Figure 1
Figure 1. Diverse retinal cell types labeled by Cre-dependent rAAV reporter in Cre driver lines
(a) Sketch of retina showing cell types and layers. ONL, outer nuclear layer; OPL, outer plexiform layer; INL, inner nuclear layer; IPL, inner plexiform layer; GCL, ganglion cell layer; R, rod photoreceptor; C, cone photoreceptor; H, horizontal cell; B, bipolar cell; A, amacrine cell; M, Muller glia; RGC, retinal ganglion cell. (b–i) Cre-expressing lines were injected intravitreally with rAAV encoding Cre-dependent EGFP. Sections were stained with anti-GFP. Section in (b) was also stained with DAPI to mark all cells. Section in (c) was stained with anti-AP2a (red) to mark amacrine cells and anti-VAChT (blue) to mark dendrites of starburst amacrine cells in the IPL. Sections in (h,i) were labeled with anti-RBPMS and anti-VAChT to mark both RGCs and dendrites of starburst amacrine cells; arrowheads point to RGCs. In (a–g) bracket marks IPL layer. (b) RGCs and amacrines in Grm2-Cre_MR90. (c) RGCs in Slc17a6-IRES-Cre. (d) RGCs, amacrines and horizontal cells in Cux2-IRES-Cre. (e) Narrow-field amacrine cells in Pnmt-Cre. (f) A17 amacrine cell in Slc6a5-Cre_KF109. (g) RGCs and amacrine cells in Wfs1-Tg3-CreERT2. Pcdh9-Cre_NP276 (e) and Grik4-Cre (f) selectively label RGCs that cofasciculate with starburst amacrine cells in S4, a characteristic of ON-DSGCs. Grik4-Cre also contains some CART-positive ooDSGCs (not shown). Scale bars 25μm.
Figure 2
Figure 2. RGC types labeled and laminar distribution of all labeled dendrites in IPL in 26 Cre driver lines
Expression of Cre in known RGC types was assessed for each line based on co-staining with type-specific markers (a) and lamination patterns in the IPL (b). (a) The fraction of GFP-positive cells in the ganglion cell layer that colocalized with specific RGC marker antibodies was assessed for each Cre line. Colors indicate % of GFP-positive cells in the ganglion cell layer that were RGCs (RBPMS-positive) or the % of GFP-positive RGCs that were alpha RGCs (OPN-positive), Pvalb-positive, ooDSGCs (CART-positive), or F-RGCs (Foxp2-positive). (b) Each sketch summarizes laminar distribution results from a single line. The IPL was divided into 5 roughly equal sublaminae, S1–S5, using anti-VAChT to mark S2 and S4 (see Figure 1). Color bands indicate density of labeling from cells in the GCL (RGCs and amacrines). Colored text indicates cluster membership based on central projection patterns shown in Figure 4; black = cluster 1, green = cluster 2, orange = cluster 3, red = cluster 4.
Figure 3
Figure 3. Retinorecipient regions in the mouse brain
(a) Brain-wide projections from the retina (yellow) in a lateral view of the mouse brain. Retinorecipient regions are shown in different colors which correspond to major brain subdivisions within the Allen Mouse Common Coordinate Framework (CCF). (b–l) Coronal plates (at the levels indicated by dashed lines in a) showing brain regions annotated in the Allen Mouse CCF that contain RGC axon terminals. RGCs were labeled by injection of Cre-dependent rAAV EGFP into the left eye of Thy1-Cre mice; all RGC types are labeled in this line. Contralateral (right side) and ipsilateral (left side) brain structures containing labeled retinal projections are shown as colored regions in the eleven coronal plates along the rostral-to-caudal axis. (m–r) Selected images show axon terminals within six regions, corresponding to the boxes in panels e, g, h, j and k. Note that the retinal input to each target may be sparse and/or present in only small sub-regions of larger structures. Abbreviations for each target region are in Table 3. Colors: hypothalamus = red, amygdala/pallidum = blue, thalamus = pink, midbrain = purple.
Figure 4
Figure 4. Retina-to-brain connectivity map
Each column shows one injection experiment. Rows show retinorecipient regions included for quantitative analysis. The projection strength is quantified as the sum of all algorithmically-detected (segmented) fluorescent pixels within a given structure of the Allen Mouse CCF. Data were normalized by dividing the segmented projection volume in each structure with the segmented injection volume in the optic chiasm. Negative regions (no fluorescent signal or only passing fibers) verified by manual analysis are shown in black. The color map indicates Log10-transformed normalized projection volumes. Unsupervised hierarchical clustering of the experiments and target regions (using Euclidean distance and average linkage method) identified four major clusters of experiments and three major groups of retinal target regions among this set of Cre lines. Abbreviations for each target region are in Table 3. “-R” is right side and contralateral to injected eye. “-L” is left side and ipsilateral to injected eye.
Figure 5
Figure 5. Projections from Cre-expressing RGCs to five major retinorecipient brain areas
Section images are shown at the level of the hypothalamus, accessory optic nucleus, thalamus, pretectal region and superior colliculus from four Cre driver lines (a–d), one from each of the four projection clusters defined in Figure 4. A coronal view of the maximum intensity projection (MIP) of brain-wide fluorescent signal for each experiment is shown in the first column; contralateral to injected eye is on the top and ipsilateral on the bottom. All experiments in all clusters showed greater contralateral vs ipsilateral projections, but differ in the specific targets contacted by labeled axons
Figure 6
Figure 6. Correspondence between projection patterns within LGd and SCs from Cre expressing RGCs
(a) Subdivisions of the LGd and SCs. Contralateral projections from Kcng4 Cre (salmon) and Cart-Tg1-Cre (light pink) RGCs are shown in three coronal views on the rostral-caudal axis, along with ipsilateral projections mapped from a mouse injected with CTB in the opposite eye (cyan). These datasets were used to delineate the borders between each subdivision in the LGd. (b) Summary of the LGd and SCs projection patterns observed for all Cre lines. (c,d) Example images near the rostral-caudal midpoint through LGd (c) and SCs (d) from lines that differed in their laminar distribution of labeled terminals. Dashed lines in (c) show the border between shell and core regions. zo, zonal layer; sg, superficial gray layer; op, optic layer; ip, ipsilateral zone of LGd.

References

    1. Badea TC, Cahill H, Ecker J, Hattar S, Nathans J. Distinct roles of transcription factors brn3a and brn3b in controlling the development, morphology, and function of retinal ganglion cells. Neuron. 2009;61:852–864. - PMC - PubMed
    1. Baden T, Berens P, Franke K, Roman Roson M, Bethge M, Euler T. The functional diversity of retinal ganglion cells in the mouse. Nature. 2016;529:345–350. - PMC - PubMed
    1. Barnstable CJ, Drager UC. Thy-1 antigen: a ganglion cell specific marker in rodent retina. Neuroscience. 1984;11:847–855. - PubMed
    1. Berson DM. Retinal Ganglion Cell Types and Their Central Projections. In: Basbaum AI, editor. The Senses: A Comprehensive Reference. Amsterdam, Boston: Elsevier; 2008. pp. 491–519.
    1. Bleckert A, Schwartz GW, Turner MH, Rieke F, Wong RO. Visual space is represented by nonmatching topographies of distinct mouse retinal ganglion cell types. Curr Biol. 2014;24:310–315. - PMC - PubMed

Publication types

LinkOut - more resources