. 2017 Feb 21;46(2):315-326.
doi: 10.1016/j.immuni.2017.02.007.

Mass Spectrometry Profiling of HLA-Associated Peptidomes in Mono-allelic Cells Enables More Accurate Epitope Prediction

Affiliations

Mass Spectrometry Profiling of HLA-Associated Peptidomes in Mono-allelic Cells Enables More Accurate Epitope Prediction

Jennifer G Abelin et al. Immunity. .

Abstract

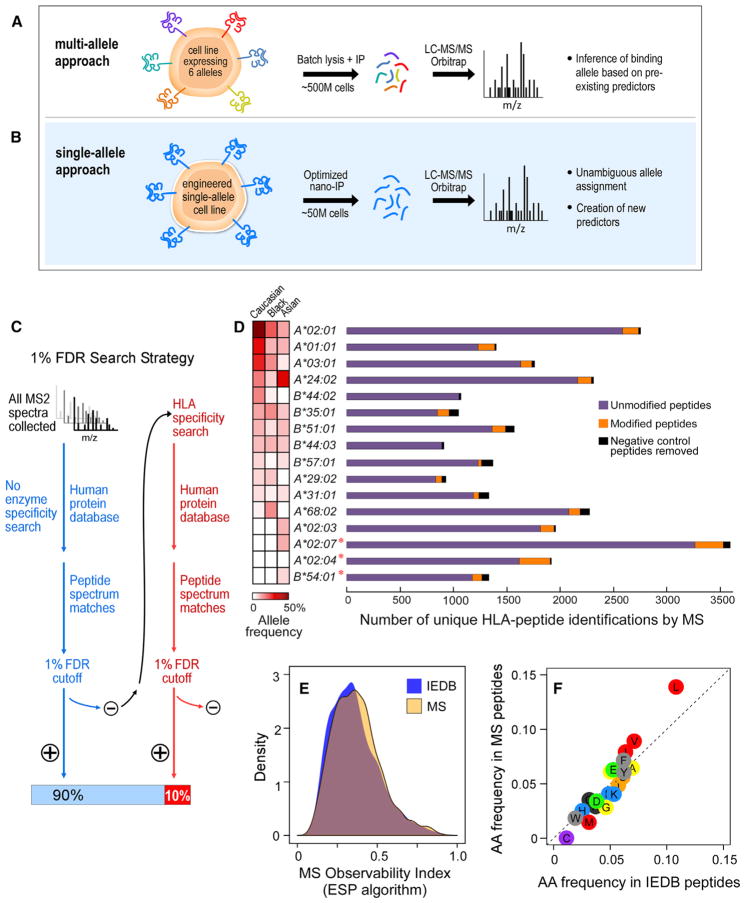
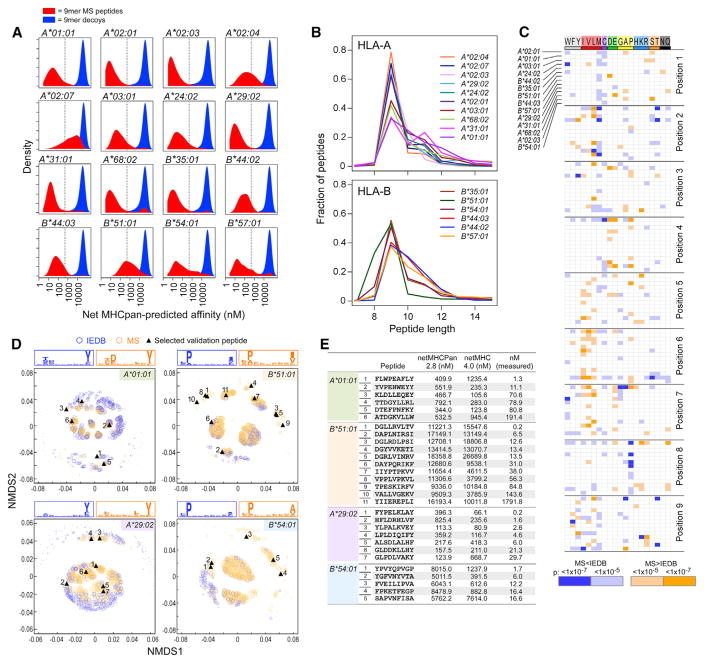
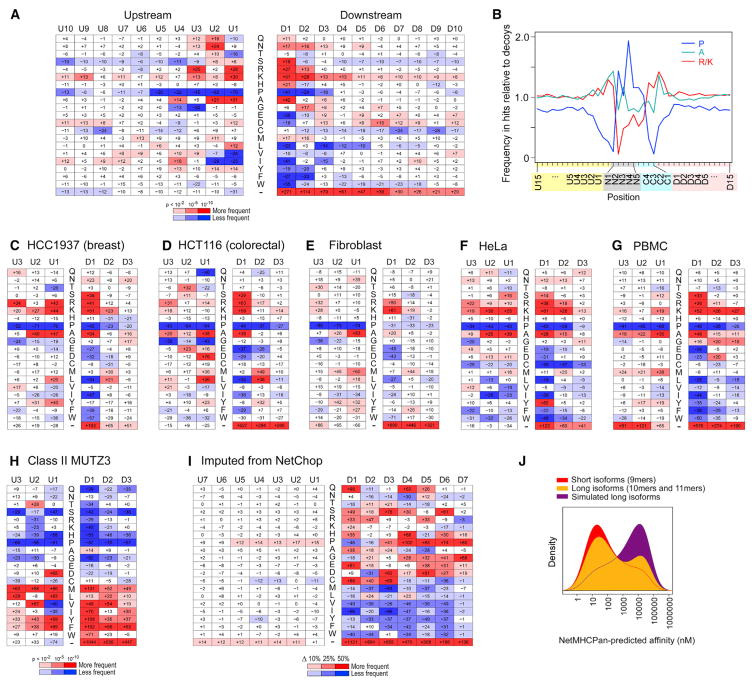
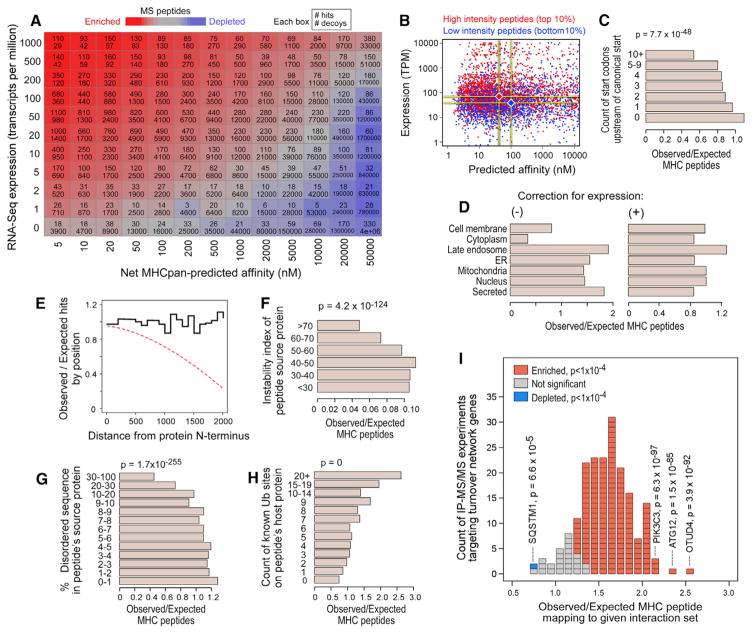
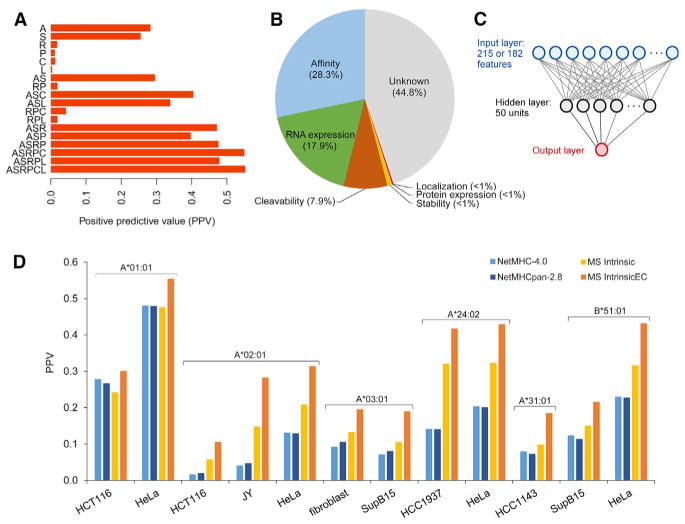
Identification of human leukocyte antigen (HLA)-bound peptides by liquid chromatography-tandem mass spectrometry (LC-MS/MS) is poised to provide a deep understanding of rules underlying antigen presentation. However, a key obstacle is the ambiguity that arises from the co-expression of multiple HLA alleles. Here, we have implemented a scalable mono-allelic strategy for profiling the HLA peptidome. By using cell lines expressing a single HLA allele, optimizing immunopurifications, and developing an application-specific spectral search algorithm, we identified thousands of peptides bound to 16 different HLA class I alleles. These data enabled the discovery of subdominant binding motifs and an integrative analysis quantifying the contribution of factors critical to epitope presentation, such as protein cleavage and gene expression. We trained neural-network prediction algorithms with our large dataset (>24,000 peptides) and outperformed algorithms trained on datasets of peptides with measured affinities. We thus demonstrate a strategy for systematically learning the rules of endogenous antigen presentation.


Figures

Figure 1
Figure 1. An Efficient Sample-Processing and -Analysis Pipeline for HLA Peptide Sequencing
(A) Overview of the standard multi-allele workflow. Cells (~500 million [M]) expressing multiple class I HLA alleles are lysed, and HLA-associated peptides are immunopurified with a pan-anti-HLA antibody. The complex mixture of HLA peptides is sequenced via LC-MS/MS, and the allele-binding assignments are inferred from previous knowledge. (B) In our single-allele approach, B721.221 cells (~50 M), are transduced to express only one HLA allele. Immunopurified peptides are analyzed by LC-MS/MS and sequenced via an HLA-allele-specific database search. (C) Schema of the HLA-specific database search strategy. (D) HLA-class-I-associated peptide identifications from 16 single-HLA-expressing cell lines. Total numbers of unmodified (purple), modified (orange), and negative control (black) peptides identified per allele are shown. Allele frequencies among Caucasian, Asian, and Black populations are shown. An asterisk denotes alleles for which LC-MS/MS experiments have generated a greater number of peptides than what is reported in the Immune Epitope Database. (E) To evaluate LC-MS/MS bias, we calculated the “MS observability index,” as measured by the ESP algorithm (Fusaro et al., 2009), for IEDB (blue) and MS (orange) peptide datasets. Distributions of the MS observability are displayed. (F) Amino acid frequencies within peptides reported in our single-allele dataset are compared to amino acid frequencies in peptides reported in IEDB. See also Figure S1.
Figure 2
Figure 2. HLA-Peptide Binding Motifs Enriched in LC-MS/MS Data Relative to IEDB
(A) Distributions of NetMHCpan-2.8-predicted HLA-binding affinities of peptides identified by LC-MS/MS (“hits”; red) compared to 1 × 10⁶ random 9-mer peptides from protein-coding genes (“decoys”; blue). (B) Length distributions of HLA-associated peptides identified from single-HLA-expressing cell lines. (C) Systematic evaluation of the frequencies of each amino acid (positions 1–9) within 9-mers sequenced by LC-MS/MS for the 14 of 16 HLA alleles for which sufficient IEDB data are available (orange, amino acids overrepresented in LC-MS/MS data; blue, amino acids underrepresented in LC-MS/MS data; scaling by p value). (D) MS 9-mer peptides (orange) compared to IEDB 9-mer peptides (blue). Non-metric multidimensional scaling (NMDS) was used for visualization of pairwise peptide distances in two dimensions for each analyzed HLA allele. Peptide distance was defined on the basis of sequence similarity (Kim et al., 2009). The size of each circle corresponds to the NetMHCpan-predicted affinity score of the corresponding peptide. Synthesized peptides for 4/5 alleles are marked in and are numbered per the corresponding line in the table of measured and predicted binding affinities (for HLA-B35:01, see Figure S2J). (E) MS peptides scoring in the bottom 10% by NetMHCpan 2.8 were selected for experimental validation. See also Figure S2.
Figure 3
Figure 3. Analysis of Peptide Cleavage Signatures and HLA-Binding Registers
(A) Heatmap of amino acids frequencies (percent change relative to background) in the protein sequence context (upstream: U10-U1; downstream D1-D10) of HLA peptides identified from single-HLA-expressing B721.221 cell lines. Colors of heatmap cells indicate directionality (red: enriched; blue: depleted) and p value (see key). (B–H) Amino acid frequency ratios for cleavage-influencing amino acids upstream of, downstream of, and within peptides derived from LC-MS/MS-identified peptides compared to random proteome 9-mers (B). Heatmaps of amino acid frequencies calculated from external class HLA I datasets, including the breast cancer cell line HCC1937 (C), colorectal cell line HCT116 (D), fibroblasts (E), HeLa cells (Bassani-Sternberg et al., 2015) (F), and peripheral blood mononuclear cells (Caron et al., 2015) (G), as well as class II data from MUTZ3 (Mommen et al., 2016) (H). (I) Percent change in amino acid frequency of top-scoring peptides (top 25%) compared to bottom-scoring peptides (bottom 25%) among 1,000,000 random proteome 9-mers evaluated by NetChop (Saxová et al., 2003). Color coding indicates directionality and magnitude of percent change (see key). (J) Distribution of predicted affinities for the short isoforms (red) and long isoforms (yellow) of nested sets as well as for simulated long isoforms (random amino acids added at the beginning or end of the short isoforms). See also Figure S3.
Figure 4
Figure 4. Evaluation of HLA-Peptide Characteristics that Impact HLA-Binding Predictions
(A) Hits and decoys binned according to source transcript expression (per RNA-Seq; y axis) and predicted affinity (x axis) for each allele. Per bin, hit (top) and decoy (bottom) counts are reported. Color is according to the hit:decoy ratio (red = enriched for hits; blue = depleted of hits). (B) MS peptides with high (red) and low (blue) MS1 ion intensities (top and bottom 10%, respectively), plotted by their NetMHCpan-predicted affinity and source transcript expression. (C) Each LC-MS/MS-identified peptide was matched to ten random proteome 9-mer decoys with approximately equal expression but different source genes. The observed count of MS peptides divided by the expected count (based on decoy frequencies) is shown as a function of the number of upstream ATGs. P values were calculated by t test. (D) The observed count of LC-MS/MS-identified HLA peptides mapping to each localization (Uniprot) relative to the expected count based on random 9-mer decoys (left) or expression-matched decoys (right). (E) The ratio of observed to expected peptides at each distance lag from the source protein N terminus (blackline). The expected counts were determined under the assumption that each peptide was equally likely to have arisen from any position in its source protein. Frequent premature translation abortion would be expected to create an N-terminal bias (dashed red line). (F) Observed versus expected HLA-peptide counts (determined from expression-matched decoys) as a function of source protein instability index (Guruprasad et al., 1990). P values were calculated by t test. (G) Similar analysis to (F) showing enrichments as a function of the amount of intrinsically disordered sequence within each peptide’s source protein. (H) Enrichments according to the count of ubiquitination sites, as previously observed (Krönke et al., 2015; Krönke et al., 2014; Udeshi et al., 2012), within the source protein. (I) Approximately 200 protein-protein interaction experiments (Behrends et al., 2010; Christianson et al., 2011 Sowa et al., 2009), each yielding a set of 50–100 high-confidence interacting proteins for a given bait (usually a known protein-turnover-pathway gene) were scored according to their enrichment for LC-MS/MS-observed peptides, here depicted as a histogram. Each block corresponds to one experiment and is colored according to the directionality and significance (chi-square test) of the enrichment (see key). The bait protein used in outlier experiments (SQSTM1, PIK3C3, and OTUD4) is marked along with the corresponding p value. See also Figure S4.
Figure 5
Figure 5. Evaluation of MS-Data-Based HLA-Peptide Binding Predictors
(A) Positive predictive value of linear models used for discerning 9-mer MS peptides among a 999-fold excess of 9-mer decoys (averaging across 16 alleles). Models included one or more predictor variables (A = affinity, S = stability, R = RNA-Seq expression, P = protein expression (iBAQ), C = cleavability score, and L = source protein localization). (B) Explanatory contributions of predictor variables derived from the cumulative improvement in predictive value as predictors are added. (C) Cartoon representation of the neural-network model architecture. The 215 MSIntrinsic inputs included amino acid dummy variables (180 nodes), amino acid properties (27 nodes), and peptide properties (8 nodes). The 182 MSIntrinsicEC inputs included the amino acid dummy variables, expression (1 node), and cleavability (1 node). (D) External evaluation. MS-binding data from two published datasets (Bassani-Sternberg et al., 2015; Trolle et al., 2016) were used for comparing the positive predictive value of MSIntrinsic and MSIntrinsicEC against NetMHCpan 2.8 and NetMHC 4.0 in identifying presented peptides among a 999-fold excess of random decoy 9-mers. Peptides were excluded from the evaluation if they were highly likely to bind an allele other than the one being evaluated. See also Figure S5.

References

    1. Andreatta M, Nielsen M. Gapped sequence alignment using arti-ficial neural networks: application to the MHC class I system. Bioinformatics. 2016;32:511–517. - PMC - PubMed
    1. Bassani-Sternberg M, Gfeller D. Unsupervised HLA peptidome deconvolution improves ligand prediction accuracy and predicts cooperative effects in peptide-HLA interactions. J Immunol. 2016;197:2492–2499. - PubMed
    1. Bassani-Sternberg M, Pletscher-Frankild S, Jensen LJ, Mann M. Mass spectrometry of human leukocyte antigen class I peptidomes reveals strong effects of protein abundance and turnover on antigen presentation. Mol Cell Proteomics. 2015;14:658–673. - PMC - PubMed
    1. Behrends C, Sowa ME, Gygi SP, Harper JW. Network organization of the human autophagy system. Nature. 2010;466:68–76. - PMC - PubMed
    1. Berg M, Parbel A, Pettersen H, Fenyö D, Björkesten L. Detection of artifacts and peptide modifications in liquid chromatography/ mass spectrometry data using two-dimensional signal intensity map data visualization. Rapid Commun Mass Spectrom. 2006;20:1558–1562. - PubMed

MeSH terms