. 2017 Mar 7;114(10):2474-2478.
doi: 10.1073/pnas.1611467114. Epub 2017 Feb 22.

Chirality-induced spin polarization places symmetry constraints on biomolecular interactions

Affiliations

Chirality-induced spin polarization places symmetry constraints on biomolecular interactions

Anup Kumar et al. Proc Natl Acad Sci U S A. .

Abstract

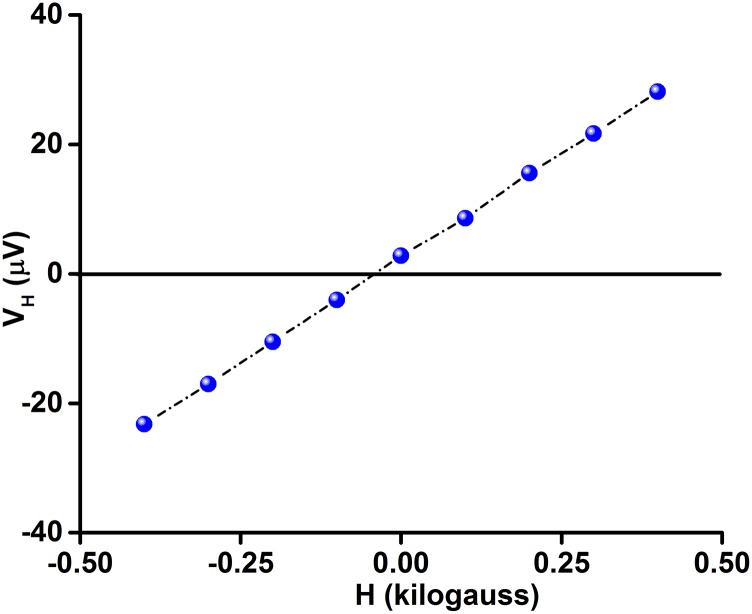
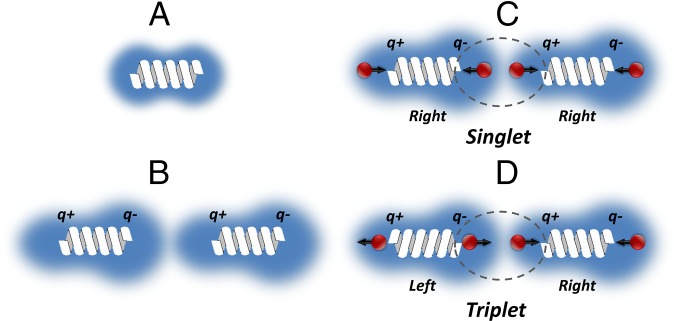
Noncovalent interactions between molecules are key for many biological processes. Necessarily, when molecules interact, the electronic charge in each of them is redistributed. Here, we show experimentally that, in chiral molecules, charge redistribution is accompanied by spin polarization. We describe how this spin polarization adds an enantioselective term to the forces, so that homochiral interaction energies differ from heterochiral ones. The spin polarization was measured by using a modified Hall effect device. An electric field that is applied along the molecules causes charge redistribution, and for chiral molecules, a Hall voltage is measured that indicates the spin polarization. Based on this observation, we conjecture that the spin polarization enforces symmetry constraints on the biorecognition process between two chiral molecules, and we describe how these constraints can lead to selectivity in the interaction between enantiomers based on their handedness. Model quantum chemistry calculations that rigorously enforce these constraints show that the interaction energy for methyl groups on homochiral molecules differs significantly from that found for heterochiral molecules at van der Waals contact and shorter (i.e., ∼0.5 kcal/mol at 0.26 nm).

Keywords: biorecognition; chirality; enantioselectivity; exchange interaction; spin.


Conflict of interest statement

The authors declare no conflict of interest.

Figures

Fig. 1.
Fig. 1.
(A) The experimental setup in which a Hall device, coated with a self-assembled organic monolayer, is placed in solution with a G electrode and an inert electrolyte. When an electric potential VG is applied between the G electrode and the device, the ionic solution is polarized, so that an electric field acts on the adsorbed molecules. As a result, the molecules are polarized because of charge reorganization (partial charges q+ and q−), inducing a charge displacement in the surface region of the device. Because the charge polarization is accompanied by spin polarization (red balls with black arrows in C), a magnetic field that acts on the electrons flowing between the S and D electrodes is also created. The Hall potential VH, which is formed as a result of the spin magnetization, can be measured as a function of VG. (B) A schematic diagram illustrating the electrical operation of the device, where ISD indicates the applied S–D current, VG is the gate voltage, and VH is the differential Hall potential across the conductive channel. (C) A scheme describing the spin polarization. When an electric field is applied on a chiral molecule (via VG), it induces charge reorganization in the molecule, resulting in spin polarization.
Fig. S1.
Fig. S1.
Optical microscope image of the GaN-based Hall device. The distance between the S and D electrodes is 500 μm, and the distance between the Hall electrodes (H1 and H2) is 40 μm.
Fig. S2.
Fig. S2.
Grazing angle attenuated total reflectance Fourier transform IR (GATR-FTIR) spectra of (A) 11-mercaptoundecanoic acid, (B) SHCH2CH2CO-{Ala-Aib}5-COOH, and (C) SHCH2CH2CO-{Ala-Aib}7-COOH monolayers on GaN.
Fig. S3.
Fig. S3.
Representative XPS spectra of (A) N 1s, (B) C 1s, and (C) O 1s for the monolayers of oligopeptide.
Fig. 2.
Fig. 2.
Gate voltage (VG)-dependent Hall measurements conducted on devices coated with different oligopeptides. (A) Hall potential measured when the adsorbed layer is either l-SHCH2CH2CO-{Ala-Aib}5-COOH (red) or d-SHCH2CH2CO-{Ala-Aib}5-COOH (blue). The Hall potential was calculated as the difference between the peak responses for each applied gate voltage; ΔVH+ and ΔVH− correspond to positive and negative values of ISD, respectively. More details are in Fig. S4. (B) The dependence of the Hall voltage on VG is shown for monolayer films of achiral 11-mercapto-undecanoic acid (black), chiral l-SHCH2CH2CO-{Ala-Aib}5-COOH (red), and chiral l-SHCH2CH2CO-{Ala-Aib}7-COOH (green). (C) The time-dependent Hall potential measured with l-SHCH2CH2CO-{Ala-Aib}7-COOH when a voltage of −10 V is applied (indicated in blue) between the gate and the Hall device. On switching the potential off (indicated in green), an opposite signal appears for the chiral molecules as a result of charge flowing back the other way through the monolayer film (in the text). Note that the timescale of the response is controlled by the large capacitance of the measurement method. (D) The time-dependent Hall measurements are shown for various gate voltages. The on and off switching of the gate is marked with blue and green arrows, respectively.
Fig. S4.
Fig. S4.
Calibration curve of the Hall device. Hall voltage (VH) is plotted vs. external magnetic field (H) at room temperature. A slight asymmetry exists because of asymmetry in the position of the Hall electrodes.
Fig. 3.
Fig. 3.
(A) The schematic diagram illustrates the electron distribution (blue cloud) in a molecule that does not have a dipole moment before it interacts with another molecule. In this case, the distribution is symmetric. (B) This diagram illustrates the electron distribution where two molecules interact via dispersive forces. The interaction induces an asymmetry in the electrons’ distribution, resulting in an “induced dipole” in each molecule. This charge polarization causes an “induced dipole–induced dipole” interaction. (C) The diagram illustrates the induced dipole interaction of two molecules with the same handedness. As charge q transfers from one side of the molecule to the other, it generates a spin polarization (represented by a red ball and black arrow) of the same spin in the two molecules. The electron density left behind has, therefore, the opposite spin polarization; hence, the interaction between the molecules is characterized by two opposite spins as illustrated by the dotted circle singlet region. (D) When the two interacting molecules are of opposite chirality, the interaction between the molecules is characterized by two spins parallel to each other (in the dotted circle triplet region). Reproduced from ref. .
Fig. 4.
Fig. 4.
(A) A scheme of two chiral molecules interacting through achiral methyl groups. (B) Plot of the second-order dispersion energy for aligned spins (blue) and antiparallel spins (red) for the model system R–CH3…CH3–R as a function of the carbon–carbon distance, d, for the case of RS interaction (the same spins; red curve) and when the spins are aligned antiparallel in the case of SS interaction (blue curves). (C) Plot of the difference in spin correlation energies, for the same spin and the opposite spin, as a function of intermonomer distance for •CH3…CH3• in open shell singlet (blue) and triplet (red) couplings.
Fig. S5.
Fig. S5.
Symmetry-adapted perturbation theory results of the RS_CX3-CH3_CX3-CH3_2.00 system.
Fig. S6.
Fig. S6.
Gaussian 09 output of the RS_CH3_CH3_2.00 system (methyl radical dimer with C-C distance of 2.00 Å) with an open shell singlet state.
Fig. S7.
Fig. S7.
An example illustrating the interaction of an enzyme and its substrate. Left shows a subunit of citrate lyase from Mycobacterium tuberculosis with a bound ligand. Right, an expanded view of the binding pocket of citrate lyase, illustrates the interaction of the ligand with a binding argenine. Protein Data Bank ID code 1Z6K (31). Distances were measured and presented using Jmol (jmol.sourceforge.net) (32).

References

    1. Hudson WH, Ortlund EA. The structure, function and evolution of proteins that bind DNA and RNA. Nat Rev Mol Cell Biol. 2014;15(11):749–760. - PMC - PubMed
    1. Williams DH, Stephens E, O’Brien DP, Zhou M. Understanding noncovalent interactions: Ligand binding energy and catalytic efficiency from ligand-induced reductions in motion within receptors and enzymes. Angew Chem Int Ed Engl. 2004;43(48):6596–6616. - PubMed
    1. Wilchek M, Bayer EA, Livnah O. Essentials of biorecognition: The (strept)avidin-biotin system as a model for protein-protein and protein-ligand interaction. Immunol Lett. 2006;103(1):27–32. - PubMed
    1. Christensen AS, Kubař T, Cui Q, Elstner M. Semiempirical quantum mechanical methods for noncovalent interactions for chemical and biochemical applications. Chem Rev. 2016;116(9):5301–5337. - PMC - PubMed
    1. Wagner JR, et al. Emerging computational methods for the rational discovery of allosteric drugs. Chem Rev. 2016;116(11):6370–6390. - PMC - PubMed

Publication types