. 2017 Apr 15;28(8):1054-1065.
doi: 10.1091/mbc.E15-04-0218. Epub 2017 Feb 22.

LIMCH1 regulates nonmuscle myosin-II activity and suppresses cell migration

Affiliations

LIMCH1 regulates nonmuscle myosin-II activity and suppresses cell migration

Yu-Hung Lin et al. Mol Biol Cell. .

Abstract

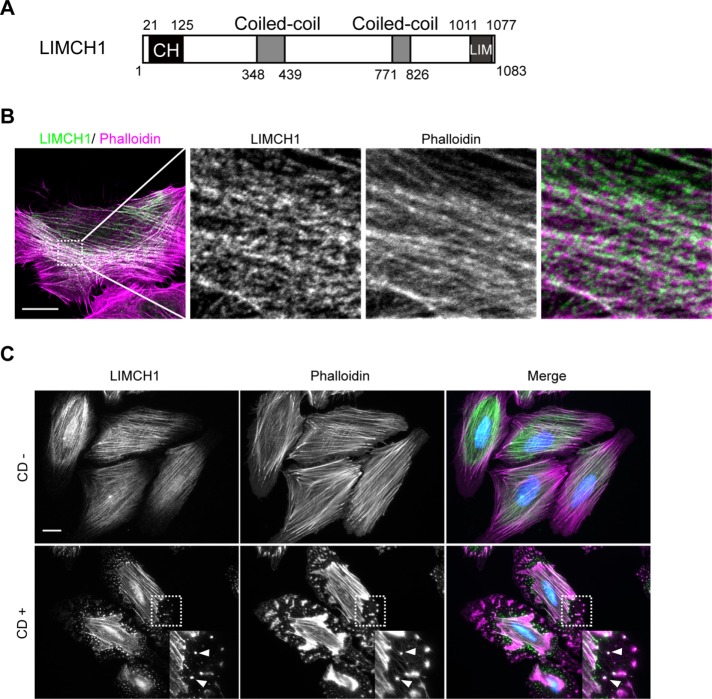
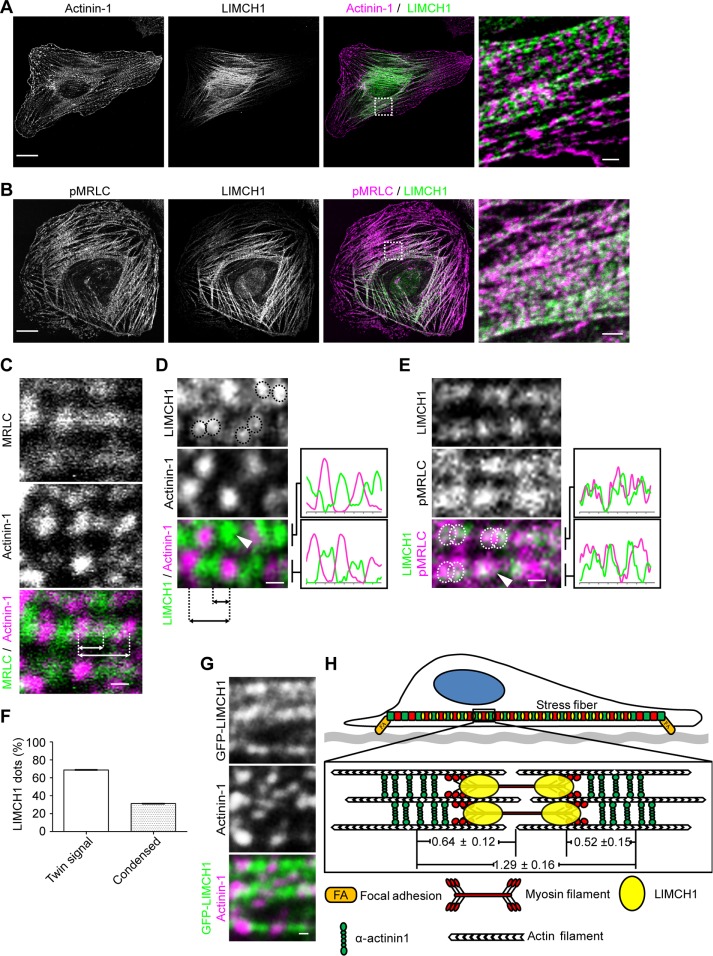
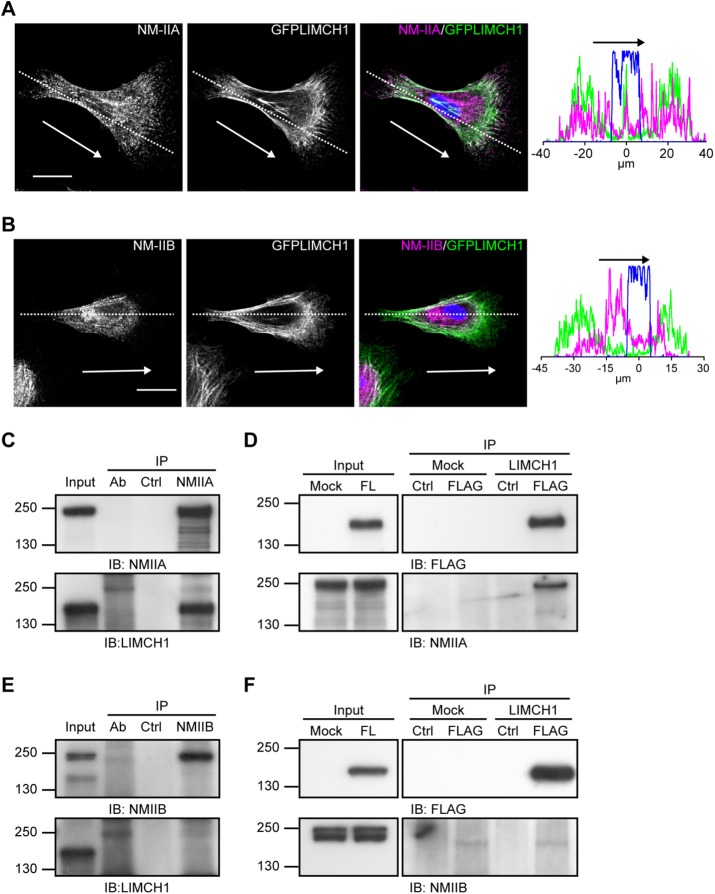
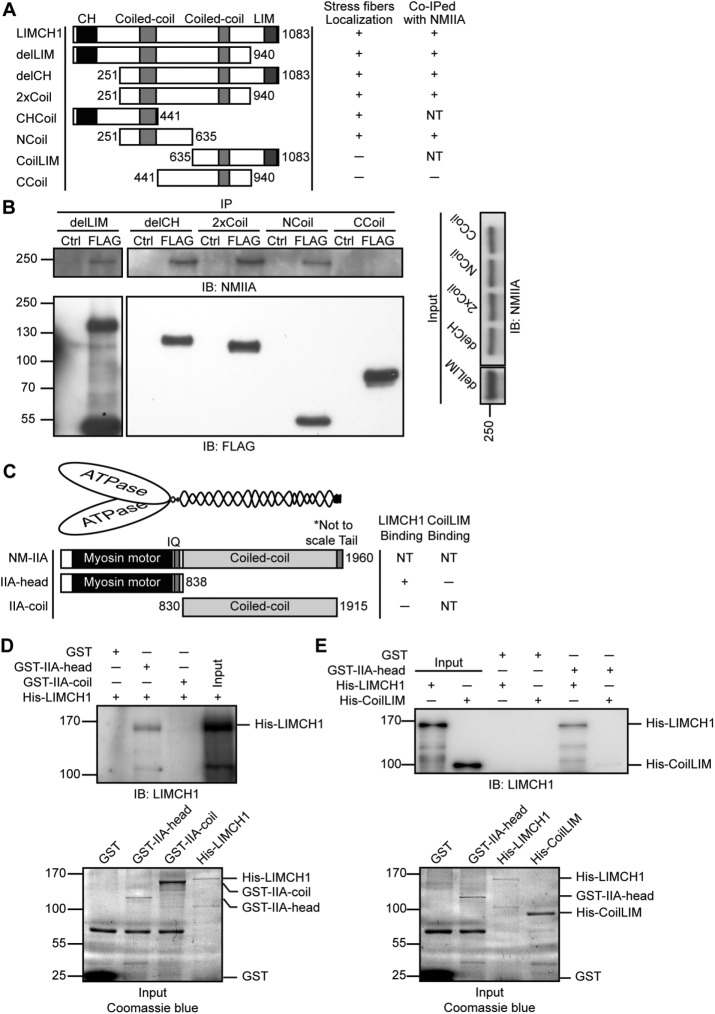
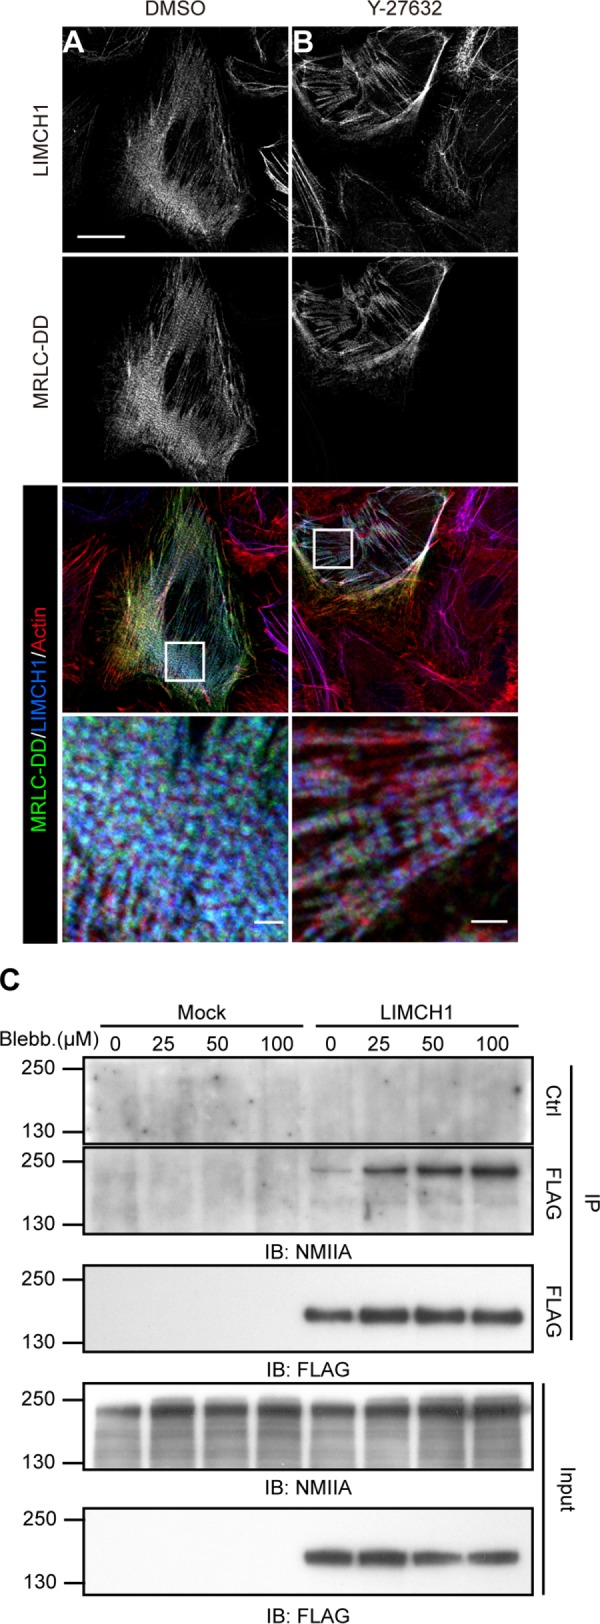
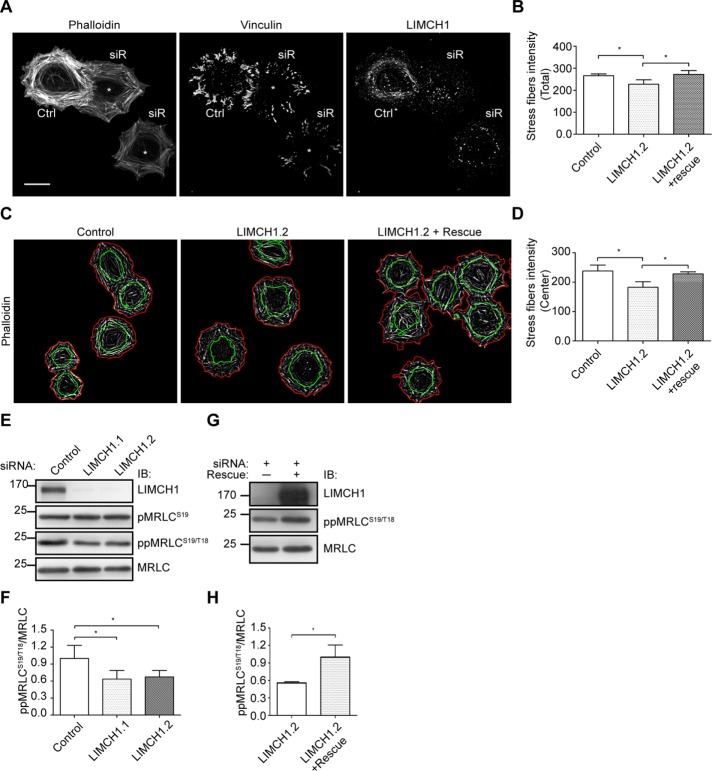
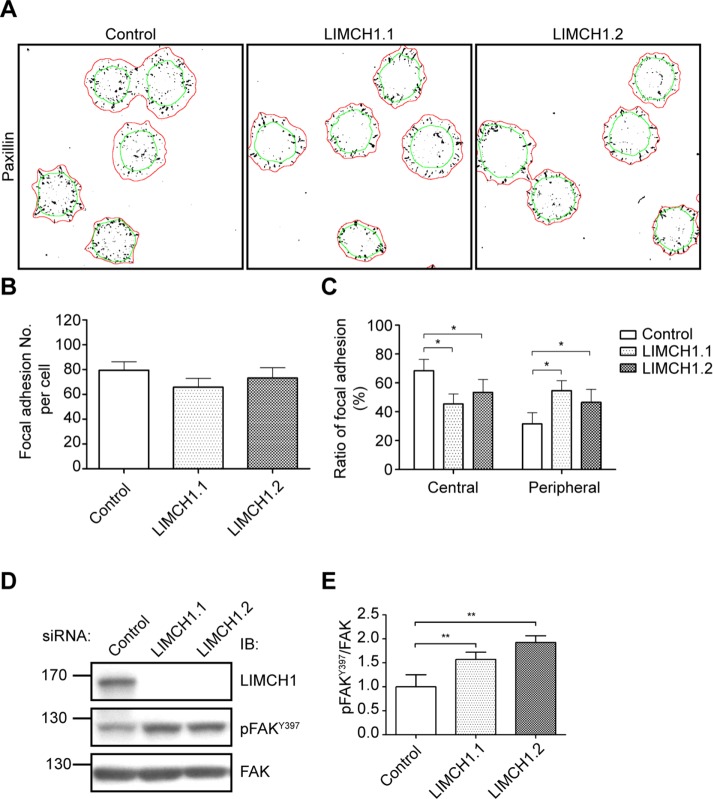
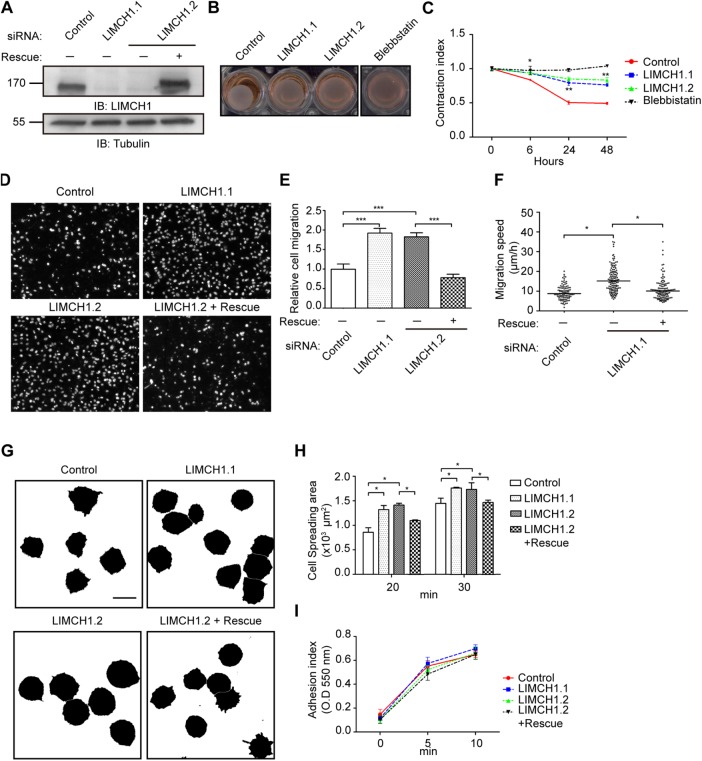
Nonmuscle myosin II (NM-II) is an important motor protein involved in cell migration. Incorporation of NM-II into actin stress fiber provides a traction force to promote actin retrograde flow and focal adhesion assembly. However, the components involved in regulation of NM-II activity are not well understood. Here we identified a novel actin stress fiber-associated protein, LIM and calponin-homology domains 1 (LIMCH1), which regulates NM-II activity. The recruitment of LIMCH1 into contractile stress fibers revealed its localization complementary to actinin-1. LIMCH1 interacted with NM-IIA, but not NM-IIB, independent of the inhibition of myosin ATPase activity with blebbistatin. Moreover, the N-terminus of LIMCH1 binds to the head region of NM-IIA. Depletion of LIMCH1 attenuated myosin regulatory light chain (MRLC) diphosphorylation in HeLa cells, which was restored by reexpression of small interfering RNA-resistant LIMCH1. In addition, LIMCH1-depleted HeLa cells exhibited a decrease in the number of actin stress fibers and focal adhesions, leading to enhanced cell migration. Collectively, our data suggest that LIMCH1 plays a positive role in regulation of NM-II activity through effects on MRLC during cell migration.


Figures

FIGURE 1:
FIGURE 1:
LIMCH1 associates with actin stress fibers and binds to actin. (A) Schematic diagram of LIMCH1 exhibiting a CH domain at the N-terminus and a LIM domain at the C-terminus. The center contains the coiled-coil domains. (B) Confocal fluorescence image of HeLa cells stained with anti-LIMCH1 antibody (green) and phalloidin (magenta); bar, 20 μm. Right, magnified images. (C) HeLa cells were stained with anti-LIMCH1 antibody (green) and phalloidin (magenta) after treatment with or without 5 μM CD for 30 min. Arrowheads in the inset indicate condensed actin filaments and LIMCH1; bar, 20 μm.
FIGURE 2:
FIGURE 2:
LIMCH1 colocalizes with NM-II in a contractile unit. (A, B) Confocal images of HeLa cells stained with anti-LIMCH1 (green), anti–actinin-1 (magenta in A), and anti-pMRLCS19 (magenta in B) antibodies; bar, 20 μm. Right, magnified images; bar, 2 μm. (C–E) Confocal images of HeLa cells stained with anti-LIMCH1 (green), anti–actinin-1 (magenta in C and D), and anti-pMRLCS19 (green in C, magenta in E) antibodies; bar, 0.5 μm. LIMCH1 displayed twin signals (green, dotted circles) in D and E. Right, plot profiles. Dashed lines in C and D illustrate the center-to-center space among actinin-1, MRLC, and LIMCH1 for length measurement. Arrowheads indicate a condensed LIMCH1. (F) Ratio of twin signal and condensed dot of LIMCH1 in a contractile unit measured via analysis of plot profiles of staining images. (G) Fluorescence image of U2OS cells transfected with GFP-LIMCH1 (green) and stained with antixactinin-1 antibody (magenta); bar, 0.5 μm. (H) Estimated localization of LIMCH1 between actinin-1 and assembled NM-II. The distance between the adjacent actinin-1’s was 1.29 ± 0.16 μm (n = 69 in five cells), between actinin-1 and MRLC was 0.64 ± 0.12 μm (n = 45 in three cells), and between actinin-1 and LIMCH1 was 0.52 ± 0.15 μm (n = 65 in five cells).
FIGURE 3:
FIGURE 3:
LIMCH1 interacts with NM-IIA. (A, B) Confocal images of GFP-LIMCH1–transfected HeLa cells (green) stained with anti–NM-IIA (magenta in A) and anti–NM-IIB (magenta in B) antibodies; bar, 20 μm. Right, plot profiles of NM-IIA, NM-IIB, and LIMCH1 in the cell, reflecting dashed lines in the staining images. Arrows indicate the direction of cell migration. (C, E) HeLa cell lysates were subjected to immunoprecipitation with anti–NM-IIA and anti–NM-IIB antibodies, respectively, followed by immunoblotting with anti-LIMCH1 antibody. (D, F) Cell extracts from HeLa cells expressing FLAG-LIMCH1 were subjected to immunoprecipitation with anti-FLAG antibody, followed by immunoblotting with anti–NM-IIA and anti–NM-IIB antibodies, respectively. A total of 5% of the input and 50% of the immunoprecipitate were loaded. Cell lysate incubated with protein G beads alone was used as lysate control (Ctrl). The NM-IIA or NM-IIB antibodies incubated with protein G beads alone were used as antibody control (antibody). LIMCH1, full-length FLAG-tagged LIMCH1. Mock, FLAG vector alone.
FIGURE 4:
FIGURE 4:
The N-terminus of LIMCH1 directly interacts with the head of NM-IIA. (A) Truncation mutants of LIMCH1 fused with GFP or FLAG tags on the N-terminus were tested for their subcellular localization and interaction with NM-IIA. Right, results of the association between each truncation mutant and actin stress fibers and its interaction with NM-IIA; NT, not tested. (B) Cell extracts from FLAG-truncation mutants expressed in HeLa cells were subjected to immunoprecipitation with anti-FLAG antibody and immunoblotted with anti-FLAG and anti– NM-IIA antibodies. Cell lysate incubated with protein G beads alone was used as control (Ctrl). A total of 5% of the input and 50% of the immunoprecipitate were loaded. (C) Schematic diagram of NM-IIA showing the N-terminal motor region that binds actin and the coiled-coil domain at the center with the C-terminal tail that controls myosin heavy chain assembly. Truncations of NM-IIA fused with GST on the N-terminus were tested for their ability to bind LIMCH1. Right, relative abilities of each truncation to bind with purified His-LIMCH1 or His-CoilLIM; NT, not tested. (D) Soluble His-LIMCH1 was incubated with NM-IIA truncations immobilized on a glutathione bead, and the products of in vitro pull downs were immunoblotted with anti-LIMCH1 antibody (top). Coomassie blue staining showed the input of GST-NM-IIA truncations and 10×His-LIMCH1 (bottom). (E) Soluble His-LIMCH1 or His-CoilLIM was incubated with GST-IIA-head immobilized on a glutathione bead, and the products of in vitro pull downs were immunoblotted with anti-LIMCH1 antibody (top). Coomassie blue staining showed the input of GST-IIA-head, 10× His-LIMCH1, and 20× His-CoilLIM (lower). A total of 2% of the input and 20% of pull downs were loaded for Western blot analysis. His, hexahistidine tag was fused on the N-terminus of LIMCH1 or CoilLIM.
FIGURE 5:
FIGURE 5:
Interaction between LIMCH1 and NM-IIA is independent of myosin ATPase activity. (A, B) Confocal images of HeLa cells transfected with GFP-MRLC-DD (green) and stained with anti-LIMCH1 (blue) antibody and phalloidin (red); bar, 20 μm. These cells were treated with DMSO in A and 5 μM Y-27632 in B for 30 min. Enlarged images in insets show the colocalization of LIMCH1 and GFP-MRLC-DD; bar, 2 μm. (C) Cell extracts from FLAG-LIMCH1 expressed in HeLa cells were subjected to immunoprecipitation by anti-FLAG antibody and immunoblotted with anti-FLAG and anti–NM-IIA antibodies. These cells were treated with various concentrations of blebbistatin for 30 min. LIMCH1, FLAG-tagged LIMCH1. Mock, FLAG vector alone.
FIGURE 6:
FIGURE 6:
Central stress fibers and MRLC phosphorylation are reduced in LIMCH1-depleted cells. (A) Confocal images of siRNA-treated HeLa cells stained with phalloidin and anti-vinculin antibody after cell spreading on a fibronectin-coated coverslip for 60 min; bar, 20 μm. Asterisks indicate the reduced central stress fibers and focal adhesions. (B) Quantification of intensity of total stress fibers. (C) Binary images of actin stress fibers stained with phalloidin in siRNA-treated HeLa cells were processed using ImageJ software. Cell outlines (red) and central areas (green) were defined by staining with phalloidin and NM-IIB, respectively. (D) Quantification of intensity of central stress fibers. In B and D, results were analyzed using ImageJ software (n = 80–100 cells in three independent experiments, mean ± SD, *p < 0.05, one-way ANOVA, Tukey’s multiple comparison test). (E) Cell extracts from siRNA-treated HeLa cells were probed with anti-pMRLCS19, ppMRLCS19/T18, and MRLC antibodies. (F) Relative levels of ppMRLCS19/T18 shown in E (n = 6, mean ± SD, normalized to control siRNA, *p < 0.05, two-tailed t test). (G) Cell extracts from LIMCH1-depleted and siRNA-resistant HeLa cells were probed with pMRLCS19/T18 and MRLC antibodies. (H) Relative levels of pMRLCS19/T18 shown in G (n = 3, mean ± SD, normalized to siRNA rescue, *p < 0.05, two-tailed t test).
FIGURE 7:
FIGURE 7:
LIMCH1 depletion affects the formation of focal adhesions in the cell center and phosphorylation of FAK. (A) Binary images of focal adhesions stained with anti-paxillin antibody in siRNA-treated HeLa cells were processed using ImageJ software. Cell outlines (red) and central areas (green) were defined by staining with phalloidin and NM-IIB, respectively. (B) Quantification of the number of total focal adhesions. (C) The ratio of focal adhesions was measured by dividing the number of central or peripheral adhesions by the number of total focal adhesion. In B and C, results were analyzed using ImageJ software (n = 118–142 cells in three independent experiments, mean ± SD, *p < 0.001, one-way ANOVA, Tukey’s multiple comparison test). (D) Cell extracts from siRNA-treated cells were probed with anti-pFAKY397 and FAK antibodies. (E) Relative levels of pFAKY397 shown in D (n = 4, mean ± SD, normalized to siRNA control, **p < 0.001, two-tailed t test).
FIGURE 8:
FIGURE 8:
LIMCH1 depletion decreases cell contraction and increases cell migration. (A) Cell extracts from siRNA-treated HeLa cells were immunoblotted with anti-LIMCH1 antibody. (B) Contraction images of HeLa cells grown in collagen matrix were captured by microscopy after 24 h of incubation. (C) Gel areas were measured at 6, 24, and 48 h (n = 3, mean ± SD, *p < 0.05, **p < 0.001, two-tailed t test). (D) Fluorescence images of the migrating HeLa cells (on the filters) stained with DAPI. (E) Migratory cells in D were quantified with Image-Pro software (n = 3, mean ± SD, ***p < 0.0001, two-tailed t test). (F) Distribution of migration speeds of HeLa cells on the fibronectin-coated coverslip. Migration speed was measured by tracking the path during an 8-h period. The average velocity is presented as scatter plots; the middle line shows the median value (n = 101–127 cells in three independent experiments, *p < 0.05, one-way ANOVA, Tukey’s multiple comparison test). (G) Binary images of HeLa cells were processed by ImageJ software. Cells were incubated on fibronectin-coated coverslips with CellTracker for 30 min; bar, 40 μm. (H) Cell areas in G were measured at 20 and 30 min (n = 126–140 cells in three independent experiments, mean ± SD, *p < 0.05, one-way ANOVA, Tukey’s multiple comparison test). (I) Cell attachment on fibronectin-coated coverslips was assessed at indicated time points with crystal violet staining.

References

    1. Aguilar-Cuenca R, Juanes-Garcia A, Vicente-Manzanares M. Myosin II in mechanotransduction: master and commander of cell migration, morphogenesis, and cancer. Cell Mol Life Sci. 2014;71:479–492. - PMC - PubMed
    1. Amano M, Ito M, Kimura K, Fukata Y, Chihara K, Nakano T, Matsuura Y, Kaibuchi K. Phosphorylation and activation of myosin by Rho-associated kinase (Rho-kinase) J Biol Chem. 1996;271:20246–20249. - PubMed
    1. Betapudi V. Myosin II motor proteins with different functions determine the fate of lamellipodia extension during cell spreading. PLoS One. 2010;5:e8560. - PMC - PubMed
    1. Breckenridge MT, Dulyaninova NG, Egelhoff TT. Multiple regulatory steps control mammalian nonmuscle myosin II assembly in live cells. Mol Biol Cell. 2009;20:338–347. - PMC - PubMed
    1. Cai Y, Biais N, Giannone G, Tanase M, Jiang G, Hofman J, Wiggins C, Silberzan P, Buguin A, Ladoux B, Sheetz M. Nonmuscle myosin IIA-dependent force inhibits cell spreading and drives F-actin flow. Biophys J. 2006;91:3907–3920. - PMC - PubMed