. 2017 Feb 15:8:3.
doi: 10.1186/s13100-017-0086-z. eCollection 2017.

Considerations and complications of mapping small RNA high-throughput data to transposable elements

Affiliations

Considerations and complications of mapping small RNA high-throughput data to transposable elements

Alexandros Bousios et al. Mob DNA. .

Abstract

Background: High-throughput sequencing (HTS) has revolutionized the way in which epigenetic research is conducted. When coupled with fully-sequenced genomes, millions of small RNA (sRNA) reads are mapped to regions of interest and the results scrutinized for clues about epigenetic mechanisms. However, this approach requires careful consideration in regards to experimental design, especially when one investigates repetitive parts of genomes such as transposable elements (TEs), or when such genomes are large, as is often the case in plants.

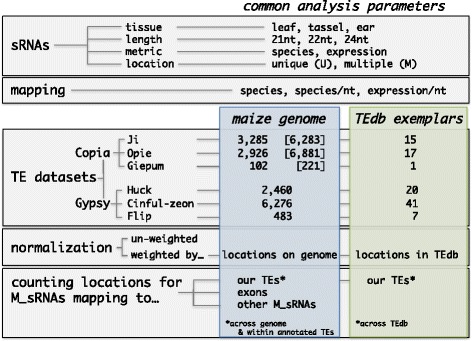
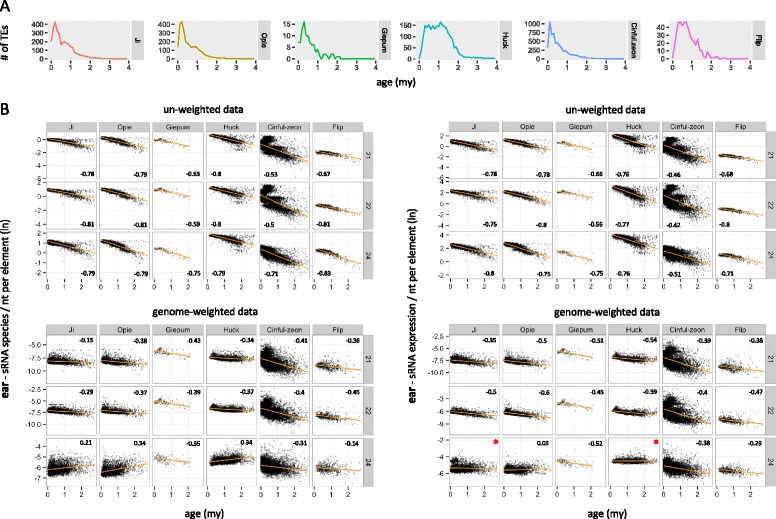
Results: Here, in an attempt to shed light on complications of mapping sRNAs to TEs, we focus on the 2,300 Mb maize genome, 85% of which is derived from TEs, and scrutinize methodological strategies that are commonly employed in TE studies. These include choices for the reference dataset, the normalization of multiply mapping sRNAs, and the selection among sRNA metrics. We further examine how these choices influence the relationship between sRNAs and the critical feature of TE age, and contrast their effect on low copy genomic regions and other popular HTS data.

Conclusions: Based on our analyses, we share a series of take-home messages that may help with the design, implementation, and interpretation of high-throughput TE epigenetic studies specifically, but our conclusions may also apply to any work that involves analysis of HTS data.

Keywords: Annotation; Bioinformatics; Genome mapping; High-throughput sequencing; RNA-seq; Small RNAs; Transposable elements; siRNAs.


Figures

Fig. 1
Fig. 1
A matrix of the terms, data and analyses used in this study. The coloured boxes contain information specific for the maize genome (blue) or the TE exemplar database (green). The numbers in brackets for the Copia families represent their complete full-length populations retrieved from MASiVEdb
Fig. 2
Fig. 2
sRNA metrics on TE exemplars and annotated TE populations. a Total number of sRNA species that mapped to each family. b Proportion of U_sRNA and M_sRNA species for all families combined
Fig. 3
Fig. 3
sRNA mapping along the sequences of Ji, Opie and Giepum exemplars and annotated populations. a Un-weighted sRNA data from ear tissue were mapped separately to the LTRs and the internal (INT) domain. Each region was first split in 100 equally sized windows, and mapping was calculated as the number of sRNA species per nucleotide of the sense (positive y-axis) and antisense (negative y-axis) strands, and visualized with a boxplot for each window. The position of the palindromes (LTRs) and the gag, pol and envelope (env) genes (INT domain) are shown at the bottom of each panel. b An example of the LTR sequence of an Opie exemplar with N nucleotides masking the unresolved palindrome-rich region
Fig. 4
Fig. 4
Relationship between TE age and sRNA mapping using un-weighted and genome-weighted approaches. a Age distribution in million years (my) of TE families. b Mapping of sRNA species (left panels) or expression (right panels) from ear tissue was calculated per nucleotide of full-length elements for each family. Age is cutoff at 3my to allow sufficient visualization of the x-axis. The Spearman r coefficient is shown for each plot, calculated for all elements and not only for those <3my. P values were <0.01, except those indicated by an asterisk
Fig. 5
Fig. 5
Proportion of the number of U_sRNA species that mapped per TE
Fig. 6
Fig. 6
Opie population split based on sRNA expression data from leaf tissue. a Relationship between TE age and number of sRNA species (left) or expression (right) calculated per nucleotide of the Opie LTRs and INT domain. Age is cutoff at 3my to allow sufficient visualization of the x-axis. The Spearman r coefficient is shown for each plot, calculated for all elements and not only for those <3my. b Mapping patterns (calculated as in Fig. 3a) of 24 nt expression data along the LTRs of the two distinct Opie subpopulations. sRNA data in A and B were not weighted by their number of genomic loci
Fig. 7
Fig. 7
Comparison of un-weighted and genome-weighted mRNA expression data mapping to TEs. a Family expression patterns. b Relationship between TE age and mRNA mapping. Age is cutoff at 3 million years (my) to allow sufficient visualization of the x-axis. The Spearman r coefficient is shown for each plot, calculated for all elements and not only for those <3my. P values were <0.01 in all cases. Library SRR531869 was used for A and B, because mapping patterns of the three replicate libraries to individual elements of the six families were highly correlated (Additional file 1: Figure S4)

References

    1. Castel SE, Martienssen RA. RNA interference in the nucleus: roles for small RNAs in transcription, epigenetics and beyond. Nat Rev Genet. 2013;14(2):100–112. doi: 10.1038/nrg3355. - DOI - PMC - PubMed
    1. Axtell MJ. Classification and comparison of small RNAs from plants. Annu Rev Plant Biol. 2013;64:137–159. doi: 10.1146/annurev-arplant-050312-120043. - DOI - PubMed
    1. Borges F, Martienssen RA. The expanding world of small RNAs in plants. Nat Rev Mol Cell Biol. 2015;16(12):727–741. doi: 10.1038/nrm4085. - DOI - PMC - PubMed
    1. Matzke MA, Mosher RA. RNA-directed DNA methylation: an epigenetic pathway of increasing complexity. Nat Rev Genet. 2014;15(6):394–408. doi: 10.1038/nrg3683. - DOI - PubMed
    1. An JY, Lai J, Lehman ML, Nelson CC. miRDeep*: an integrated application tool for miRNA identification from RNA sequencing data. Nucleic Acids Res. 2013;41(2):727–737. doi: 10.1093/nar/gks1187. - DOI - PMC - PubMed

LinkOut - more resources