. 2018 Jan;31(1):101-116.
doi: 10.1007/s10548-017-0546-2. Epub 2017 Feb 22.

EEG Signatures of Dynamic Functional Network Connectivity States

Affiliations

EEG Signatures of Dynamic Functional Network Connectivity States

E A Allen et al. Brain Topogr. 2018 Jan.

Abstract

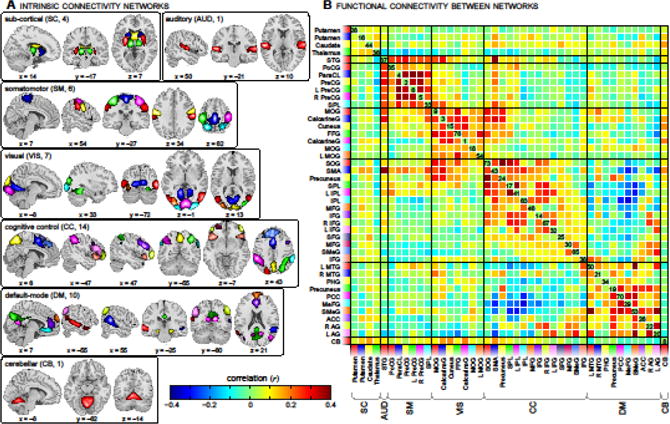
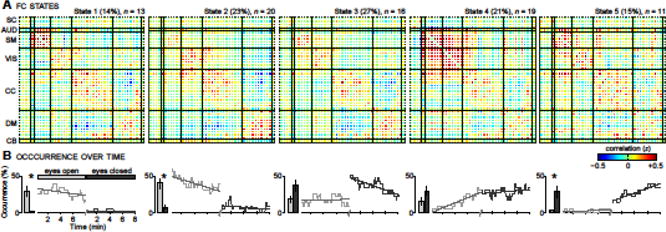
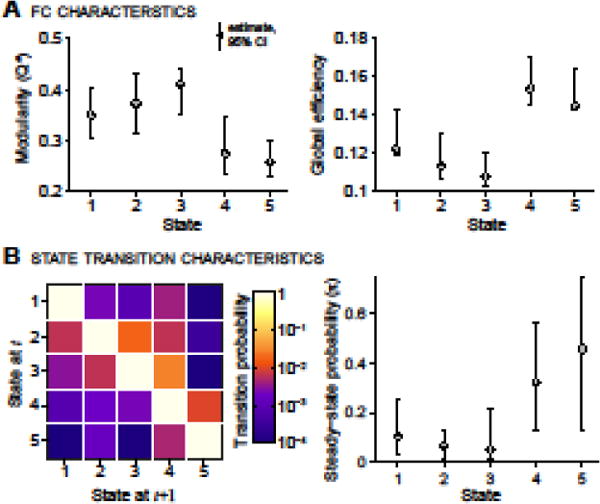
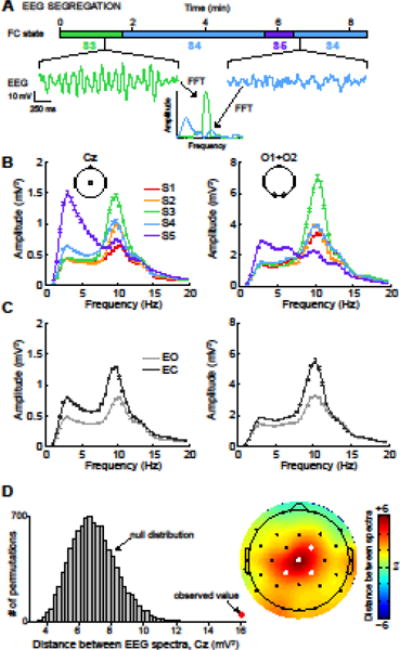
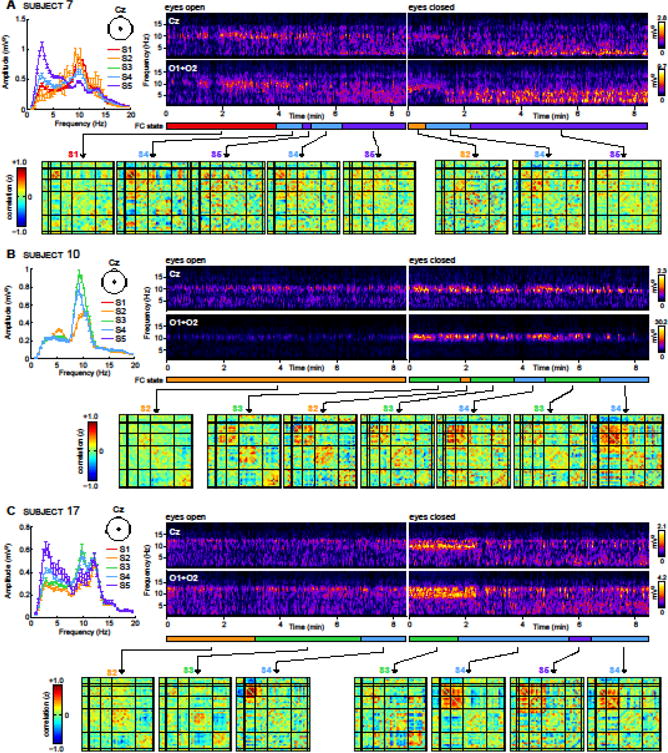
The human brain operates by dynamically modulating different neural populations to enable goal directed behavior. The synchrony or lack thereof between different brain regions is thought to correspond to observed functional connectivity dynamics in resting state brain imaging data. In a large sample of healthy human adult subjects and utilizing a sliding windowed correlation method on functional imaging data, earlier we demonstrated the presence of seven distinct functional connectivity states/patterns between different brain networks that reliably occur across time and subjects. Whether these connectivity states correspond to meaningful electrophysiological signatures was not clear. In this study, using a dataset with concurrent EEG and resting state functional imaging data acquired during eyes open and eyes closed states, we demonstrate the replicability of previous findings in an independent sample, and identify EEG spectral signatures associated with these functional network connectivity changes. Eyes open and eyes closed conditions show common and different connectivity patterns that are associated with distinct EEG spectral signatures. Certain connectivity states are more prevalent in the eyes open case and some occur only in eyes closed state. Both conditions exhibit a state of increased thalamocortical anticorrelation associated with reduced EEG spectral alpha power and increased delta and theta power possibly reflecting drowsiness. This state occurs more frequently in the eyes closed state. In summary, we find a link between dynamic connectivity in fMRI data and concurrently collected EEG data, including a large effect of vigilance on functional connectivity. As demonstrated with EEG and fMRI, the stationarity of connectivity cannot be assumed, even for relatively short periods.

Keywords: Concurrent EEG-fMRI; Dynamics; Functional network connectivity; Resting state; Vigilance.


Figures

Figure 1
Figure 1
ICN spatial maps (A) and the static FNC between them (B), averaged across 23 subjects in the EO condition. ICNs are divided into groups and arranged based on their anatomical and functional properties. Within each group, the color of the component in (A) corresponds to the colored flag shown along the axes of (B). ICN labels in (B) denote the brain region(s) with peak amplitude and refer to bilateral homologues unless specified as left (L) or right (R). See Table 1 for peak coordinates in each component. STG = superior temporal gyrus; PoCG = postcentral gyrus; ParaCL = paracentral lobule; PreCG = precentral gyrs; SPL = superior parietal lobule; MOG = middle occipital gyrus; FFG = fusiform gyrus; SOG = superior occipital gyrus; SMA = supplementary motor area; IPL = inferior parietal lobule; MFG = middle frontal gyrus; IFG = inferior frontal gyrus; SFG = superior frontal gyrus; SMeG = superior medial gyrus; MTG = middle temporal gyrus; PHG = parahippocampal gyrus; PCC = posterior cingulate cortex; MeFG = medial frontal gyrus; ACC = anterior cingulate cortex; AG = angular gyrus; CB = cerebellum
Figure 2
Figure 2
Clustering result for k = 5. Each cluster (State 1 to State 5) is summarized by its centroid (A), and occurrences as a function of time (B). The total percentage of occurrences (over EO and EC conditions) and the number of subjects that entered each state (n) is provided above each centroid. Bar plots in (B) compare the average occurrence in EO (light gray) and EC (dark gray) conditions. Error bars denote the standard error over subjects. Asterisks indicate a significant difference in state occurrence between EO and EC (P < 0.05, nonparametric permutation test, Bonferroni corrected for multiple comparisons). Dashed lines in (B) show the best linear fit to the occurrence trends.
Figure 3
Figure 3
Characterization of FNC states (A) and transitions between them (B). (A) Estimates of modularity (left) and global efficiency (right) of each connectivity state. (B) The state transition matrix (TM) averaged over subjects (left), and the stationary probability vector (π, principal eigenvector of the TM, right) which shows steady-state, or “long-run” behavior. Note that transition probability is color-mapped on a log-scale. In all plots, error bars indicate the non-parametric 95% confidence intervals (CIs) of each quantity, obtained by resampling subjects and recalculating the quantity on bootstrapped sample (500 repetitions).
Figure 4
Figure 4
EEG spectra, segregated by FNC state. (A) A schematic illustrating EEG segregation for a single subject. Spectra are computed for each 2 s epoch of EEG data and are divided into groups based on the FNC state vector from the concurrent fMRI data. (B) EEG spectra averaged over all epochs and subjects, segregated by FNC state. For comparison, EEG spectra segregated by eye condition are shown in panel (C). (D) Determination of the statistical significance of EEG spectral segregation. In the left panel, an example of the observed total Euclidean distance between EEG spectra (red dot) is compared to the null distribution of distances (gray) obtained via Monte Carlo permutation testing (see Methods). To facilitate visual comparisons in topographic displays, difference measures were converted to z-scores based on the mean and standard deviation of the null distributions at each channel. Filled white electrodes in the topoplots signify P <0.01, FDR corrected for multiple comparisons over channels.
Figure 5
Figure 5
Examples of EEG spectra and FNC dynamics for subject 7 (A), subject 10 (B), and subject 17 (C). For each subject, the upper panels display EEG spectrograms for EO and EC conditions at central (Cz) and occipital (O1 + O2) electrodes. Lower panels display dynamic FNC matrices, averaged over contiguous windows that are clustered into the same state. FNC state assignments are denoted with different colors beneath the spectrograms. The upper left panel displays average EEG power at Cz, segregated by FNC state, in the same format as Figure 3B.

Similar articles

Cited by

References

    1. Åkerstedt T, Arnetz BB, Anderzén I. Physicians during and following night call duty—41 hour ambulatory recording of sleep. Electroencephalogr Clin Neurophysiol. 1990;76:193–196. - PubMed
    1. Allen EA, Damaraju E, Plis SM, Erhardt EB, Eichele T, Calhoun VD. Tracking Whole-Brain Connectivity Dynamics in the Resting State. Cereb Cortex 2012 - PMC - PubMed
    1. Allen EA, Erhardt EB, Damaraju E, Gruner W, Segall JM, Silva RF, Havlicek M, Rachakonda S, Fries J, Kalyanam R, Michael AM, Caprihan A, Turner JA, Eichele T, Adelsheim S, Bryan AD, Bustillo J, Clark VP, Feldstein Ewing SW, Filbey F, Ford CC, Hutchison K, Jung RE, Kiehl KA, Kodituwakku P, Komesu YM, Mayer AR, Pearlson GD, Phillips JP, Sadek JR, Stevens M, Teuscher U, Thoma RJ, Calhoun VD. A baseline for the multivariate comparison of resting-state networks. Front Syst Neurosci. 2011;5:2. doi: 10.3389/fnsys.2011.00002. - DOI - PMC - PubMed
    1. Allen PJ, Josephs O, Turner R. A method for removing imaging artifact from continuous EEG recorded during functional MRI. Neuroimage. 2000;12:230–9. doi: 10.1006/nimg.2000.0599. - DOI - PubMed
    1. Altmann A, Schröter MS, Spoormaker VI, Kiem SA, Jordan D, Ilg R, Bullmore ET, Greicius MD, Czisch M, Sämann PG. Validation of non-REM sleep stage decoding from resting state fMRI using linear support vector machines. Neuroimage. 2016;125:544–555. - PubMed

Publication types

MeSH terms

LinkOut - more resources