. 2017 Feb 23:8:14319.
doi: 10.1038/ncomms14319.

Unraveling the processes shaping mammalian gut microbiomes over evolutionary time

Affiliations

Unraveling the processes shaping mammalian gut microbiomes over evolutionary time

Mathieu Groussin et al. Nat Commun. .

Abstract

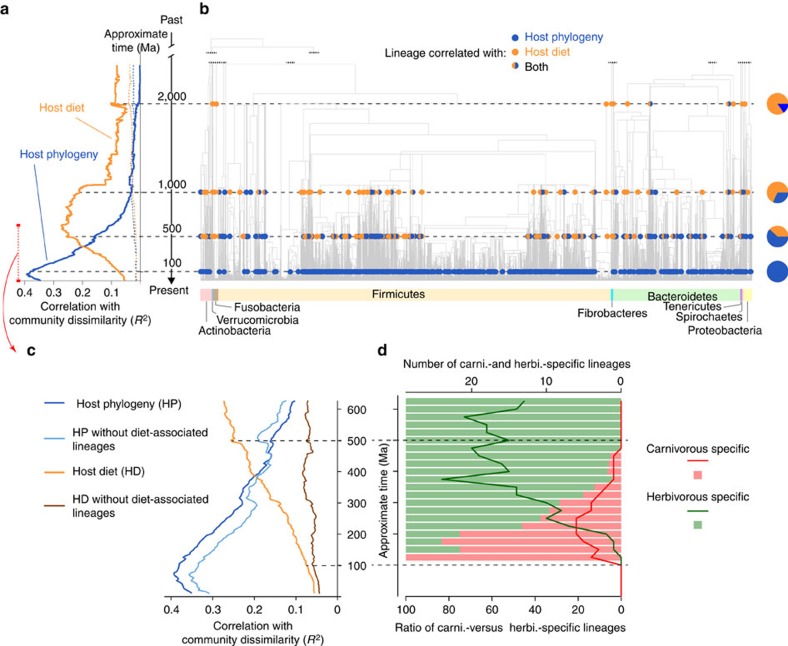
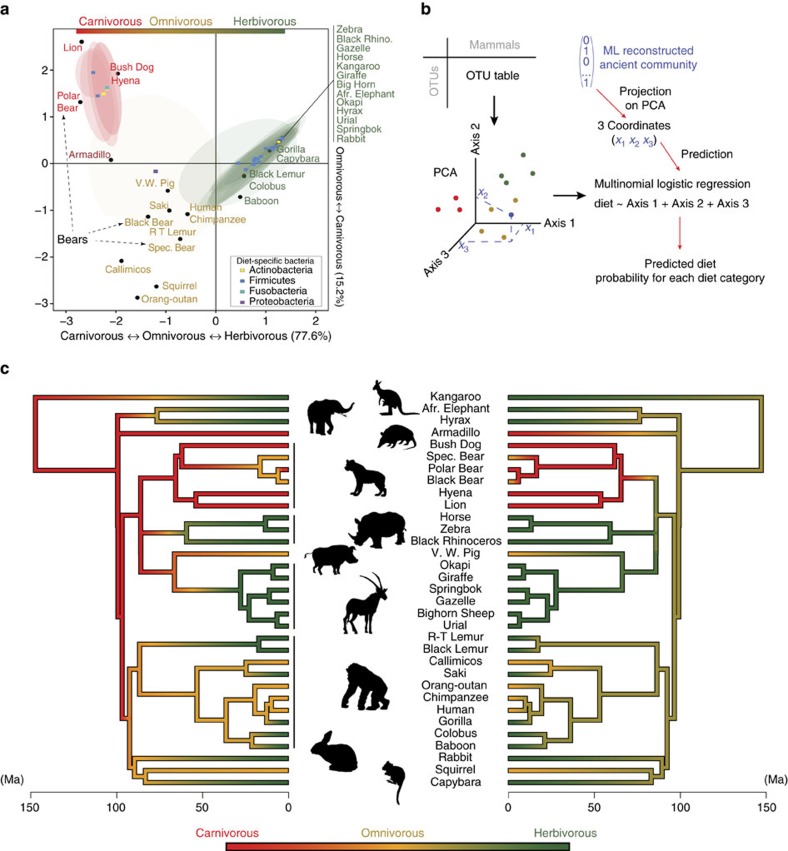
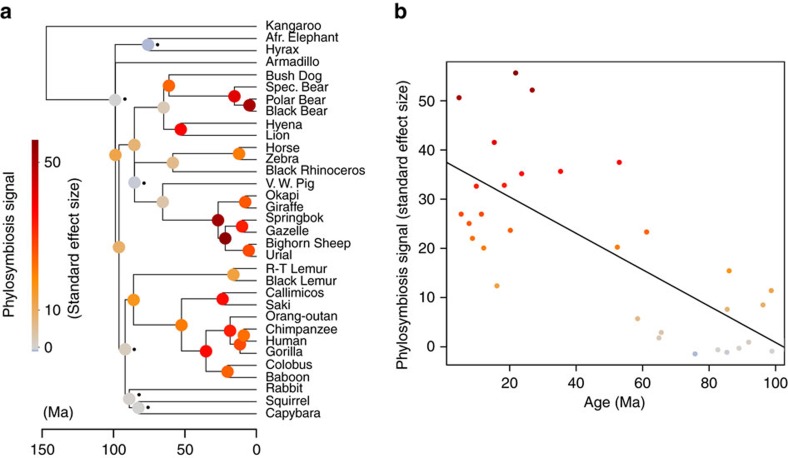
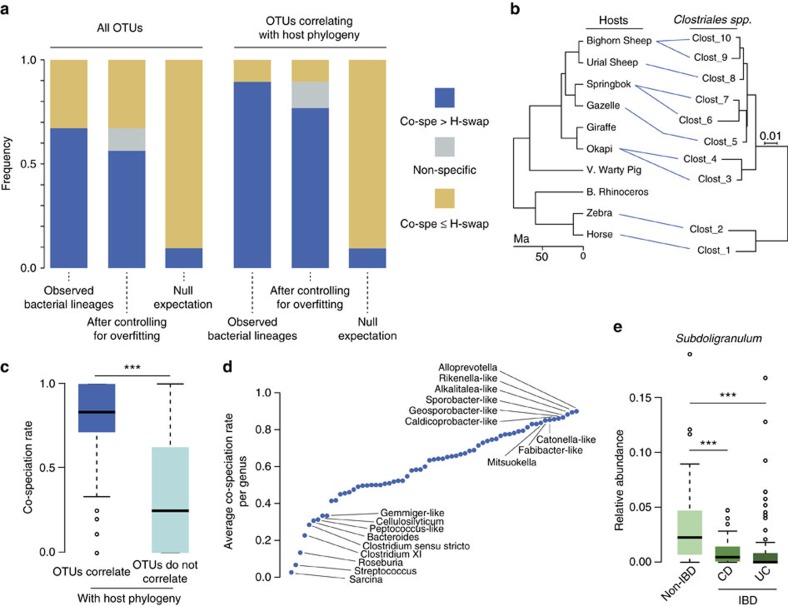
Whether mammal-microbiome interactions are persistent and specific over evolutionary time is controversial. Here we show that host phylogeny and major dietary shifts have affected the distribution of different gut bacterial lineages and did so on vastly different bacterial phylogenetic resolutions. Diet mostly influences the acquisition of ancient and large microbial lineages. Conversely, correlation with host phylogeny is mostly seen among more recently diverged bacterial lineages, consistent with processes operating at similar timescales to host evolution. Considering microbiomes at appropriate phylogenetic scales allows us to model their evolution along the mammalian tree and to infer ancient diets from the predicted microbiomes of mammalian ancestors. Phylogenetic analyses support co-speciation as having a significant role in the evolution of mammalian gut microbiome compositions. Highly co-speciating bacterial genera are also associated with immune diseases in humans, laying a path for future studies that probe these co-speciating bacteria for signs of co-evolution.


Conflict of interest statement

The authors declare no competing financial interests.

Figures

Figure 1
Figure 1. Phylogenetic-scale disparities in mammalian gut microbiomes.
(a,b) Bacterial lineages that diverge recently in evolutionary history show high levels of correlation with host phylogenetic distances (blue) while correlation with host dietary distances (orange) is greatest for more ancient lineages. (a) Lines show correlations between the pairwise Sørensen compositional dissimilarities and pairwise host phylogenetic or dietary distances (dashed lines: 95% null envelope). (b) Individual bacterial lineages correlated with diet or phylogeny (circles). Pie charts represent the percentage of lineages that correlate significantly with each factor at different times. The phylogenetic scale is common to plots a,b. (c) When diet-associated lineages (in b) are removed, correlation with host phylogeny (dark blue) still holds (light blue), but correlation with host diet does not (orange versus brown). (d) Each bacterial lineage having a significant correlation with diet (b) was called herbivorous- or carnivorous-specific if it is only found in herbivores or carnivores, respectively. Herbivory is associated with bacterial lineages that arise earlier in bacterial evolution than those associated with carnivory.
Figure 2
Figure 2. Gut microbiomes predict extant and ancestral mammalian diets.
(a) Diet-correlated bacterial lineages (squares coloured by phylum) and mammals (black dots) separated by dietary distances are jointly projected in the same ordination space using the OMI mapping procedure (see Methods). Predicted niche breadth of a bacterial lineage is depicted with an ellipse. The time period selected to define bacterial lineages is ∼300 Myr ago. Bacterial niche breadths show that many bacterial groups are herbivore or carnivore specific. However, no bacterial lineage has a niche breadth encompassing omnivores only (omnivores are in brown). (b) Workflow for microbiome-based prediction of ancient diet. (c) Inference of ancient mammalian diets. Left: trait-based reconstruction using 1,534 mammals. Right: Microbiota-based reconstruction with the 33 mammals under study. At each ancestor, the probability vector for each diet category is transformed into a linear variable bound between 0 (carnivorous) and 1 (herbivorous). Between two ancestors, diet is assumed to evolve linearly. Animal images courtesy of Julien Renaud.
Figure 3
Figure 3. Strong phylosymbiosis signal in mammals.
(a) Long-term persistence of host–microbiota associations in mammalian evolution. Mammalian phylogeny with internal nodes coloured according to the degree of possession of clade-specific compositions of bacteria (clade-specific phylosymbiosis signal) (see Methods). Black dots denote mammalian clades that do not harbour a significant phylosymbiotic signal (Permutation test, 999 permutations, P value>0.05). The weak phylosymbiosis signal in Rodents or Afrotheria is likely due to a poor sampling within these two groups. (b) Decay of the phylosymbiosis signal with time (x axis: age of the corresponding nodes).
Figure 4
Figure 4. Large-scale vertical inheritance of mammalian gut symbionts.
(a) Frequencies of bacterial lineages harbouring either more co-speciation (Co-spe.) or more host-swap (H-swap) events are shown, either for all OTUs or only for OTUs that are correlated with host phylogeny. Out of the 350 bacterial lineages correlated with host phylogeny and present in at least four hosts, 313 harbour more co-speciation events than host-swaps. Non-specific (grey) lineages are lineages with a non-significantly higher rate of co-speciation than the rate of host-swap. This higher observed rate may be due to overfitting to the host tree (see Methods). The Null Expectation bar represents the expected frequency of lineages harbouring more co-speciation than host-swaps by chance (see Methods). (b) Example of a co-speciating bacterial lineage belonging to the Clostridiales order. A blue line indicates the presence of a symbiont in a host. (c) OTUs correlated to host phylogeny harbour higher co-speciation rates than OTUs that are not. Co-speciation rate per OTU is defined as the amount of co-speciation events relative to the number of host-swap events (two-tailed Wilcoxon's rank-sum test, ***P value<0.001). (d) Average co-speciation rate per bacterial genus. For a full list of genera, see Supplementary Fig. 13. (e) Subdoligranulum has high co-speciation rates and is correlated with IBD in humans (two-tailed Wilcoxon's rank-sum test). CD, Crohn's disease; UC, ulcerative colitis. Other genera with similar patterns are shown in Supplementary Fig. 14.

References

    1. Moran N. A., McCutcheon J. P. & Nakabachi A. Genomics and evolution of heritable bacterial symbionts. Annu. Rev. Genet. 42, 165–190 (2008). - PubMed
    1. Bennett G. M. & Moran N. A. Heritable symbiosis: the advantages and perils of an evolutionary rabbit hole. Proc. Natl Acad. Sci. USA 112, 10169–10176 (2015). - PMC - PubMed
    1. Sachs J. L., Skophammer R. G. & Regus J. U. Evolutionary transitions in bacterial symbiosis. Proc. Natl Acad. Sci. USA 108, (Suppl 2): 10800–10807 (2011). - PMC - PubMed
    1. Ochman H. et al. Evolutionary relationships of wild hominids recapitulated by gut microbial communities. PLoS Biol. 8, e1000546 (2010). - PMC - PubMed
    1. Brucker R. M. & Bordenstein S. R. The hologenomic basis of speciation: gut bacteria cause hybrid lethality in the genus Nasonia. Science 341, 667–669 (2013). - PubMed

Publication types

LinkOut - more resources