

Compiler-aided systematic construction of large-scale DNA strand displacement circuits using unpurified components
- PMID: 28230154
- PMCID: PMC5331218
- DOI: 10.1038/ncomms14373
Compiler-aided systematic construction of large-scale DNA strand displacement circuits using unpurified components
Abstract
Biochemical circuits made of rationally designed DNA molecules are proofs of concept for embedding control within complex molecular environments. They hold promise for transforming the current technologies in chemistry, biology, medicine and material science by introducing programmable and responsive behaviour to diverse molecular systems. As the transformative power of a technology depends on its accessibility, two main challenges are an automated design process and simple experimental procedures. Here we demonstrate the use of circuit design software, combined with the use of unpurified strands and simplified experimental procedures, for creating a complex DNA strand displacement circuit that consists of 78 distinct species. We develop a systematic procedure for overcoming the challenges involved in using unpurified DNA strands. We also develop a model that takes synthesis errors into consideration and semi-quantitatively reproduces the experimental data. Our methods now enable even novice researchers to successfully design and construct complex DNA strand displacement circuits.
Conflict of interest statement
The authors declare no competing financial interests.
Figures
 and
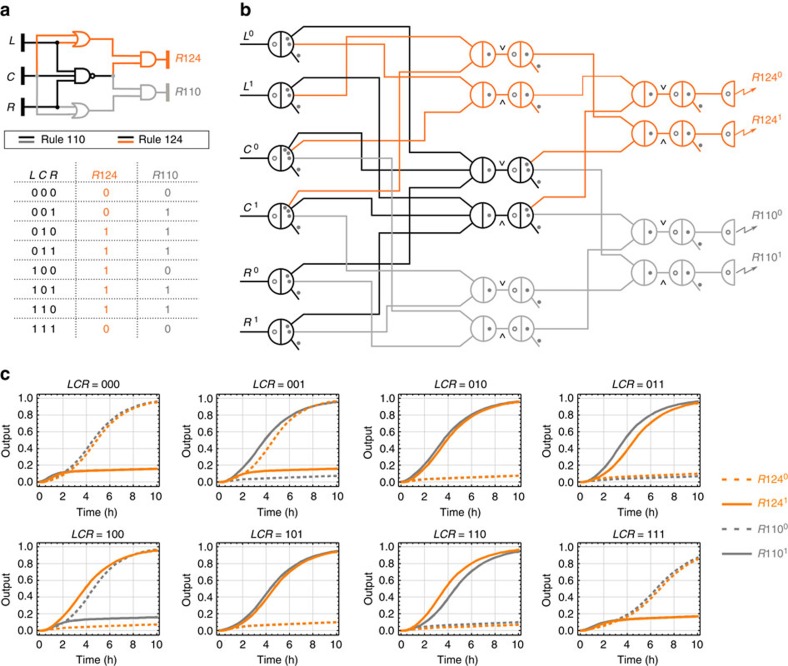
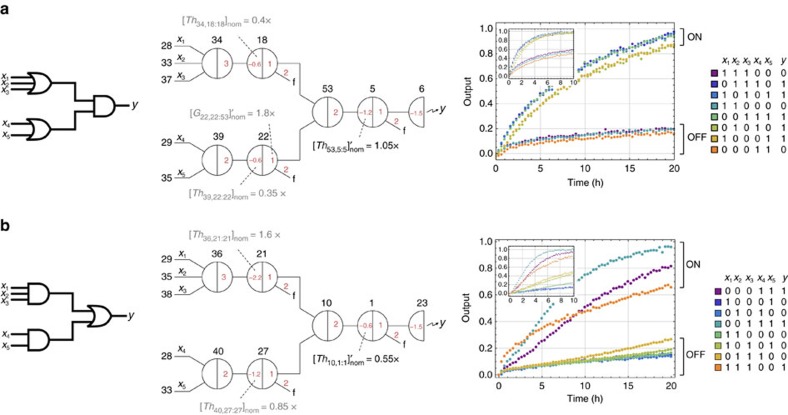
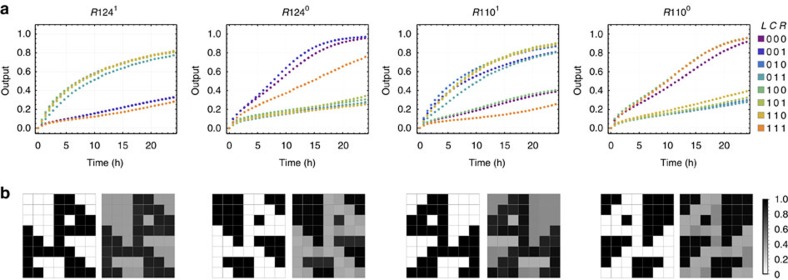
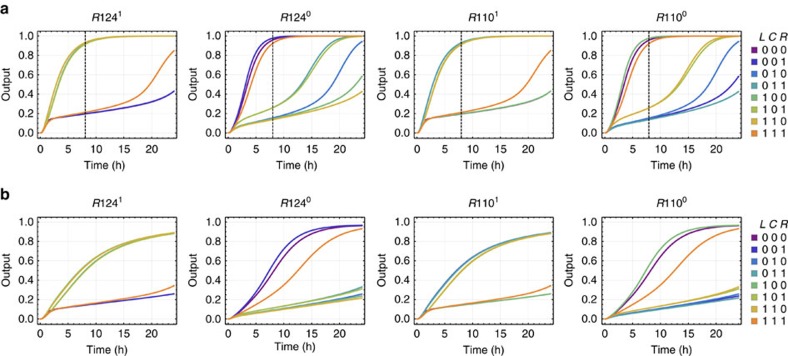
and  implements a dual-rail AND and OR gate, respectively. Each pair of dual-rail AND and OR gates implements an AND, OR or NAND gate in the original logic circuit. Each dual-rail output is converted to a fluorescence signal through a reporter, indicated as a half node with a zigzag arrow. Each circle and dot inside a seesaw node indicates a double-stranded threshold and gate molecule, respectively. Each dot on a wire indicates a single-stranded fuel molecule. (c) Simulations of the DNA strand displacement circuit using the previously developed model for purified seesaw circuits. Trajectories and their corresponding outputs have matching colours. Overlapping trajectories were shifted to be visible. Dotted and solid lines indicate dual-rail outputs that represent logic OFF and ON, respectively. For example, when input LCR=001, meaning L0, C0 and R1 were introduced at a high concentration and L1, C1 and R0 at a low concentration, two output trajectories R1240 and R1101 reached an ON state and the other two output trajectories R1241 and R1100 remained in an OFF state, indicating that the output was computed to be 0 and 1 for rule 124 and 110, respectively. Simulations were performed at 1 × =50 nM—the compiler recommended standard concentration for large-scale purified seesaw circuits.
References
Publication types
MeSH terms
Substances
LinkOut - more resources
Full Text Sources
Other Literature Sources
Research Materials
