. 2017 Feb 23:8:14484.
doi: 10.1038/ncomms14484.

Drebrin-mediated microtubule-actomyosin coupling steers cerebellar granule neuron nucleokinesis and migration pathway selection

Affiliations

Drebrin-mediated microtubule-actomyosin coupling steers cerebellar granule neuron nucleokinesis and migration pathway selection

Niraj Trivedi et al. Nat Commun. .

Abstract

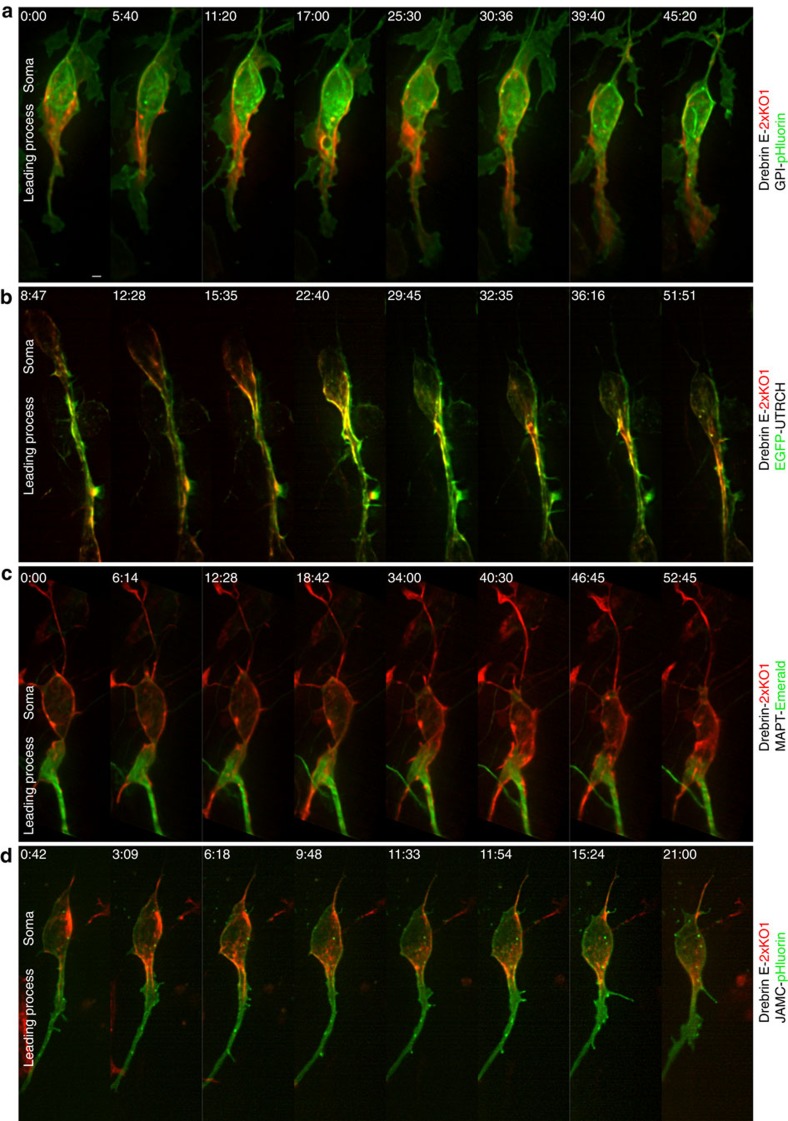
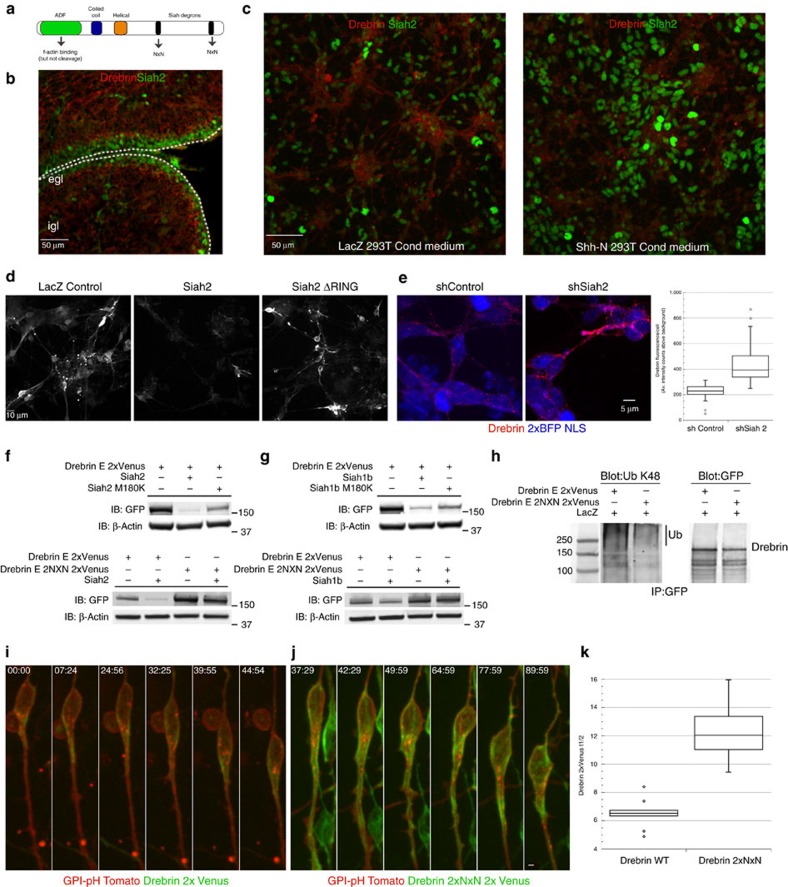
Neuronal migration from a germinal zone to a final laminar position is essential for the morphogenesis of neuronal circuits. While it is hypothesized that microtubule-actomyosin crosstalk is required for a neuron's 'two-stroke' nucleokinesis cycle, the molecular mechanisms controlling such crosstalk are not defined. By using the drebrin microtubule-actin crosslinking protein as an entry point into the cerebellar granule neuron system in combination with super-resolution microscopy, we investigate how these cytoskeletal systems interface during migration. Lattice light-sheet and structured illumination microscopy reveal a proximal leading process nanoscale architecture wherein f-actin and drebrin intervene between microtubules and the plasma membrane. Functional perturbations of drebrin demonstrate that proximal leading process microtubule-actomyosin coupling steers the direction of centrosome and somal migration, as well as the switch from tangential to radial migration. Finally, the Siah2 E3 ubiquitin ligase antagonizes drebrin function, suggesting a model for control of the microtubule-actomyosin interfaces during neuronal differentiation.


Conflict of interest statement

The authors declare no competing financial interests.

Figures

Figure 1
Figure 1. Drebrin protein is expressed in differentiated CGNs and is dynamically localized to the leading process during two-stroke motility.
(ac) Immunohistochemical examination of drebrin expression in the P7 mouse cerebellum. In the P7 cerebellum, drebrin (red) is complementarily expressed with the GNP markers Ki67 (green) (a) or Zeb1 (green) (b) and is co-expressed in differentiated CGNs with p27Kip (green) (c), scale bar for each image equals 50 μm. Drebrin A expression (red) is minimal at P7 (d), scale bar, 10 μm. (eg) Immunocytochemical examination of drebrin expression in CGNs grown in culture. Expression of drebrin protein (green) is coincident with myosin IIB, alpha-tubulin, and drebrin phospho-Ser142 immunoreactivity (all red) (lp=leading process), scale bar for each equals 5 μm. (h) Drebrin (labelled with drebrin E 2x-KO1, red) is initially localized in the cell body but becomes restricted to the leading process f-actin domain, where it appears to contract around the time of somal translocation. Around the time of local contraction, bending is observed in the microtubule cytoskeleton (labelled by YFP-Map2C, white arrows). Scale bar, 10 μm. Time stamp=hours:min:sec. (i) Adaptive volumetric kymographs of the sequences shown in h: the leading process and direction of migration is towards the right of the panel (dashed blue line=somal boundaries; solid blue line=soma centre; red=drebrin E 2x-KO1; green=YFP-Map2C). The yellow box highlights the time-lapse frames shown in h, in which a subpopulation of drebrin flows down the leading process in the direction of migration before the contraction of the leading process drebrin domain. Arrows indicate the borders of the drebrin domain as it contracts during a migration cycle. (j) Analysis of the percentage of regional drebrin localization signal in the soma and leading or trailing process in migrating neurons expressing drebrin E 2x-KO1, in which drebrin accumulates in the leading process in the active phase of migration.
Figure 2
Figure 2. LLS microscopy reveals unappreciated relationships between cytoskeleton and plasma membrane in the proximal leading process.
CGNs cultured in conditions that recapitulate radial migration were electroporated with expression vectors encoding the indicated fluorescently labelled live-cell imaging probes. The displayed images are maximum intensity projections of selected time points of cultures imaged via LLS microscopy 18–24 h post transfection. Scale bar, 2 μm. (a) Simultaneous imaging of plasma membrane (GPI-pHluorin, green) and drebrin (labelled with drebrin E 2x-KO1, red) reveals that drebrin is submembranous during its anterograde translocation. (b) f-Actin (labelled with EGFP-UTRCH, green) accumulates in the leading process before somal translocation. Initially, drebrin (labelled with drebrin E 2x-KO1, red) is localized mostly in the cell body but becomes restricted to the leading process f-actin domain. (c) Debrin (labelled with drebrin E 2x-KO1, red) accumulates around microtubules located in a well-dilated proximal leading process (labelled with MAPT-Emerald, green) before somal translocation. Note that drebrin appears to be more cortically restricted than the microtubules. (d) Simultaneous imaging of JAM-C adhesions (JAM-C-pHluorin, green) and drebrin (labelled with drebrin E 2x-KO1, red) reveals that a subset of JAM-C adhesions are located in the drebrin contractile domain. Scale bar, 2 μm (a). Time stamp=min:sec.
Figure 3
Figure 3. SR-SIM reveals that f-actin and drebrin form a cortical collar around microtubules in the proximal leading process.
(a,b) SR-SIM imaging of CGNs with dilated proximal leading processes expressing (a) GPI-pHluorin (green), drebrin E 2x-KO1 (red) and SiR-tubulin (blue; n=21 cells analysed) or (b) EGFP-UTRCH (green), Drebrin E 2x-KO1 (red) and SiR-tubulin (blue; n=18 cells analysed). Scale bar, 1 μm (a). The RGB plot to the right of each representative image shows the well-resolved Gaussian FWHM peaks detected for the line scan in each image (dashed white line). The box plots at far right show the measured distances between the centroid positions of the Gaussian peak for each fluorescent probe. Whiskers on the box plot show maximum and minimum data points, box borders show first and third quartiles and the line in the box show the median. (c) Drebrin is an f-actin and +TIP binding protein. Consistent with this interaction, LLS microscopy shows that microtubule +TIPs (labelled with EB3-2x Venus, green) pass through the drebrin E-labelled domain (labelled with drebrin E 2x-KO1, red) in the proximal leading process. Scale bar, 2μm (c). Time stamp=min:sec.
Figure 4
Figure 4. Ex vivo analysis of drebrin loss of function.
(a) Cerebella from P7 mice were electroporated, and slices grown in ex vivo culture for 48 h. CGNs were electroporated with a vector encoding H2B-mCherry either alone or in combination with the indicated expression vectors. EB1M and EB3M expression was driven in GNPs using pMath1 and in CGNs using pNeuroD. Each representative image is oriented with the cerebellar slice surface to the left, and the presence of red nuclei in the centre or right of the image indicates cells that have left the GZ. The histograms below each representative image show the binned migration distance distribution for each condition (n≥2,500 cells analysed for each condition, χ2 test P value <0.01 between each condition and its control), and the graph to the right shows the average migration distances (P<0.05 for all conditions by Student's t-test). The migration distance graph for each micrograph is scaled to its accompanying image, thus providing the equivalent of a scale bar. (b) Live imaging of ex vivo pNeuroD EB1M and EB3M slices confirms migration defects. Representative images in which the cerebellar surface is oriented at the top show the position of H2B-mCherry-labelled nuclei at 2-h intervals. Coloured arrowheads show the relative positions of cells in each frame, and the insets illustrate morphology of cells under each condition. (c) Angle analysis of cells tracked in live-cell imaging experiments (n>69 cells for each condition). FDVs were calculated and compared with IDVs for each time. Polar plots representing efficiency show that EB1M-expressing cells had more efficient movements corresponding to their FDV than did EB3M-expressing cells. (d) The mean squared displacement (MSD), a Brownian motion measure, was also calculated for each time point of the imaging sequences. The population of EB3M cell movements has more low MSD values, indicating random motion in these cells. (e) Radial histogram of the tangential and radial migration angles. Tangential angles are parallel to the 0° to 180° axis (that is, parallel to the slice surface), whereas radial angles are oriented towards 90° (that is, perpendicular to the slice surface). Scale bar, 10 μm. Error bars show ±s.d.
Figure 5
Figure 5. Drebrin function is required for directed movement of two-stroke motility in vitro.
CGNs were transfected with expression vectors encoding Centrin2-Venus, H2B-mCherry and the indicated experimental constructs. Time-lapse imaging was used to monitor two-stroke nucleokinesis in migrating CGNs in which drebrin was silenced (a,b) (n≥57 cells analysed for each condition and organelle) or when the dominant-negative EB3M was overexpressed (c,d) (n≥70 cells analysed for each condition and organelle). The multicolour images in a,c show nuclear positions for selected time points from representative imaging sequences, whereas b,d show centrosome positions (see the colour key for time points). A polar efficiency and an MSD plot are provided for each organelle. Drebrin loss of function and dominant-negative inhibition of plus-end binding is accompanied by less efficient somal and centrosome motility relative to calculated FDVs. Scale bars, 10μm. Error bars show ±s.d.
Figure 6
Figure 6. Drebrin–microtubule interactions are required for proximal leading process microtubule movement in vitro.
CGNs were transfected with expression vectors encoding photoactivatable EGFP-α-tubulin (green), RFP-UTRCH-ABD (f-actin label, red), or the indicated EB3M and drebrin shRNA constructs. (a) Schematic of the photoactivation strategy: a 405-nm laser was used to activate a microtubule fiduciary mark within well-dilated CGN proximal leading processes, and time-lapse imaging was used to monitor fiduciary mark movement during two-stroke nucleokinesis. Movements with positive values were towards the distal tip of the leading process (that is, in the direction of migration), whereas negative movement values were towards the cell body. (b) Box plot showing the average advance of the fiduciary mark in control, EB3M-expressing or drebrin-silenced CGNs. Control marks moved in the direction of migration, whereas the marks in EB3M-expressing cells retreated towards the soma (n=15 for control, 27 for EB3M-expressing and 15 for drebrin-silenced cells, P<0.01 for average advance by Student's t-test). (c) Representative time-lapse frames for each condition: the soma is oriented at the top of each frame, with the leading process oriented down. A circle shows the site of photoactivation, and an arrow highlights the centroid of the fiduciary mark in each frame. Scale bar, 5 μm (c). Whiskers on the box plot shows maximum and minimum data points, box borders show first and third quartiles and the line in the box show the median.
Figure 7
Figure 7. Siah ubiquitin ligases regulate drebrin protein levels.
(a) Drebrin domain structure: the C terminus contains two VxP Siah degrons that can be mutated to NxN to inhibit Siah sensitivity. (b) Immunohistochemical examination of drebrin expression in the P7 cerebellum. Drebrin (red) expression is low in Siah2-expressing GNPs (green). Scale bar, 50 μm. (c) Immunocytochemical examination of drebrin expression in CGN cultures treated with Shh-N-conditioned medium or LacZ-transfected control. Drebrin (red) expression is lower and Siah2 expression higher (green) in Shh-treated cultures, providing a physiological context for drebrin regulation during differentiation. Scale bar, 50 μm. (d) CGNs co-nucleofected with drebrin E 2xVenus and Siah2-myc exhibit lower drebrin signal, but not when Siah2-ΔRING is co-expressed. Scale bar, 10 μm. (e) Siah2 silencing enhances endogenous drebrin expression in cultured CGNs. CGNs were nucleofected with expression vectors, where a control or Siah2 miR30 shRNA was embedded into the 3′ UTR of a 2xBFP NLS cDNA. After drebrin immunostaining, expression levels were measured and displayed in the accompanying graph. Scale bar, 5 μm (Student's t-test P<0.01). (f) Top: western blotting shows Siah2 expression reduces drebrin protein levels in HEK293 cells, while the Siah2 M180K substrate binding mutant is less efficient at reducing drebrin levels. Bottom: western blotting shows that drebrin E-2xNxN 2x Venus is more abundant at basal level and less sensitive to Siah2 expression than wild-type drebrin E-2x Venus. (g) Top: western blotting shows Siah1b expression reduces drebrin protein levels in HEK293 cells, while the Siah2 M180K substrate-binding mutant is less efficient at reducing drebrin levels. Bottom: western blotting shows that drebrin E-2xNxN 2x Venus is more abundant at basal level and less sensitive to Siah1b expression than wild type drebrin E-2x Venus. (h) Wild type and 2xNxN drebrin 2xVenus were immunoprecipitated from HEK293 cell extracts and then blotted with antibodies against K48 poly-ubiquitin and EGFP. Wild-type drebrin is significantly more labelled with K48. (i,j) Primary CGNs were nucleofected with expression vectors encoding drebrin E-2xVenus wt or the 2xNxN mutant and GPI-pH Tomato. Time-lapse imaging was used to examine the dynamics of wild type and NxN mutant drebrin in migrating CGNs. Note: images are equally scaled to reflect relative abundance drebrin signals. (i) Wild-type drebrin (green) is localized as described in Figs 2 and 3. (j) Drebrin E 2NxN is more abundant and spreads farther down the leading process, consistent with the increased protein expression observed in HEK293 cells. Time stamp=min:sec. Scale bar, 2 μm. (k) FRAP analysis of drebrin 2xVenus wt or 2NxN in the CGN leading process. Drebrin wild type (n=9 cells) or NxN (n=10 cells) was photobleached in regions of interest in the proximal leading process of primary CGNs. The average recovery time of drebrin wild type was 6.5 s and drebrin 2xNxN was 12.25 s, indicating that Siah-insensitive drebrin possesses a longer dwell time in the CGN leading process (Student's t-test P<0.01).
Figure 8
Figure 8. Siah2 antagonizes drebrin function.
(a) CGNs in culture expressed Emerald MAPT and RFP LIFEACT to label the microtubule and actin cytoskeleton. Time-lapse imaging shows that Siah2-insensitive drebrin NxN rescues a Siah2 gain-of-function phenotype. Top row: Control CGNs have long neurites. Middle row: Siah2 gain of function inhibits CGN neurite extension, induces a radial microtubule cytoskeleton and locks CGNs in a mesenchymal morphology. Bottom row: CGNs expressing drebrin NxN and Siah2 have neurites and microtubule cytoskeleton similar to controls. Scale bar, 10 μm. (b) Quantitation of imaging sequences shown in a (n≥337 cells analysed for each condition, P<0.01 by Student's t-test for differences between the Siah2 condition and the control or Siah2+drebrin NxN). (c) CGNs were transfected with expression vectors encoding Centrin2-Venus, H2B-mCherry, and the indicated constructs. Time-lapse imaging was used to monitor two-stroke nucleokinesis in migrating CGNs in which Siah2 was overexpressed or rescued with drebrin NxN (n≥107 cells analysed for each condition). The multicolour images show nuclear/centrosome positions for selected time points from representative imaging sequences, and the polar Efficiency and MSD plots display movement characteristics. Siah2 gain of function randomized nuclear and centrosome positions, but only nuclear position is rescued by drebrin NxN. Scale bar, 5 μm. (d) Cerebella from P7 mice were electroporated and slices grown in ex vivo culture for 48 h. The cells were electroporated with a vector encoding H2B-mCherry either alone or in combination with the indicated expression vectors. Each representative image is oriented with the cerebellar slice surface to the left; the red nuclei in the centre or right of the image indicate cells that have left the GZ. The histograms below each representative image show the binned migration distance distribution for each condition (n≥3,893 cells analysed for each condition, P<0.01 by χ2 test for each condition and its control). The graphs to the right show the average migration distances (P<0.05 by Student's t-test for all conditions). The migration distance graph for each micrograph is scaled to its accompanying image, providing the equivalent of a scale bar for each image. Error bars show ±s.d.

Similar articles

Cited by

References

    1. Hatten M. E. Central nervous system neuronal migration. Annu. Rev. Neurosci. 22, 511–539 (1999). - PubMed
    1. Wynshaw-Boris A. & Gambello M. J. LIS1 and dynein motor function in neuronal migration and development. Genes Dev. 15, 639–651 (2001). - PubMed
    1. Metin C., Vallee R. B., Rakic P. & Bhide P. G. Modes and mishaps of neuronal migration in the mammalian brain. J. Neurosci. 28, 11746–11752 (2008). - PMC - PubMed
    1. Reiner O. & Sapir T. LIS1 functions in normal development and disease. Curr. Opin. Neurobiol. 23, 951–956 (2013). - PubMed
    1. Heng J. I., Chariot A. & Nguyen L. Molecular layers underlying cytoskeletal remodelling during cortical development. Trends Neurosci. 33, 38–47 (2010). - PubMed

Publication types

LinkOut - more resources