Review
. 2017 Feb 23;20(3):353-364.
doi: 10.1038/nn.4502.

Network neuroscience

Affiliations
Review

Network neuroscience

Danielle S Bassett et al. Nat Neurosci. .

Abstract

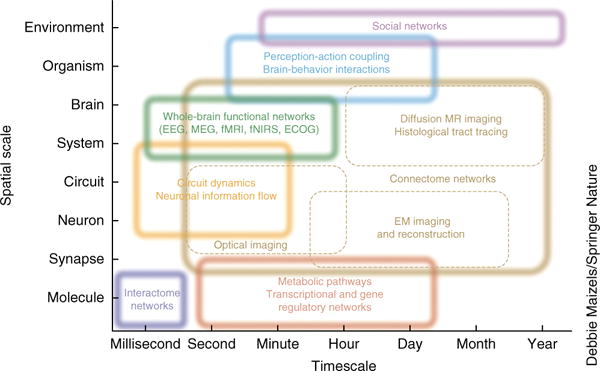
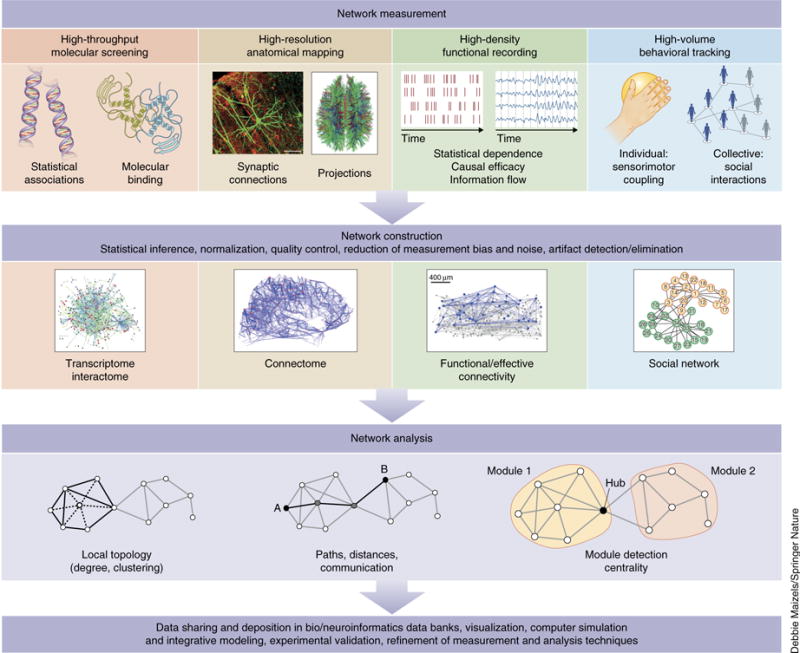
Despite substantial recent progress, our understanding of the principles and mechanisms underlying complex brain function and cognition remains incomplete. Network neuroscience proposes to tackle these enduring challenges. Approaching brain structure and function from an explicitly integrative perspective, network neuroscience pursues new ways to map, record, analyze and model the elements and interactions of neurobiological systems. Two parallel trends drive the approach: the availability of new empirical tools to create comprehensive maps and record dynamic patterns among molecules, neurons, brain areas and social systems; and the theoretical framework and computational tools of modern network science. The convergence of empirical and computational advances opens new frontiers of scientific inquiry, including network dynamics, manipulation and control of brain networks, and integration of network processes across spatiotemporal domains. We review emerging trends in network neuroscience and attempt to chart a path toward a better understanding of the brain as a multiscale networked system.


Conflict of interest statement

COMPETING FINANCIAL INTERESTS

The authors declare no competing financial interests.

Figures

Figure 1
Figure 1
Networks on multiple spatial and temporal scales. Network neuroscience encompasses the study of very different networks encountered across many spatial and temporal scales. Starting from the smallest elements, network neuroscience seeks to bridge information encoded in the relationships between genes and biomolecules to the information shared between neurons. It seeks to build a mechanistic understanding of how neuron-level processes give rise to the structure and function of large-scale circuits, brain systems and whole-brain structure and function. However, network neuroscience does not stop at the brain, but instead asks how these patterns of interconnectivity in the CNS drive and interact with patterns of behavior: how perception and action are mutually linked and how brain-environment interactions influence cognition. Finally, network neuroscience asks how all of these levels of inquiry help us to understand the interactions between social beings that give rise to ecologies, economies and cultures. Rather than reducing systems to a list of parts defined at a particular scale, network neuroscience embraces the complexity of the interactions between the parts and acknowledges the dependence of phenomena across scales. Box dimensions give outer bounds of the spatial and temporal scales at which relational data are measured and interactions unfold, and over which networks exhibit characteristic variations and dynamic changes. Inspired by an iconic image of neuroscience recording methods, last updated in ref. . ECOG, intracranial electrocorticography; EEG, electroencephalography; fMRI, functional magnetic resonance imaging; fNIRS, functional near-infrared spectroscopy; MEG, magnetoencephalography.
Figure 2
Figure 2
Network measurement, construction and analysis. Top, network neuroscience begins with the collection of relational data among elements of a neurobiological system. These data may refer to statistical associations among genes, physical binding events among macromolecules, anatomical networks of synaptic connections or inter-regional projections, multi-dimensional time series and their statistical dependencies or causal relations, or links in behavior, such as dynamic couplings among sensors and effectors in individuals or collective social interactions. Middle, once collected, relational data are generally subject to normalization, artifact and noise reduction before being assembled into the mathematical form of a graph or network, consisting of nodes (elements) and edges (their relations). Common examples are transcriptome and interactome networks, connectomes, networks of functional and effective connectivity, and social networks. Bottom, the common mathematical framework of graph theory offers a set of measures and tools for network analysis. As we argue in this review, descriptive measures such as the ones shown here are but a first step toward more powerful analysis and modeling approaches, such as generative modeling, prediction and control. Finally, network data are generally shared in large repositories, and numerous follow-up tool kits allow sophisticated visualization and simulation. Continual refinement of measurement, construction and analysis techniques ensures that the shape of this diagram will change as the field of network neuroscience matures. Image of functional/effective connectivity reproduced from ref. , Society for Neuroscience.
Figure 3
Figure 3
Algebraic topology and simplicial complexes. (a) Left, the traditional way in which to study networked systems including the brain is to examine patterns in pairwise relationships between nodes (dyads). Indeed, the dyad has traditionally been the fundamental unit of interest in graph theory and network science. Here we show an example brain network, composed exclusively of dyads. Right, in many cases, however, neural systems appear to employ higher order interactions, which increase the complexity of neural codes that produce the wide range of behaviors observed in these systems. To study these higher order interactions, one must expand one’s worldview to include units of interest that exceed the simple dyad. Using recent advances in the field of applied algebraic topology, we can study so-called simplicial complexes, which are generalizations of graphs that encode non-dyadic relationships63. Here we show representations of a zero-simplex (a node), a one-simplex (an edge between two nodes), a two-simplex (a filled triangle), etc. (b) Left, we can study the location of these simplices in brain networks, from the small scale of neurons to the large scale of brain regions. For example, we show a toy simplicial complex embedded in the human brain, and containing a zero-simplex, several one-simplices, a two-simplex and a three-simplex. Right, when doing so, it is interesting to characterize the locations of cliques (all-to-all connected subgraphs of any size) and cavities (a collection of n-simplices that are arranged so that they have an empty geometric boundary), which are structurally predisposed to be critical for in integrated (cliques) versus segregated (cavities) codes and computations. Here we show a two-clique (top) and a cavity bounded by four one-simplices (bottom). (c) It is also often interesting to study how networks evolve in time or how their internal structure depends on the weight of the edges between nodes. In these and similar scenarios, we can apply a powerful tool from algebraic topology called a filtration, which can represent a weighted simplicial complex as a series of unweighted simplicial complexes. We can then trace the evolution of specific cavities from one complex (one time point or one edge weight value) to another, as well as locate the moment of their creation or collapse. Collectively, this is called the persistent homology of the weighted simplicial complex, and it can be statistically quantified using a collection of functions called Betti curves, which record the number of cavities in each dimension. Here we show a filtration on edge weight, which begins with all nodes being disconnected because no edges exceed a threshold value τ. At subsequent points along the filtration, those nodes are connected by simplices that are composed of edges of weight greater than or equal to τ. This same sort of structure can be observed in a filtration of a growing network over time: the filtration begins with all nodes being disconnected because no edges exist. At subsequent points along the filtration, those nodes are connected by simplices that are composed of edges that have grown at later time points. Thus, filtrations allow the investigator to assess the organization of weighted simplicial complex representations of brain structure and dynamics as a function of edge weight, or as a function of time.
Figure 4
Figure 4
Dynamic and multilayer networks. In the field of network science, two types of dynamic processes are studied in some detail: dynamics on networks and dynamics of networks. (a) Dynamics on networks indicates that the activity (or some other property of interest) of nodes changes as a function of time. Here we illustrate decreasing activity (pink), increasing activity (gray) and changes in the pattern of activity (blue) over time in distinct network modules or communities. (b) Dynamics of networks indicates that the edges of the network themselves change either in their existence/absence or in their strength. Here we illustrate the coalescence of modules (blue and yellow), as well as the transfer of allegiance of a single region from one module (pink) to another (yellow) over time. This latter process can be quantified using the statistic of network flexibility, and has been shown to be an important indicator of human learning141 and a correlate of individual differences in executive function142. (c) Although not yet common, studies addressing the combined problem of dynamics on and of networks will be of increasing importance in the coming years. There is a critical need to better understand the relationships between changes in connectivity and changes in activity, gray matter, neurotransmitter levels, genetic expression or other nodal properties. Methods to bridge these scales will be critical in advancing network neuroscience toward more mechanistic models and insights. (d) One particularly useful construct in the context of dynamic and multimodal networks is that of multilayer networks. Multilayer networks are networks whose nodes may be connected by different types of edges, with each type being encoded in a different layer. These layers could, for example, represent different time points, subjects, tasks, brain states, ages or imaging modalities. In multilayer networks, nodes in one layer are connected to corresponding nodes in other layers by identity links (a distinct sort of edge), which hardcode the non-independence of data obtained from these nodes. Here we show the simplest case in which all nodes and all edges exist in all layers, but multilayer network tools can also be used in cases in which nodes and edges change across layers. We also illustrate the simplest inter-layer connection pattern, with identity links connecting consecutive layers; however, alternative connection patterns are possible.
Figure 5
Figure 5
Controlling brain networks. Following a careful description of the network properties of the brain, we might wish to intervene: to push a diseased brain toward health or to enhance the function of a brain that might not be reaching its full potential. In the context of brain networks, this question becomes has provided a question of so-called ‘network control’, for which the field of engineering extensive and carefully validated solutions in recent years112. (a,b) Here we illustrate a problem in which we wish to modulate the activity of three brain regions (blue, peach, gold; a) that are connected both to one another and to other regions in the brain by aset of anatomical links of varying strength or weight (b). (c,d) We wish to determine the amount of control energy (which can take the form of brain stimulation or task demands) that must be injected into brain regions at each time point (c) to affect a continuous change in the amplitude of the three brain regions of interest from a (d), moving them from an initial state characterized by one pattern of activation to a target state characterized by a different pattern of activation. One way to address this problem is to model brain dynamics as a (linear or nonlinear) function of an initial state x, a structural adjacency matrix A and a control energy matrix C. Using techniques from network control theory, we can solve for the optimal control energy, which is usually defined as the smallest amount of energy required to affect the transition (from initial to final state) in a given time period T. Interesting problems include determining which regions can affect which types of control, which regions form optimal targets or optimal drivers, how many control points are required, and which transitions are preferredby the system. In many cases, the best model of dynamics is unknown, and in this case an engineering technique known as systems identification can be very useful; this technique reveals not only the model of dynamics, but also the structural matrix A that best explains regional time series. Note that the a matrix uncovered by systems identification might not be identical to an anatomical matrix of synaptic connections. In the coming years, we anticipate that these techniques, and their careful adaptions to neural systems, will prove to be particularly useful in the control of brain networks both for clinical purposes, for example, in optimizing transcranial magnetic stimulation to large-scale brain regions in the human brain.
Figure 6
Figure 6
Epilepsy as a multiscale network disorder amenable to control. (a–c) Epileptic activity can be observed across spatial scales, from the level of single neurons up through the level of large-scale areas. (a) Spatial configuration of neurons during an interictal spike in the stratum oriens of a mouse; scale bar represents 10 μm. Reproduced from ref. , Sarah Feldt Muldoon, Vincent Villette, Thomas Tressard, Arnaud Malvache, Susanne Reichinnek, Fabrice Bartolomei, Rosa Cossart, GABAergic inhibition shapes interictal dynamics in awake epileptic mice, Brain, 2015, 138, 10, 2875–2890, by permission of Oxford University Press. (b) Cellular activity over a scale of 30-μm clusters together dynamically, forming network modules each shown in a different color, and these clusters are altered in the epileptic brain indicating a microscale network disorder. Over long periods of time, these changes in activity alter the underlying structural connectivity between ensembles, permanently changing the anatomical constraints on neurophysiological processes. Reproduced from ref. , National Academy of Sciences. (c) This clustering at the level of neuronal ensembles is accompanied by a large-scale oscillatory signature in intracranial electrocorticographic recordings. Reproduced from ref. , National Academy of Sciences. (d,e) Neurological disorders such as epilepsy are amenable to interventions that are informed by notions of network control. (d) The large-scale dynamics of epilepsy are characterized by a spatially intricate and temporally evolving pattern of synchronization and desynchronization that suggests the presence of a homeostatic push-pull control mechanism (bottom), whereby a regulatory network outside of the seizure generating zone controls the spread of seizure activity (top). These data provide two distinct targets for surgical and stimulation-based intervention: the seizure-generating zone, and the seizure-regulating zone. Reproduced from ref. , Elsevier. (e) Exogenously controlling the dynamics in either of these zones using stimulation requires careful computational models of control mechanisms, optimal stimulation intensities and optimal targets of that stimulation as a function of time. For example, here we illustrate recent work that models these large-scale dynamics using Wilson-Cowan oscillators. A distributed control mechanism, in which control is enacted by all stimulation sites, may be useful for quieting seizure activity, particularly when the underlying structural network is relatively random (top). However, when the underlying structural connectivity displays a small-world organization, a blanket distributed control mechanism is less effective, and may instead need to be better tuned to control drivers in the regulatory or seizure-generating networks (bottom). Reprinted with permission from ref. as follows: ShiNung Ching, Emery N. Brown & Mark A. Kramer, Phys. Rev. E, 86, 021920 (2012), Copyright 2012 by the American Physical Society.
Figure 7
Figure 7
Relations among anatomical connectivity and gene co-expression networks. Top left, matrix of anatomical connections among 213 mouse brain regions. Regions (nodes) with more than 44 distinct connections were considered hubs, and connections were classified as hub→hub (rich), hub→nonhub (feeder) or nonhub→nonhub (peripheral). Bottom left, normalized expression levels of 17,642 genes across 213 brain regions. Genes with highly correlated expression profiles are placed near each other. Right, brain regions have been arranged around a circle, ordered by number of connections (bars) in each anatomical subdivision. Hubs are marked by red bars. The connection diagram traces anatomical connections between pairs of brain regions, color-coded by the corresponding gene coexpression value, after applying a correction for spatial distance. Statistical analysis revealed strongest gene coexpression among pairs of regions linked by reciprocal connections (as compared with unidirectional or unconnected pairs), as well as for rich connections linking hubs (as compared with feeder and peripheral connections). Genes driving correlations in expression in connections involving hub regions are functionally enriched in oxidative energy metabolism. Connectivity data derived from ref. . Reproduced from ref. , National Academy of Sciences.
Figure 8
Figure 8
Crossing scales from brain networks to social networks. (a–c) As we interact with one another, our patterns of brain activity can track together, whether in a single voxel (a; inter-subject correlations), from a single voxel to other voxels (b; inter-subject functional correlation) or from any voxel to any other voxel (c; inter-subject functional covariance). These patterns can be studied from a network perspective using the tools of graph theory to better understand how relationships between individuals affect the similarities and differences in our patterns of brain activity. Taking the idea one step further, we can study how the patterns of brain activity in a person who is central in their social network differ from the patterns of brain activity in a person who is less central to their social network. Indeed, how our brains respond to or can be predicted from our social networks is a critical open question with direct import for health interventions at the large-scale of neighborhoods, cities, countries, and cultures (see also ref. 137). a–c adapted from ref. , Springer Nature, and d adapted from ref. , R. Schmaelzle, M.B. O’Donnell, J.O. Garcia, C.N.C. Cascio, J. Bayer, D. Bassett, J. Vettel and E.B. Falk.

Similar articles

Cited by

References

    1. Sejnowski TJ, Churchland PS, Movshon JA. Putting big data to good use in neuroscience. Nat Neurosci. 2014;17:1440–1441. - PMC - PubMed
    1. Jorgenson LA, et al. The BRAIN Initiative: developing technology to catalyse neuroscience discovery. Phil Trans R Soc B. 2015;370:20140164. - PMC - PubMed
    1. Bullmore E, Sporns O. Complex brain networks: graph theoretical analysis of structural and functional systems. Nat Rev Neurosci. 2009;10:186–198. - PubMed
    1. Sporns O. Contributions and challenges for network models in cognitive neuroscience. Nat Neurosci. 2014;17:652–660. - PubMed
    1. Medaglia JD, Lynall ME, Bassett DS. Cognitive network neuroscience. J Cogn Neurosci. 2015;27:1471–1491. - PMC - PubMed