Review
. 2017 Feb 23;20(3):365-377.
doi: 10.1038/nn.4478.

Building better biomarkers: brain models in translational neuroimaging

Affiliations
Review

Building better biomarkers: brain models in translational neuroimaging

Choong-Wan Woo et al. Nat Neurosci. .

Abstract

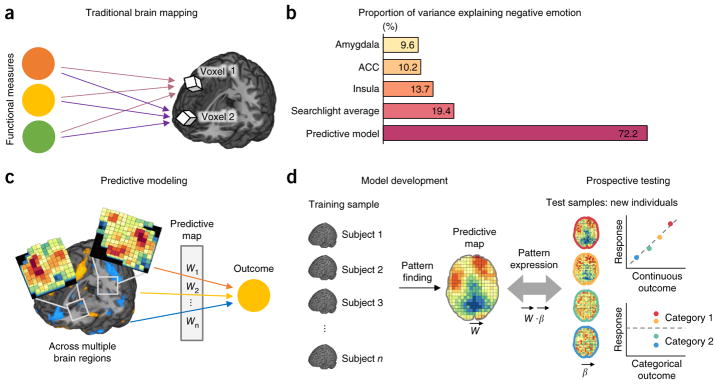
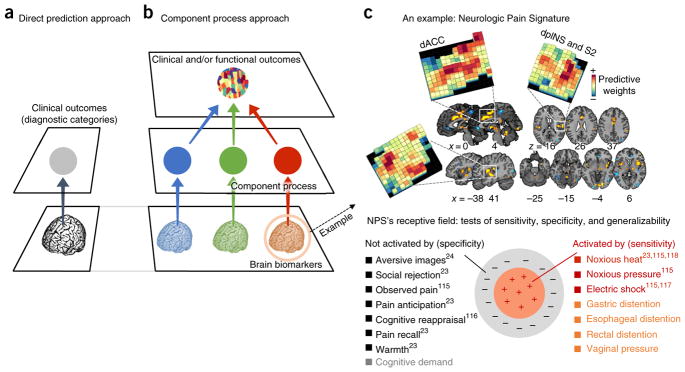
Despite its great promise, neuroimaging has yet to substantially impact clinical practice and public health. However, a developing synergy between emerging analysis techniques and data-sharing initiatives has the potential to transform the role of neuroimaging in clinical applications. We review the state of translational neuroimaging and outline an approach to developing brain signatures that can be shared, tested in multiple contexts and applied in clinical settings. The approach rests on three pillars: (i) the use of multivariate pattern-recognition techniques to develop brain signatures for clinical outcomes and relevant mental processes; (ii) assessment and optimization of their diagnostic value; and (iii) a program of broad exploration followed by increasingly rigorous assessment of generalizability across samples, research contexts and populations. Increasingly sophisticated models based on these principles will help to overcome some of the obstacles on the road from basic neuroscience to better health and will ultimately serve both basic and applied goals.


Figures

Figure 5
Figure 5
Varieties of predictive models. Developing a predictive model entails making choices about its input data, structural properties, and level of analysis. Five of the most important choices are discussed in Box 1.
Figure 1
Figure 1
Standard mapping versus predictive modeling. (a) Traditional brain mapping, often called mass-univariate analysis or voxelwise encoding model. Brain maps are constructed by conducting massive number of tests on brain voxels one at a time. (b) An example showing small effect sizes (here, explained variance) when one brain region is considered in isolation and larger effect sizes for a multivariate model. Chang et al. showed that local regions, including amygdala, anterior cingulate cortex (ACC), insula or searchlights, explained much less variance in experienced negative emotion than a whole-brain predictive model. (c) Predictive modeling explicitly aims to develop brain models that are tightly coupled with target outcomes. w1, w2, … wn represent predictive weights across voxels. (d) Predictive model development and prospective testing. Here, a predictive map (w⃗) comprised of predictive weights across voxels is developed based on a training sample (i.e., a group of individuals) and tested on independent test samples (i.e., new individuals). The weights specify how to integrate brain data to produce a single prediction about the outcome, which could be continuous or categorical. In this example, calculating the dot product between the predictive map and the test images—a weighted sum of activity across the test image (β⃗), with the predictive map specifying the weights (w⃗)—generates a predicted outcome for each participant. The sensitivity, specificity and other properties of the predictive map are estimated from test samples. Data in b from Chang et al..
Figure 2
Figure 2
A snapshot of translational neuroimaging using multivariate predictive models. We searched PubMed for original neuroimaging research articles (including EEG, positron-emission topography (PET), MRI, diffusion tensor imaging (DTI) and arterial spin labeling (ASL)) published between 1983 and January 2016. The search terms can be found via this link: http://goo.gl/N7oh0i. Nonhuman and nonclinical studies were excluded, as well as those that did not employ multivariate pattern recognition. The initial search yielded 2,767 studies, of which 536 studies were selected based on review of their abstracts. Full-text review was used to select 475 studies that included 615 classification or predictive maps. (a) Top: growth of pattern recognition studies in translational neuroimaging since 2004. Bottom: growth of sample sizes in translational neuroimaging studies. The y-axis shows the largest sample size among studies published each year. (b) Breakdown of studies by diagnostic category. PTSD, post-traumatic stress disorder. ADHD, attention deficit hyperactivity disorder. (c) Uses of pattern recognition models. ‘Diagnosis’ refers to patient vs. control classification and ‘risk group’ to classification of groups at high risk (for example, relatives of people with disorders) vs. controls. ‘Symptom’ refers to prediction of continuous symptom scores. ‘Subtype’ refers to identification of subgroups of patients based on brain patterns. ‘Prognosis’ and ‘treatment response’ refer to predictions of individual differences in disease progression and response to an intervention, respectively. ‘Component process’ studies identify predictive models for basic cognitive or affective processes and apply those to classifying patient groups or to predicting symptoms in patients. (d) Precision-weighted accuracy, based on the square root of the sample size, for patient vs. control classification in model-development samples. Here we show classification accuracy only for patient vs. control classification, which was the most common use across disorders (75% of predictive models). The size of the circles shows the precision estimates, with larger circles indicating larger samples and more precise estimates. Accuracy was nearly always estimated using cross-validation. (e) Classification results from prospective testing on independent data sets. Only a small minority of studies report prospective tests. Lower accuracy in independent tests is indicative of bias in cross-validated accuracy estimates from training samples. Accuracy is lower in most cases reviewed here, with AD classification showing least evidence for bias. (f) Diagnostic classification accuracy as a function of sample size for six types of disorders. As the estimates from the largest studies are the most precise, they are most representative of the true accuracy. Across disorders, very high classification accuracy is reported in some small studies, but these have not been replicated in prospective tests. With a few exceptions, accuracy values for large-sample studies are much more modest. These observations point to the need for improvements in statistical model development, data aggregation and prospective testing of promising models across multiple, diverse samples.
Figure 3
Figure 3
Brain signature development and validation. (a) In this process, broad exploration is the first step. Just as drug development involves screening many candidate drugs, exploring multiple approaches and models is important for identifying promising biomarkers. The most promising models must be tested in independent samples to demonstrate their diagnostic accuracy. During characterization, promising candidate biomarkers should show robust replications of findings (for example, high sensitivity and specificity) across multiple independent samples, laboratories, scanners and research settings. This requires tests in larger, more definitive studies, which can eventually promote identification of these biomarkers as surrogate measures and as endpoints in their own right. (b) Starting with many candidate models, the most promising ones garner support and are carried forward with increasing levels of evidence. In the development phase, models can be developed based on one study sample and model performance can be estimated using cross-validation. In the prospective validation phase, findings and model performance (i.e., sensitivity, specificity and predictive value) are replicated by applying models to new, independent samples of participants. In the generalization phase, findings and model performance are tested across multiple laboratories, scanners and variants of testing procedures to assess the models’ robustness and boundary conditions. In the population-level phase, large-scale tests assess the model’s performance when it is applied to diverse populations and test conditions, and additional moderators (i.e., age, race, culture, gender) and boundary conditions are identified in this phase. In this illustration, colored blocks denote the different phases, and black lines indicate hypothetical candidate models. Within each phase, a model can be more or less thoroughly evaluated and more or less successful at establishing utility. This variability is denoted graphically by the variable locations of dots for each model within each phase. A survey of empirical literature to date reveals that only 9% of neuroimaging-based models go beyond the initial development phase. Some notable exceptions include the named models shown here, which have been tested prospectively on new samples (see Table 2 for details and abbreviations).
Figure 4
Figure 4
Future directions. (a) The direct prediction approach, in which brain features are mapped to clinical diagnostic categories or symptoms directly. (b) The component process approach, in which brain features are mapped to basic component processes, such as sustained attention load, memory load, positive or negative affect, pain and others. By introducing this additional layer, brain signatures can have implications for behavior and function beyond patient status or current diagnostic categories. This new level of analysis provides a way of understanding the nature of dysregulated brain processes, assessing risk factors for brain disorders, and understanding and predicting treatment responses. Rather than constructing one brain marker per disorder, component models provide a set of basis processes that are combined in different ways in different disorders. By analogy with color, three components (red, green and blue) can be combined in different ways to form a virtually infinite number of colors. (c) The NPS is a signature for one such component process, evoked somatic pain, that is potentially dysregulated in multiple disorders. The NPS is defined by brain-wide, mesoscale patterns of fMRI activity across multiple pain-related regions and can be prospectively tested on new individuals and datasets. This allows its properties to be characterized across studies, improving understanding of the types of mental processes and experiences it represents. Top: the NPS pattern map thresholded at q < 0.05, false discovery rate (FDR)-corrected for display purposes; the unthresholded patterns in selected regions (dACC, dorsal ACC; dorsal posterior insula, dpINS; secondary somatosensory cortex, S2) are visualized in the insets. Bottom: the NPS’s ‘psychological receptive field’, which visualizes conditions that activate (sensitivity, in orange and red) or do not activate (specificity, in gray and black) the NPS. Dark colored conditions (in red and black) are from published results,,–, and light colored conditions (in orange and gray) are from unpublished, preliminary results (data on cognitive demand were tested by C.-W.W.; visceral and vaginal pain data were tested by T.D.W.). Characterizing the NPS’s sensitivity and specificity across these conditions and others aides in understanding what NPS alterations in clinical disorders mean from a psychological and functional perspective. In the future, we envision clinical biomarkers composed of sets of interpretable, well characterized models of basic cognitive and affective processes.

Similar articles

Cited by

References

    1. Mather M, Cacioppo JT, Kanwisher N. Introduction to the special section: 20 years of fMRI-what has it done for understanding cognition? Perspect Psychol Sci. 2013;8:41–43. - PubMed
    1. Kapur S, Phillips AG, Insel TR. Why has it taken so long for biological psychiatry to develop clinical tests and what to do about it? Mol Psychiatry. 2012;17:1174–1179. - PubMed
    1. Mayberg HS, et al. Reciprocal limbic-cortical function and negative mood: converging PET findings in depression and normal sadness. Am J Psychiatry. 1999;156:675–682. - PubMed
    1. Keedwell PA, Andrew C, Williams SC, Brammer MJ, Phillips ML. The neural correlates of anhedonia in major depressive disorder. Biol Psychiatry. 2005;58:843–853. - PubMed
    1. Tom SM, Fox CR, Trepel C, Poldrack RA. The neural basis of loss aversion in decision-making under risk. Science. 2007;315:515–518. - PubMed

LinkOut - more resources