

Mesenchymal stromal cells inhibit CD25 expression via the mTOR pathway to potentiate T-cell suppression
- PMID: 28230853
- PMCID: PMC5386489
- DOI: 10.1038/cddis.2017.45
Mesenchymal stromal cells inhibit CD25 expression via the mTOR pathway to potentiate T-cell suppression
Abstract
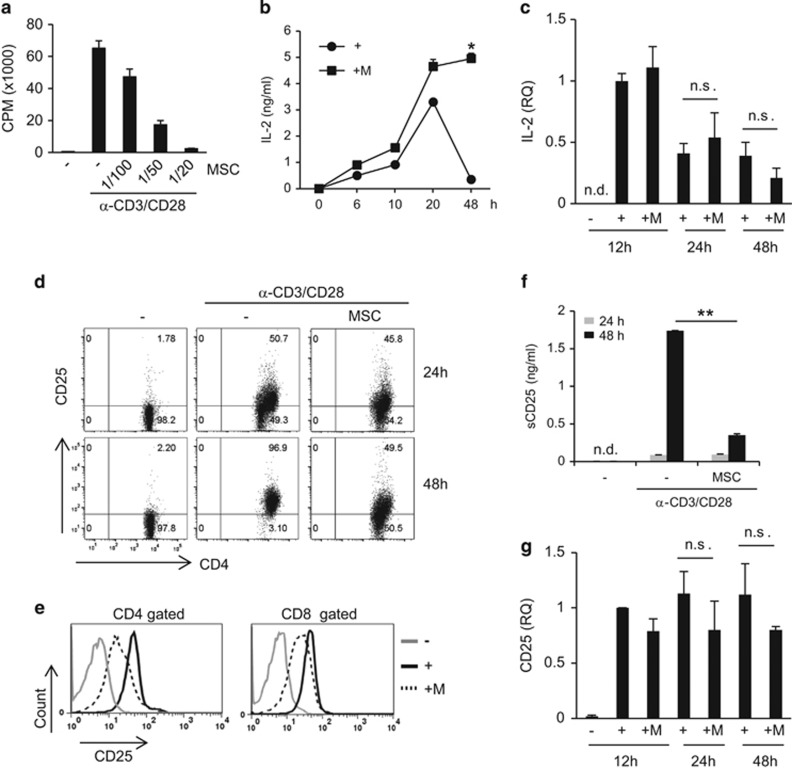
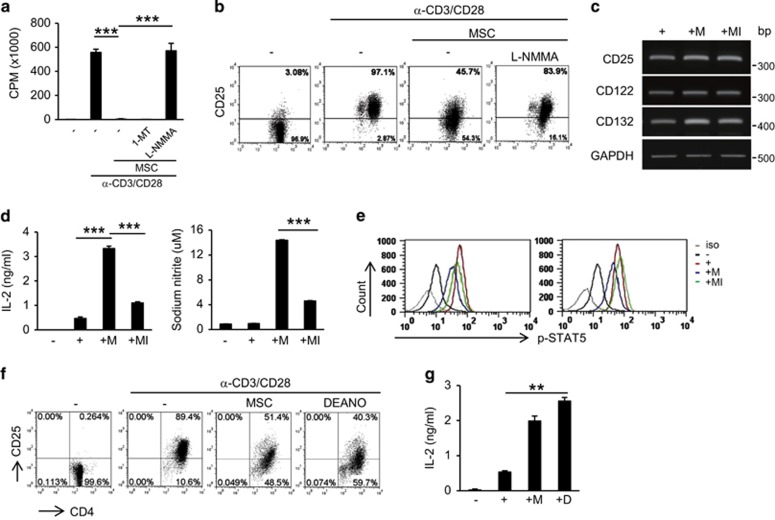
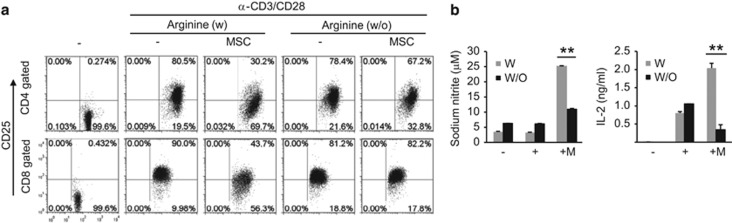
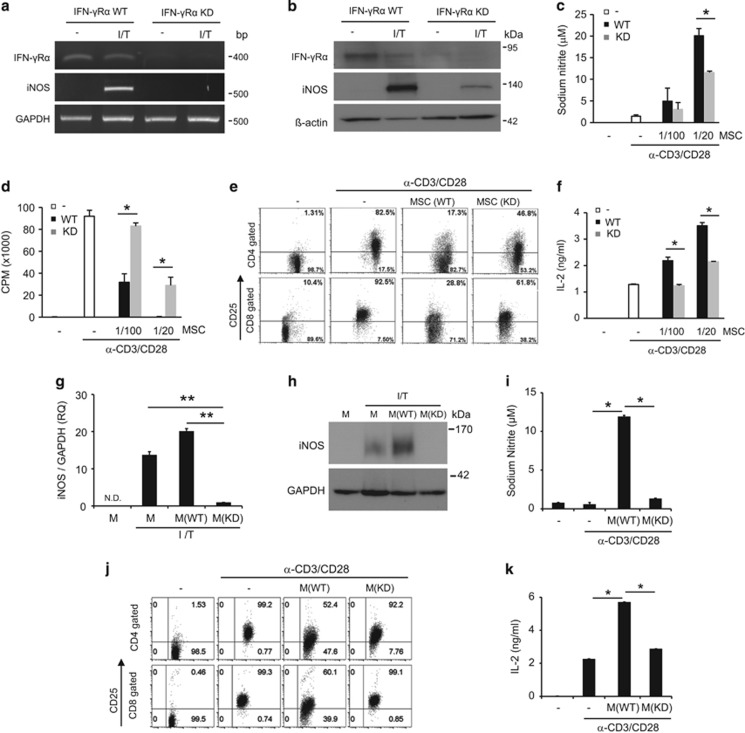
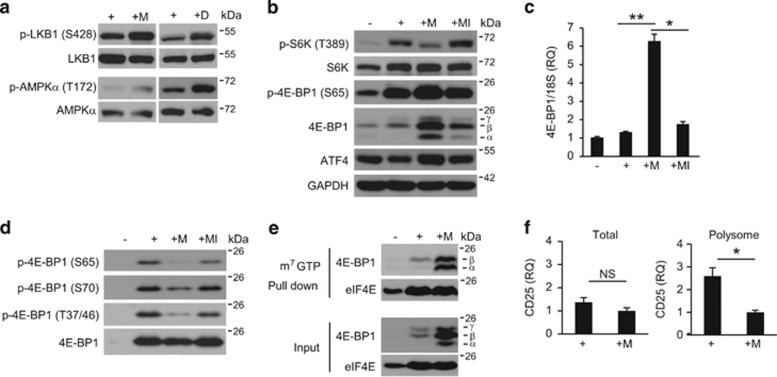
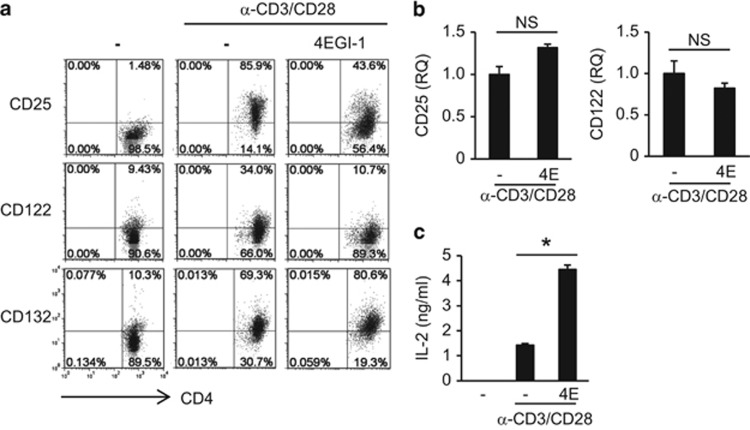
Mesenchymal stromal cells (MSCs) are known to suppress T-cell activation and proliferation. Several studies have reported that MSCs suppress CD25 expression in T cells. However, the molecular mechanism underlying MSC-mediated suppression of CD25 expression has not been fully examined. Here, we investigated the mTOR pathway, which is involved in CD25 expression in T cells. We showed that MSCs inhibited CD25 expression, which was restored in the presence of an inducible nitric oxide synthase (iNOS) inhibitor. Since CD25 mRNA expression was not inhibited, we focused on determining whether MSCs modulated components of the mTOR pathway in T cells. MSCs increased the phosphorylation of liver kinase B1 (LKB1) and AMP-activated protein kinase (AMPK) and decreased the phosphorylation of ribosomal protein S6 kinase 1 (S6K1) and eukaryotic translation initiation factor 4E-binding protein 1 (4E-BP1). In addition, the expression of 4E-BP1 increased dramatically in the presence of MSCs. An m7GTP pull-down assay showed increased binding of 4E-BP1 to the 5' cap-binding eukaryotic translation initiation factor 4E (eIF4E) complex in the presence of MSCs, which resulted in inhibition of mRNA translation. Treatment with 4EGI-1, a synthetic inhibitor of mRNA translation, also reduced CD25 expression in T cells. Polysome analysis confirmed decreased CD25 mRNA in the polysome-rich fraction in the presence of MSCs. Taken together, our results showed that nitric oxide, produced by MSCs, inhibits CD25 translation through regulation of the LKB1-AMPK-mTOR pathway to suppress T cells.
Conflict of interest statement
The authors declare no conflict of interest.
Figures
Similar articles
-
Glucagon represses signaling through the mammalian target of rapamycin in rat liver by activating AMP-activated protein kinase.J Biol Chem. 2004 Dec 24;279(52):54103-9. doi: 10.1074/jbc.M410755200. Epub 2004 Oct 19. J Biol Chem. 2004. PMID: 15494402
-
Fibronectin stimulates non-small cell lung carcinoma cell growth through activation of Akt/mammalian target of rapamycin/S6 kinase and inactivation of LKB1/AMP-activated protein kinase signal pathways.Cancer Res. 2006 Jan 1;66(1):315-23. doi: 10.1158/0008-5472.CAN-05-2367. Cancer Res. 2006. PMID: 16397245
-
Arginine-induced stimulation of protein synthesis and survival in IPEC-J2 cells is mediated by mTOR but not nitric oxide.Am J Physiol Endocrinol Metab. 2010 Dec;299(6):E899-909. doi: 10.1152/ajpendo.00068.2010. Epub 2010 Sep 14. Am J Physiol Endocrinol Metab. 2010. PMID: 20841502
-
Signaling networks in immunometabolism.Cell Res. 2020 Apr;30(4):328-342. doi: 10.1038/s41422-020-0301-1. Epub 2020 Mar 20. Cell Res. 2020. PMID: 32203134 Free PMC article. Review.
-
Amino acid metabolism and signalling pathways: potential targets in the control of infection and immunity.Nutr Diabetes. 2021 Jun 23;11(1):20. doi: 10.1038/s41387-021-00164-1. Nutr Diabetes. 2021. PMID: 34168115 Free PMC article. Review.
Cited by
-
Loss of A20 in BM-MSCs regulates the Th17/Treg balance in Rheumatoid Arthritis.Sci Rep. 2018 Jan 11;8(1):427. doi: 10.1038/s41598-017-18693-0. Sci Rep. 2018. PMID: 29323140 Free PMC article.
-
Extracellular vesicles from human umbilical cord blood plasma modulate interleukin-2 signaling of T cells to ameliorate experimental autoimmune encephalomyelitis.Theranostics. 2020 Apr 6;10(11):5011-5028. doi: 10.7150/thno.42742. eCollection 2020. Theranostics. 2020. PMID: 32308765 Free PMC article.
-
Mesenchymal Stem Cells from Mouse Hair Follicles Inhibit the Development of Type 1 Diabetes.Int J Mol Sci. 2024 May 29;25(11):5974. doi: 10.3390/ijms25115974. Int J Mol Sci. 2024. PMID: 38892159 Free PMC article.
-
The aryl hydrocarbon receptor controls mesenchymal stromal cell-mediated immunomodulation via ubiquitination of eukaryotic elongation factor-2 kinase.Cell Death Dis. 2023 Dec 9;14(12):812. doi: 10.1038/s41419-023-06341-7. Cell Death Dis. 2023. PMID: 38071243 Free PMC article.
-
Regulatory Effect of Mesenchymal Stem Cells on T Cell Phenotypes in Autoimmune Diseases.Stem Cells Int. 2021 Mar 30;2021:5583994. doi: 10.1155/2021/5583994. eCollection 2021. Stem Cells Int. 2021. PMID: 33859701 Free PMC article. Review.
References
MeSH terms
Substances
LinkOut - more resources
Full Text Sources
Other Literature Sources
Research Materials
Miscellaneous
