. 2017 Feb 23;8(2):e2621.
doi: 10.1038/cddis.2017.50.

Oncogenic role of rab escort protein 1 through EGFR and STAT3 pathway

Affiliations

Oncogenic role of rab escort protein 1 through EGFR and STAT3 pathway

Un-Jung Yun et al. Cell Death Dis. .

Abstract

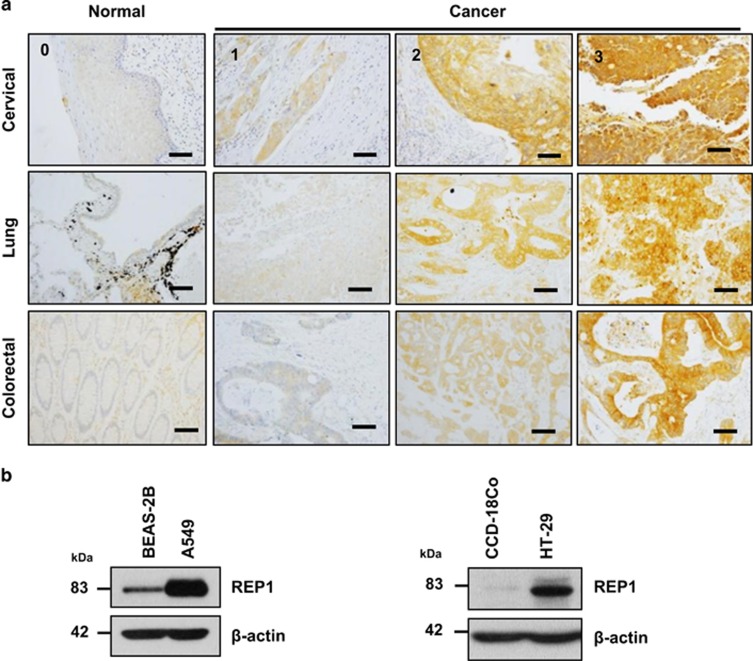
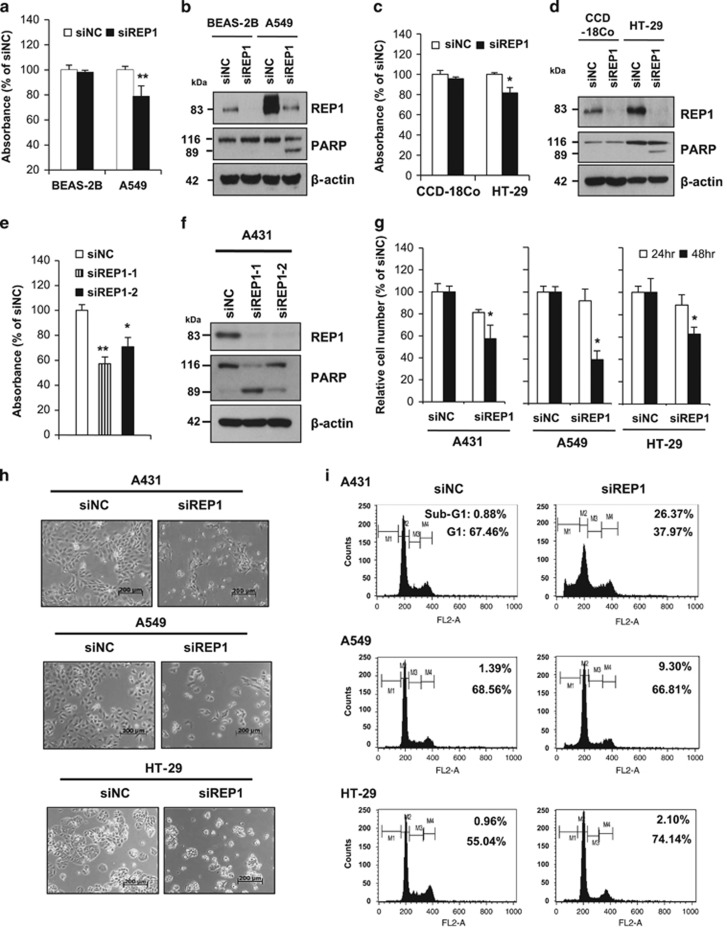
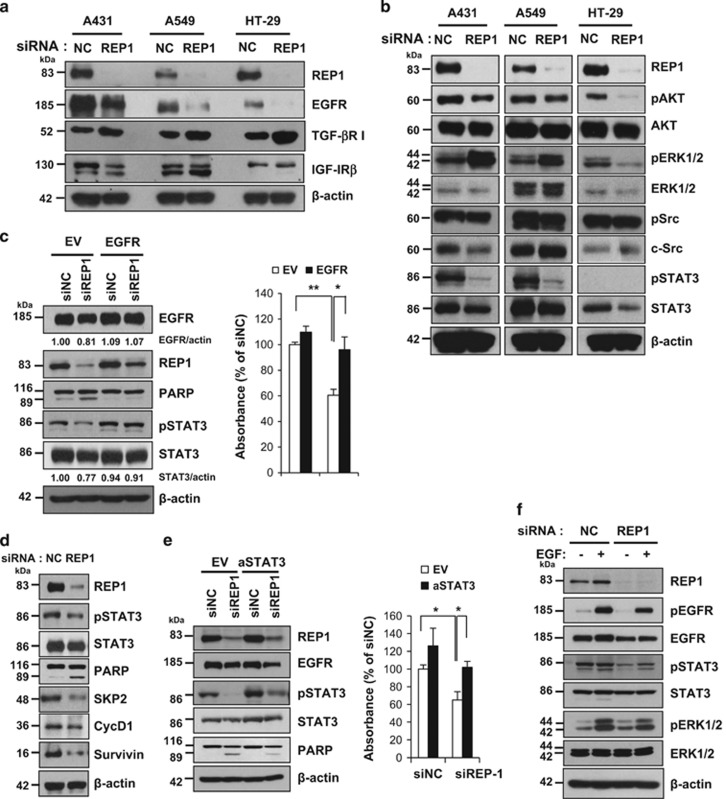
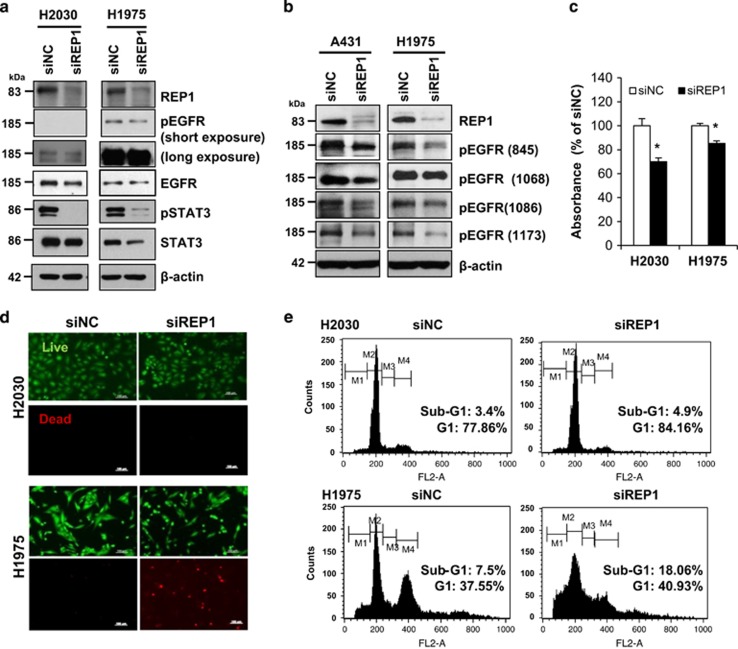
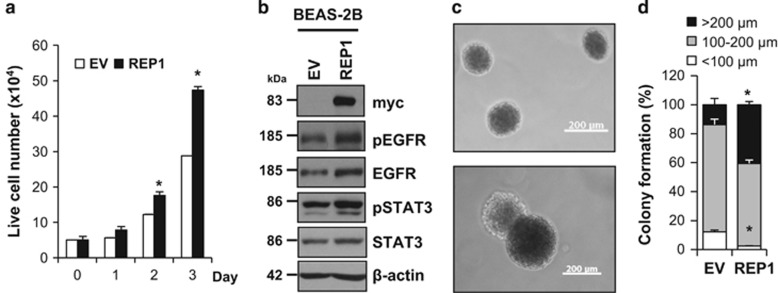
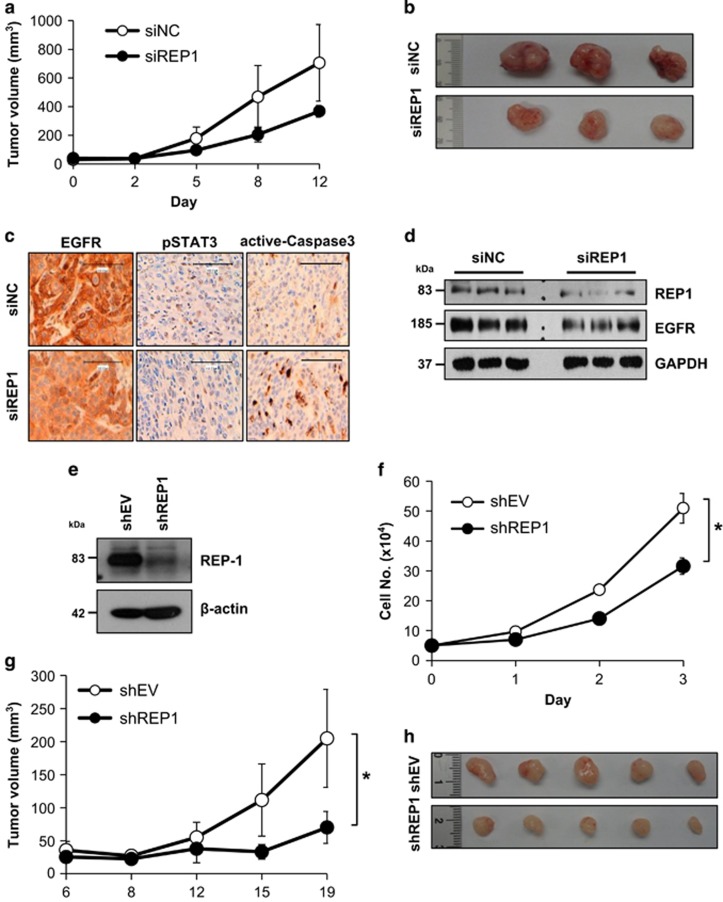
Rab escort protein-1 (REP1) is linked to choroideremia (CHM), an X-linked degenerative disorder caused by mutations of the gene encoding REP1 (CHM). REP1 mutant zebrafish showed excessive cell death throughout the body, including the eyes, indicating that REP1 is critical for cell survival, a hallmark of cancer. In the present study, we found that REP1 is overexpressed in human tumor tissues from cervical, lung, and colorectal cancer patients, whereas it is expressed at relatively low levels in the normal tissue counterparts. REP1 expression was also elevated in A549 lung cancer cells and HT-29 colon cancer cells compared with BEAS-2B normal lung and CCD-18Co normal colon epithelial cells, respectively. Interestingly, short interfering RNA (siRNA)-mediated REP1 knockdown-induced growth inhibition of cancer cell lines via downregulation of EGFR and inactivation of STAT3, but had a negligible effect on normal cell lines. Moreover, overexpression of REP1 in BEAS-2B cells enhanced cell growth and anchorage-independent colony formation with little increase in EGFR level and STAT3 activation. Furthermore, REP1 knockdown effectively reduced tumor growth in a mouse xenograft model via EGFR downregulation and STAT3 inactivation in vivo. These data suggest that REP1 plays an oncogenic role, driving tumorigenicity via EGFR and STAT3 signaling, and is a potential therapeutic target to control cancers.


Conflict of interest statement

The authors declare no conflict of interest.

Figures

Figure 1
Figure 1
REP1 expression in human cancer tissues and cancer cell lines. (a) Cancer patient-derived microarrays for cervical, lung, and colorectal tissue were examined for REP1 expression using an immunoperoxidase method. Staining results were graded according to the intensity and proportion of positive cells as described in ‘Materials and Methods'. Scale bar=50 μm. (b) A human normal lung epithelial cell line BEAS-2B and a lung adenocarcinoma cell line A549, and a normal colon epithelial cell line CCD-18Co and a colorectal adenocarcinoma cell line HT-29 were processed for immunoblot analysis using anti-REP1 antibody and β-actin antibody was used as a loading control. These experiments were performed three independent times with comparable results
Figure 2
Figure 2
Effects of REP1 knockdown on cell growth and apoptosis. (a and b) BEAS-2B and A549 cells were transfected with either siNC or siREP1. Cell growth was measured by MTS assay at 48 h after transfection, with error bars representing S.D. (versus siNC, **P<0.01) (a) and cellular proteins were subjected to immunoblot analysis using indicated antibodies (b). (c and d) CCD-18Co and HT-29 cells were transfected with either siNC or siREP1. Cell growth was measured by MTS assay at 48 h after transfection, with error bars representing S.D. (versus siNC, *P<0.05) (c) and cellular proteins were subjected to immunoblot analysis using indicated antibodies (d). (e) A431 cells were transfected with either non-specific control siRNAs (siNC) or two different siRNAs specific for REP1 (siREP1-1 and siREP1-2) and cell growth was measured by MTS assay at 48 h after transfection, with error bars representing S.D. (versus siNC, *P<0.05, **P<0.01). (f) A431 cells were treated as in e and cell lysates were subjected to immunoblot analysis using anti-REP1, -PARP, and -β-actin antibodies. (g, h and i) A431, A549, and HT-29 cells were transfected with either siNC or siREP1. Live cells were counted by trypan blue staining, with error bars representing S.D. (versus siNC, *P<0.05) (g), cell images were taken using phase contrast microscopy. Magnification: × 50; scale bar=200 μm (h), or cells were subjected to Sub-G1 analysis by flow cytometry (M1, sub-G1 phase; M2, G1 phase; M3, S phase; M4, G2/M phase) (i). Similar results were observed in three independent experiments
Figure 3
Figure 3
Effects of REP1 knockdown on EGFR levels. (a and b) A431, A549, and HT-29 cells were transfected with either siNC or siREP1 for 48 h and cell lysates were subjected to immunoblot analysis using indicated antibodies. (c) A431 cells were transfected with either empty vector (EV) and siNC, EV and siREP1, EGFR plasmid and siNC, or EGFR plasmid and siREP1 together for 48 h. Cell lysates were subjected to immunoblot analysis using indicated antibodies and cell growth was assessed by MTS assay, with error bars representing S.D. (*P<0.05, **P<0.01). (d) A431 cells were transfected with either siNC or siREP1 for 48 h and cell lysates were subjected to immunoblot analysis using indicated antibodies. (e) A431 cells were transfected with either EV and siNC, EV and siREP1, active STAT3 (aSTAT3) and siNC, or aSTAT3 and siREP1 together for 48 h. Cell lysates were processed for immunoblot analysis using indicated antibodies and cell growth was measured by MTS assay, with error bars representing S.D. (*P<0.05). (f) A431 cells were transfected with either siNC or siREP1 for 48 h and then treated with 1 nM EGF for 10 min. Cell lysates were subjected to immunoblot analysis using indicated antibodies. The experiments were performed three times with similar results
Figure 4
Figure 4
Effects of REP1 knockdown on NSCLC with EGFR mutation. (a) H2030 and H1975 cells were transfected with either siNC or siREP1 for 48 h and cell lysates were subjected to immunoblot analysis using indicated antibodies. (b) A431 and H1975 cells were transfected with either siNC or siREP1 for 48 h and cell lysates were processed for immunoblot analysis using anti-phospho-EGFR antibodies specific for tyrosine residues at 845, 1068, 1086, and 1173, respectively. (c, d and e) H2030 and H1975 cells were transfected with siRNAs as in a, followed by MTS assay, with error bars representing S.D. (*P<0.05) (c), live/dead analysis by staining with calcein-AM and PI (d), and cell cycle analysis by flow cytometry (e). Images were taken by fluorescence microscopy. Magnification: x100; Scale bar=100 μm. (M1, sub-G1 phase; M2, G1 phase; M3, S phase; M4, G2/M phase). Similar results were observed in three independent experiments
Figure 5
Figure 5
Effects of REP1 overexpression on normal cell growth. (a and b) BEAS-2B cells were transfected with either EV or REP1-myc plasmid. To assess cell growth, transfected cells were stained with trypan blue and trypan blue negative cells were counted as live cells, with error bars representing S.D. (versus EV, *P<0.05) (a). Cell lysates at 72 h were subjected to immunoblot analysis using indicated antibodies (b). (c and d) BEAS-2B cells transfected empty vector or REP1-myc plasmid were subjected to soft agar colony-formation assay. Representative colony images were taken using phase contrast microscopy. Magnification: × 50, Scale bar=200 μm (c). Colony sizes were measured and summarized in the histogram, with error bars representing S.D. (versus EV, *P<0.05) (d). Similar results were observed in three independent experiments
Figure 6
Figure 6
Effects of REP1 knockdown on tumor growth in the xenografted mice. (a, b, c, and d) A431 cells (2.5 × 10⁶) were injected subcutaneously into the nude mice. When tumor size reached 30 mm3, siRNA in the atelogene gel was injected to encompass the whole tumor mass (n=3 per group). Tumor size was then measured at the indicated times (a). After sacrificing the mice, tumor tissues were taken and representative images of tumors are shown (b). Tumor tissue were either stained with indicated antibodies for immunochemistry analysis (c) or processed for immunoblot analysis using indicated antibodies (d). Magnification: × 200, Scale bar=100 μm. (e) Stable A431 cells expressing either shEV or shREP1 were established and cell lysates were processed for immunoblot analysis using indicated antibodies. (f) A431 cells (5 × 10⁴) expressing shEV or shREP1 were grown for 3 days and cell growth was measured by trypan blue staining at indicated times, with error bars representing S.D. (*P<0.05). (g and h) A431 cells (2.5 × 10⁶) expressing shEV or shREP1 were injected subcutaneously into the nude mice (n=5 per group). Tumor size was then measured at the indicated times, with error bars representing S.D. (*P<0.05) (g). After sacrificing the mice, tumor tissues were taken and representative images of tumors are shown (h). Similar results were observed in two independent experiments

Similar articles

Cited by

References

    1. Yarden Y, Pines G. The ERBB network: at last, cancer therapy meets systems biology. Nat Rev Cancer 2012; 12: 553–563. - PubMed
    1. Tebbutt N, Pedersen MW, Johns TG. Targeting the ERBB family in cancer: couples therapy. Nat Rev Cancer 2013; 13: 663–673. - PubMed
    1. Pao W, Chmielecki J. Rational, biologically based treatment of EGFR-mutant non-small-cell lung cancer. Nat Rev Cancer 2010; 10: 760–774. - PMC - PubMed
    1. Furnari FB, Cloughesy TF, Cavenee WK, Mischel PS. Heterogeneity of epidermal growth factor receptor signalling networks in glioblastoma. Nat Rev Cancer 2015; 15: 302–310. - PMC - PubMed
    1. Chong CR, Janne PA. The quest to overcome resistance to EGFR-targeted therapies in cancer. Nat Med 2013; 19: 1389–1400. - PMC - PubMed